
Dell-2018
Report generated: Tue Oct 6 22:02:25 2026 UTCStart Time: Sat Sep 27 22:01:04 2025 UTC
End Time: Tue Oct 6 22:01:04 2026 UTC
Report Period: 374.0 days
Stats for the last 1, 7, 35, 98, 371, some days, or live gps data.
Local Clock Time/Frequency Offsets

| Percentiles...... | Ranges...... | Skew- | Kurt- | |||||||||||||
| Name | Min | 1% | 5% | 50% | 95% | 99% | Max | 90% | 98% | StdDev | Mean | Units | ness | osis | ||
| Local Clock Time Offset | -127.900 | -8.371 | -6.974 | -1.421 | 0.282 | 0.695 | 121.205 | 7.256 | 9.066 | 2.995 | -2.393 | ms | -1.206 | 202.2 | ||
| Local Clock Frequency Offset | -187.984 | 10.668 | 10.972 | 12.739 | 23.124 | 25.565 | 183.534 | 12.151 | 14.897 | 9.268 | 14.626 | ppm | -7.912 | 87.57 | ||
The time and frequency offsets between the ntpd calculated time and the local system clock. Showing frequency offset (red, in parts per million, scale on right) and the time offset (blue, in μs, scale on left). Quick changes in time offset will lead to larger frequency offsets.
These are fields 3 (time) and 4 (frequency) from the loopstats log file.
Local RMS Time Jitter

| Percentiles...... | Ranges...... | Skew- | Kurt- | |||||||||||||
| Name | Min | 1% | 5% | 50% | 95% | 99% | Max | 90% | 98% | StdDev | Mean | Units | ness | osis | ||
| Local RMS Time Jitter | 0.000 | 0.130 | 0.162 | 0.343 | 0.473 | 2.894 | 83.702 | 0.311 | 2.764 | 1.268 | 0.421 | ms | 31.78 | 1322 | ||
The RMS Jitter of the local clock offset. In other words, how fast the local clock offset is changing.
Lower is better. An ideal system would be a horizontal line at 0μs.
RMS jitter is field 5 in the loopstats log file.
Local RMS Frequency Jitter

| Percentiles...... | Ranges...... | Skew- | Kurt- | |||||||||||||
| Name | Min | 1% | 5% | 50% | 95% | 99% | Max | 90% | 98% | StdDev | Mean | Units | ness | osis | ||
| Local RMS Frequency Jitter | 0.0000 | 0.0032 | 0.0039 | 0.064 | 0.423 | 0.824 | 96.849 | 0.419 | 0.821 | 1.256 | 0.167 | ppm | 42.3 | 2231 | ||
The RMS Frequency Jitter (aka wander) of the local clock's frequency. In other words, how fast the local clock changes frequency.
Lower is better. An ideal clock would be a horizontal line at 0ppm.
RMS Frequency Jitter is field 6 in the loopstats log file.
Local Clock Time Offset Histogram

| Percentiles...... | Ranges...... | Skew- | Kurt- | |||||||||||||
| Name | Min | 1% | 5% | 50% | 95% | 99% | Max | 90% | 98% | StdDev | Mean | Units | ness | osis | ||
| Local Clock Offset | -127.900 | -8.371 | -6.974 | -1.421 | 0.282 | 0.695 | 121.205 | 7.256 | 9.066 | 2.995 | -2.393 | ms | -1.206 | 202.2 | ||
The clock offsets of the local clock as a histogram.
The Local Clock Offset is field 3 from the loopstats log file.
Local Temperatures

Local temperatures. These will be site-specific depending upon what temperature sensors you collect data from. Temperature changes affect the local clock crystal frequency and stability. The math of how temperature changes frequency is complex, and also depends on crystal aging. So there is no easy way to correct for it in software. This is the single most important component of frequency drift.
The Local Temperatures are from field 3 from the tempstats log file.
Local Frequency/Temp

| Percentiles...... | Ranges...... | Skew- | Kurt- | |||||||||||||
| Name | Min | 1% | 5% | 50% | 95% | 99% | Max | 90% | 98% | StdDev | Mean | Units | ness | osis | ||
| Local Clock Frequency Offset | -187.984 | 10.668 | 10.972 | 12.739 | 23.124 | 25.565 | 183.534 | 12.151 | 14.897 | 9.268 | 14.626 | ppm | -7.912 | 87.57 | ||
| Temp /dev/sda | 17.000 | 18.000 | 20.000 | 25.000 | 26.000 | 28.000 | 39.000 | 6.000 | 10.000 | 2.282 | 24.187 | °C | ||||
| Temp LM0 | 26.000 | 30.000 | 32.000 | 35.000 | 41.000 | 45.000 | 59.000 | 9.000 | 15.000 | 2.967 | 35.254 | °C | ||||
| Temp LM1 | 27.000 | 29.000 | 30.000 | 36.000 | 39.000 | 41.000 | 54.000 | 9.000 | 12.000 | 3.126 | 35.246 | °C | ||||
| Temp LM2 | 0.000 | 0.000 | 19.000 | 34.000 | 40.000 | 42.000 | 48.000 | 21.000 | 42.000 | 9.985 | 28.928 | °C | ||||
| Temp LM3 | 0.000 | 0.000 | 3.000 | 31.000 | 40.000 | 42.000 | 50.000 | 37.000 | 42.000 | 10.872 | 30.007 | °C | ||||
| Temp LM4 | 0.000 | 0.000 | 0.000 | 33.000 | 43.000 | 47.000 | 55.000 | 43.000 | 47.000 | 18.347 | 22.667 | °C | ||||
| Temp LM5 | 26.000 | 28.000 | 29.000 | 31.000 | 41.000 | 43.000 | 53.000 | 12.000 | 15.000 | 3.922 | 32.452 | °C | ||||
| Temp LM6 | 0.000 | 30.000 | 31.000 | 33.000 | 36.000 | 43.000 | 50.000 | 5.000 | 13.000 | 2.027 | 33.573 | °C | ||||
| Temp LM7 | 0.000 | 19.000 | 33.000 | 35.000 | 38.000 | 39.000 | 51.000 | 5.000 | 20.000 | 2.562 | 35.051 | °C | ||||
| Temp LM8 | 26.800 | 32.000 | 33.000 | 35.000 | 38.000 | 40.000 | 51.000 | 5.000 | 8.000 | 1.797 | 35.466 | °C | ||||
| Temp LM9 | 26.800 | 32.000 | 33.000 | 35.000 | 38.000 | 45.000 | 51.000 | 5.000 | 13.000 | 2.043 | 35.536 | °C | ||||
| Temp ZONE0 | 20.000 | 20.000 | 20.000 | 20.000 | 20.000 | 20.000 | 20.000 | 0.000 | 0.000 | 0.000 | 20.000 | °C | ||||
| Temp ZONE1 | 26.800 | 31.000 | 32.000 | 34.000 | 38.000 | 45.000 | 51.000 | 6.000 | 14.000 | 2.128 | 34.761 | °C | ||||
| Temp ZONE2 | 26.000 | 28.000 | 29.000 | 31.000 | 41.000 | 41.000 | 44.000 | 12.000 | 13.000 | 3.919 | 32.880 | °C | ||||
| Temp ZONE3 | 29.000 | 32.000 | 32.000 | 34.000 | 38.000 | 46.000 | 54.000 | 6.000 | 14.000 | 2.202 | 34.752 | °C | ||||
| Temp ZONE4 | 26.800 | 31.000 | 32.000 | 34.000 | 38.000 | 45.000 | 51.000 | 6.000 | 14.000 | 2.128 | 34.761 | °C | ||||
| Temp ZONE5 | 28.000 | 31.000 | 31.000 | 36.000 | 44.000 | 47.000 | 58.000 | 13.000 | 16.000 | 3.766 | 36.950 | °C | ||||
| Temp ZONE6 | 26.000 | 28.000 | 29.000 | 31.000 | 36.000 | 39.000 | 46.000 | 7.000 | 11.000 | 2.373 | 31.462 | °C | ||||
The frequency offsets and temperatures. Showing frequency offset (red, in parts per million, scale on right) and the temperatures.
These are field 4 (frequency) from the loopstats log file, and field 3 from the tempstats log file.
Local GPS

| Percentiles...... | Ranges...... | Skew- | Kurt- | |||||||||||||
| Name | Min | 1% | 5% | 50% | 95% | 99% | Max | 90% | 98% | StdDev | Mean | Units | ness | osis | ||
| nSats | 7.000 | 9.000 | 10.000 | 13.000 | 17.000 | 19.000 | 22.000 | 7.000 | 10.000 | 2.477 | 13.281 | nSat | 0.266 | 2.384 | ||
| TDOP | 0.450 | 0.510 | 0.570 | 0.800 | 11.810 | 11.810 | 11.810 | 11.240 | 11.300 | 2.763 | 1.608 | 3.348 | 12.45 | |||
Local GPS. The Time Dilution of Precision (TDOP) is plotted in blue. The number of visible satellites (nSat) is plotted in red.
TDOP is field 3, and nSats is field 4, from the gpsd log file. The gpsd log file is created by the ntploggps program.
TDOP is a dimensionless error factor. Smaller numbers are better. TDOP ranges from 1 (ideal), 2 to 5 (good), to greater than 20 (poor). Some GNSS receivers report TDOP less than one which is theoretically impossible.
Server Offsets

The offset of all refclocks and servers. This can be useful to see if offset changes are happening in a single clock or all clocks together.
Clock Offset is field 5 in the peerstats log file.
Server Offset 104.131.155.175

| Percentiles...... | Ranges...... | Skew- | Kurt- | |||||||||||||
| Name | Min | 1% | 5% | 50% | 95% | 99% | Max | 90% | 98% | StdDev | Mean | Units | ness | osis | ||
| Server Offset 104.131.155.175 | -127.900 | -126.268 | -9.978 | 1.287 | 7.510 | 13.031 | 14.937 | 17.488 | 139.299 | 23.811 | -3.782 | ms | -4.483 | 22.22 | ||
The offset of a server in seconds. This is useful to see how the measured offset is behaving.
The chart also plots offset±rtt, where rtt is the round trip time to the server. NTP can not really know the offset of a remote chimer, NTP computes it by subtracting rtt/2 from the offset. Plotting the offset±rtt reverses this calculation to more easily see the effects of rtt changes.
Closer to 0s is better. An ideal system would be a horizontal line at 0s. Typical 90% ranges may be: local LAN server 80µs; 90% ranges for WAN server may be 4ms and much larger.
Clock Offset is field 5 in the peerstats log file. The Round Trip Time (rtt) is field 6 in the peerstats log file.
Server Offset 104.152.220.5

| Percentiles...... | Ranges...... | Skew- | Kurt- | |||||||||||||
| Name | Min | 1% | 5% | 50% | 95% | 99% | Max | 90% | 98% | StdDev | Mean | Units | ness | osis | ||
| Server Offset 104.152.220.5 | 1.461 | 1.461 | 1.461 | 2.919 | 4.887 | 4.887 | 4.887 | 3.425 | 3.425 | 1.020 | 2.874 | ms | 0.6553 | 2.767 | ||
The offset of a server in seconds. This is useful to see how the measured offset is behaving.
The chart also plots offset±rtt, where rtt is the round trip time to the server. NTP can not really know the offset of a remote chimer, NTP computes it by subtracting rtt/2 from the offset. Plotting the offset±rtt reverses this calculation to more easily see the effects of rtt changes.
Closer to 0s is better. An ideal system would be a horizontal line at 0s. Typical 90% ranges may be: local LAN server 80µs; 90% ranges for WAN server may be 4ms and much larger.
Clock Offset is field 5 in the peerstats log file. The Round Trip Time (rtt) is field 6 in the peerstats log file.
Server Offset 104.232.0.123
| Percentiles...... | Ranges...... | Skew- | Kurt- | |||||||||||||
| Name | Min | 1% | 5% | 50% | 95% | 99% | Max | 90% | 98% | StdDev | Mean | Units | ness | osis | ||
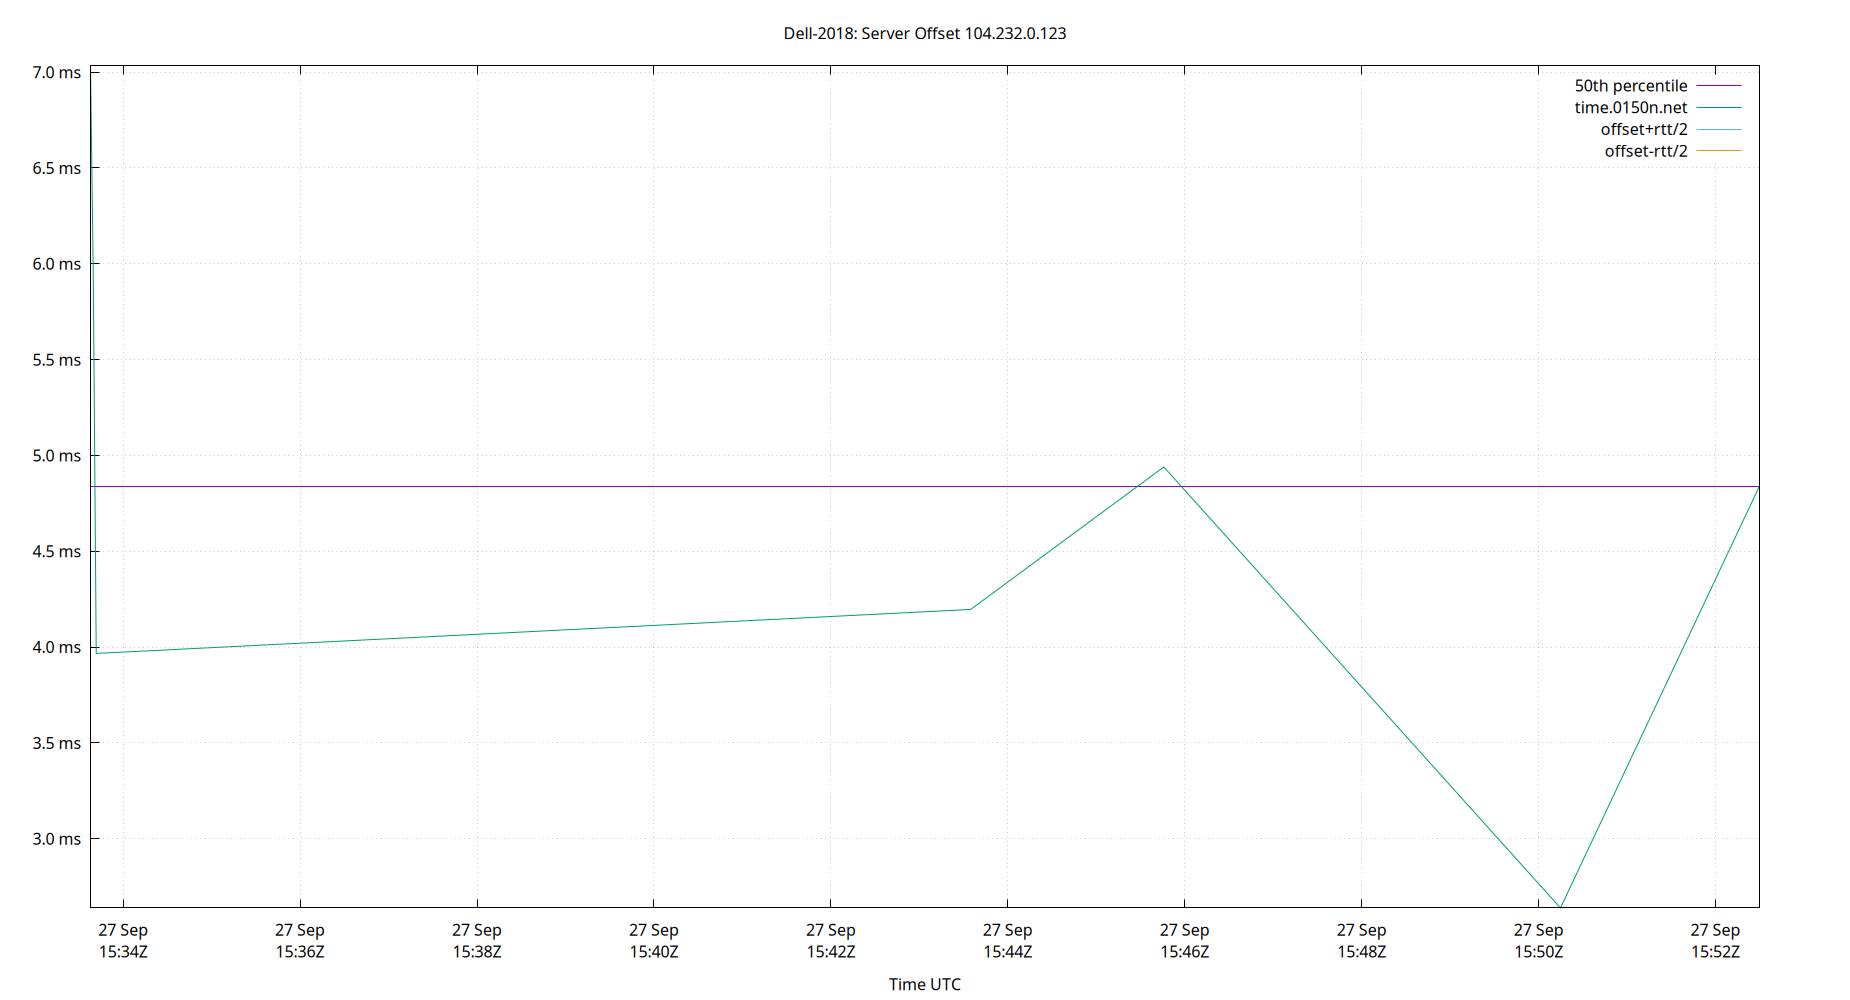
| Server Offset 104.232.0.123 | 2.639 | 2.639 | 2.639 | 4.841 | 7.033 | 7.033 | 7.033 | 4.394 | 4.394 | 1.310 | 4.792 | ms | 0.1249 | 2.376 | ||
The offset of a server in seconds. This is useful to see how the measured offset is behaving.
The chart also plots offset±rtt, where rtt is the round trip time to the server. NTP can not really know the offset of a remote chimer, NTP computes it by subtracting rtt/2 from the offset. Plotting the offset±rtt reverses this calculation to more easily see the effects of rtt changes.
Closer to 0s is better. An ideal system would be a horizontal line at 0s. Typical 90% ranges may be: local LAN server 80µs; 90% ranges for WAN server may be 4ms and much larger.
Clock Offset is field 5 in the peerstats log file. The Round Trip Time (rtt) is field 6 in the peerstats log file.
Server Offset 104.234.61.117

| Percentiles...... | Ranges...... | Skew- | Kurt- | |||||||||||||
| Name | Min | 1% | 5% | 50% | 95% | 99% | Max | 90% | 98% | StdDev | Mean | Units | ness | osis | ||
| Server Offset 104.234.61.117 | -11.180 | -9.140 | -3.447 | 1.426 | 6.606 | 12.091 | 16.244 | 10.053 | 21.231 | 3.430 | 1.519 | ms | -0.07377 | 5.449 | ||
The offset of a server in seconds. This is useful to see how the measured offset is behaving.
The chart also plots offset±rtt, where rtt is the round trip time to the server. NTP can not really know the offset of a remote chimer, NTP computes it by subtracting rtt/2 from the offset. Plotting the offset±rtt reverses this calculation to more easily see the effects of rtt changes.
Closer to 0s is better. An ideal system would be a horizontal line at 0s. Typical 90% ranges may be: local LAN server 80µs; 90% ranges for WAN server may be 4ms and much larger.
Clock Offset is field 5 in the peerstats log file. The Round Trip Time (rtt) is field 6 in the peerstats log file.
Server Offset 107.172.222.7

| Percentiles...... | Ranges...... | Skew- | Kurt- | |||||||||||||
| Name | Min | 1% | 5% | 50% | 95% | 99% | Max | 90% | 98% | StdDev | Mean | Units | ness | osis | ||
| Server Offset 107.172.222.7 | -12.642 | -11.375 | -7.178 | 1.882 | 7.310 | 12.947 | 14.359 | 14.488 | 24.322 | 3.982 | 1.625 | ms | -0.7389 | 5.565 | ||
The offset of a server in seconds. This is useful to see how the measured offset is behaving.
The chart also plots offset±rtt, where rtt is the round trip time to the server. NTP can not really know the offset of a remote chimer, NTP computes it by subtracting rtt/2 from the offset. Plotting the offset±rtt reverses this calculation to more easily see the effects of rtt changes.
Closer to 0s is better. An ideal system would be a horizontal line at 0s. Typical 90% ranges may be: local LAN server 80µs; 90% ranges for WAN server may be 4ms and much larger.
Clock Offset is field 5 in the peerstats log file. The Round Trip Time (rtt) is field 6 in the peerstats log file.
Server Offset 108.61.215.221

| Percentiles...... | Ranges...... | Skew- | Kurt- | |||||||||||||
| Name | Min | 1% | 5% | 50% | 95% | 99% | Max | 90% | 98% | StdDev | Mean | Units | ness | osis | ||
| Server Offset 108.61.215.221 | -28.570 | -9.305 | -0.181 | 3.903 | 6.523 | 8.097 | 13.175 | 6.704 | 17.402 | 2.862 | 3.479 | ms | -3.533 | 28.36 | ||
The offset of a server in seconds. This is useful to see how the measured offset is behaving.
The chart also plots offset±rtt, where rtt is the round trip time to the server. NTP can not really know the offset of a remote chimer, NTP computes it by subtracting rtt/2 from the offset. Plotting the offset±rtt reverses this calculation to more easily see the effects of rtt changes.
Closer to 0s is better. An ideal system would be a horizontal line at 0s. Typical 90% ranges may be: local LAN server 80µs; 90% ranges for WAN server may be 4ms and much larger.
Clock Offset is field 5 in the peerstats log file. The Round Trip Time (rtt) is field 6 in the peerstats log file.
Server Offset 12.205.28.193

| Percentiles...... | Ranges...... | Skew- | Kurt- | |||||||||||||
| Name | Min | 1% | 5% | 50% | 95% | 99% | Max | 90% | 98% | StdDev | Mean | Units | ness | osis | ||
| Server Offset 12.205.28.193 | -126.850 | -126.850 | -126.850 | -114.175 | 6.955 | 6.955 | 6.955 | 133.805 | 133.805 | 46.151 | -91.142 | ms | 1.065 | 2.644 | ||
The offset of a server in seconds. This is useful to see how the measured offset is behaving.
The chart also plots offset±rtt, where rtt is the round trip time to the server. NTP can not really know the offset of a remote chimer, NTP computes it by subtracting rtt/2 from the offset. Plotting the offset±rtt reverses this calculation to more easily see the effects of rtt changes.
Closer to 0s is better. An ideal system would be a horizontal line at 0s. Typical 90% ranges may be: local LAN server 80µs; 90% ranges for WAN server may be 4ms and much larger.
Clock Offset is field 5 in the peerstats log file. The Round Trip Time (rtt) is field 6 in the peerstats log file.
Server Offset 129.146.193.200

| Percentiles...... | Ranges...... | Skew- | Kurt- | |||||||||||||
| Name | Min | 1% | 5% | 50% | 95% | 99% | Max | 90% | 98% | StdDev | Mean | Units | ness | osis | ||
| Server Offset 129.146.193.200 | -0.800 | 0.856 | 1.480 | 4.796 | 6.343 | 6.706 | 7.088 | 4.863 | 5.850 | 1.421 | 4.500 | ms | -1.034 | 4.16 | ||
The offset of a server in seconds. This is useful to see how the measured offset is behaving.
The chart also plots offset±rtt, where rtt is the round trip time to the server. NTP can not really know the offset of a remote chimer, NTP computes it by subtracting rtt/2 from the offset. Plotting the offset±rtt reverses this calculation to more easily see the effects of rtt changes.
Closer to 0s is better. An ideal system would be a horizontal line at 0s. Typical 90% ranges may be: local LAN server 80µs; 90% ranges for WAN server may be 4ms and much larger.
Clock Offset is field 5 in the peerstats log file. The Round Trip Time (rtt) is field 6 in the peerstats log file.
Server Offset 129.250.35.250

| Percentiles...... | Ranges...... | Skew- | Kurt- | |||||||||||||
| Name | Min | 1% | 5% | 50% | 95% | 99% | Max | 90% | 98% | StdDev | Mean | Units | ness | osis | ||
| Server Offset 129.250.35.250 | -2.943 | -2.410 | -1.340 | 1.886 | 5.403 | 7.583 | 8.459 | 6.742 | 9.993 | 2.056 | 1.995 | ms | 0.3236 | 3.078 | ||
The offset of a server in seconds. This is useful to see how the measured offset is behaving.
The chart also plots offset±rtt, where rtt is the round trip time to the server. NTP can not really know the offset of a remote chimer, NTP computes it by subtracting rtt/2 from the offset. Plotting the offset±rtt reverses this calculation to more easily see the effects of rtt changes.
Closer to 0s is better. An ideal system would be a horizontal line at 0s. Typical 90% ranges may be: local LAN server 80µs; 90% ranges for WAN server may be 4ms and much larger.
Clock Offset is field 5 in the peerstats log file. The Round Trip Time (rtt) is field 6 in the peerstats log file.
Server Offset 131.239.5.43

| Percentiles...... | Ranges...... | Skew- | Kurt- | |||||||||||||
| Name | Min | 1% | 5% | 50% | 95% | 99% | Max | 90% | 98% | StdDev | Mean | Units | ness | osis | ||
| Server Offset 131.239.5.43 | 0.782 | 0.782 | 0.782 | 4.026 | 4.797 | 4.797 | 4.797 | 4.014 | 4.014 | 1.405 | 3.356 | ms | -1.032 | 2.322 | ||
The offset of a server in seconds. This is useful to see how the measured offset is behaving.
The chart also plots offset±rtt, where rtt is the round trip time to the server. NTP can not really know the offset of a remote chimer, NTP computes it by subtracting rtt/2 from the offset. Plotting the offset±rtt reverses this calculation to more easily see the effects of rtt changes.
Closer to 0s is better. An ideal system would be a horizontal line at 0s. Typical 90% ranges may be: local LAN server 80µs; 90% ranges for WAN server may be 4ms and much larger.
Clock Offset is field 5 in the peerstats log file. The Round Trip Time (rtt) is field 6 in the peerstats log file.
Server Offset 134.215.155.177

| Percentiles...... | Ranges...... | Skew- | Kurt- | |||||||||||||
| Name | Min | 1% | 5% | 50% | 95% | 99% | Max | 90% | 98% | StdDev | Mean | Units | ness | osis | ||
| Server Offset 134.215.155.177 | -18.453 | -8.187 | -5.143 | -0.842 | 4.221 | 10.577 | 15.538 | 9.364 | 18.764 | 3.349 | -0.714 | ms | 0.2563 | 7.75 | ||
The offset of a server in seconds. This is useful to see how the measured offset is behaving.
The chart also plots offset±rtt, where rtt is the round trip time to the server. NTP can not really know the offset of a remote chimer, NTP computes it by subtracting rtt/2 from the offset. Plotting the offset±rtt reverses this calculation to more easily see the effects of rtt changes.
Closer to 0s is better. An ideal system would be a horizontal line at 0s. Typical 90% ranges may be: local LAN server 80µs; 90% ranges for WAN server may be 4ms and much larger.
Clock Offset is field 5 in the peerstats log file. The Round Trip Time (rtt) is field 6 in the peerstats log file.
Server Offset 136.244.88.170

| Percentiles...... | Ranges...... | Skew- | Kurt- | |||||||||||||
| Name | Min | 1% | 5% | 50% | 95% | 99% | Max | 90% | 98% | StdDev | Mean | Units | ness | osis | ||
| Server Offset 136.244.88.170 | -82.929 | -69.847 | -36.233 | -1.841 | 3.940 | 8.403 | 10.603 | 40.173 | 78.249 | 14.915 | -6.598 | ms | -2.869 | 12.5 | ||
The offset of a server in seconds. This is useful to see how the measured offset is behaving.
The chart also plots offset±rtt, where rtt is the round trip time to the server. NTP can not really know the offset of a remote chimer, NTP computes it by subtracting rtt/2 from the offset. Plotting the offset±rtt reverses this calculation to more easily see the effects of rtt changes.
Closer to 0s is better. An ideal system would be a horizontal line at 0s. Typical 90% ranges may be: local LAN server 80µs; 90% ranges for WAN server may be 4ms and much larger.
Clock Offset is field 5 in the peerstats log file. The Round Trip Time (rtt) is field 6 in the peerstats log file.
Server Offset 137.190.2.4

| Percentiles...... | Ranges...... | Skew- | Kurt- | |||||||||||||
| Name | Min | 1% | 5% | 50% | 95% | 99% | Max | 90% | 98% | StdDev | Mean | Units | ness | osis | ||
| Server Offset 137.190.2.4 | -13.886 | -13.886 | -13.886 | 73.703 | 432.020 | 432.020 | 432.020 | 445.906 | 445.906 | 141.512 | 93.930 | ms | 1.772 | 4.593 | ||
The offset of a server in seconds. This is useful to see how the measured offset is behaving.
The chart also plots offset±rtt, where rtt is the round trip time to the server. NTP can not really know the offset of a remote chimer, NTP computes it by subtracting rtt/2 from the offset. Plotting the offset±rtt reverses this calculation to more easily see the effects of rtt changes.
Closer to 0s is better. An ideal system would be a horizontal line at 0s. Typical 90% ranges may be: local LAN server 80µs; 90% ranges for WAN server may be 4ms and much larger.
Clock Offset is field 5 in the peerstats log file. The Round Trip Time (rtt) is field 6 in the peerstats log file.
Server Offset 139.177.202.26

| Percentiles...... | Ranges...... | Skew- | Kurt- | |||||||||||||
| Name | Min | 1% | 5% | 50% | 95% | 99% | Max | 90% | 98% | StdDev | Mean | Units | ness | osis | ||
| Server Offset 139.177.202.26 | 2.369 | 2.369 | 2.369 | 4.015 | 6.368 | 6.368 | 6.368 | 3.999 | 3.999 | 1.383 | 4.077 | ms | 0.4653 | 1.842 | ||
The offset of a server in seconds. This is useful to see how the measured offset is behaving.
The chart also plots offset±rtt, where rtt is the round trip time to the server. NTP can not really know the offset of a remote chimer, NTP computes it by subtracting rtt/2 from the offset. Plotting the offset±rtt reverses this calculation to more easily see the effects of rtt changes.
Closer to 0s is better. An ideal system would be a horizontal line at 0s. Typical 90% ranges may be: local LAN server 80µs; 90% ranges for WAN server may be 4ms and much larger.
Clock Offset is field 5 in the peerstats log file. The Round Trip Time (rtt) is field 6 in the peerstats log file.
Server Offset 139.84.137.244

| Percentiles...... | Ranges...... | Skew- | Kurt- | |||||||||||||
| Name | Min | 1% | 5% | 50% | 95% | 99% | Max | 90% | 98% | StdDev | Mean | Units | ness | osis | ||
| Server Offset 139.84.137.244 | -88.151 | -30.357 | -5.928 | 8.689 | 18.170 | 23.381 | 33.775 | 24.098 | 53.738 | 9.137 | 7.587 | ms | -3.588 | 27.15 | ||
The offset of a server in seconds. This is useful to see how the measured offset is behaving.
The chart also plots offset±rtt, where rtt is the round trip time to the server. NTP can not really know the offset of a remote chimer, NTP computes it by subtracting rtt/2 from the offset. Plotting the offset±rtt reverses this calculation to more easily see the effects of rtt changes.
Closer to 0s is better. An ideal system would be a horizontal line at 0s. Typical 90% ranges may be: local LAN server 80µs; 90% ranges for WAN server may be 4ms and much larger.
Clock Offset is field 5 in the peerstats log file. The Round Trip Time (rtt) is field 6 in the peerstats log file.
Server Offset 139.94.144.123

| Percentiles...... | Ranges...... | Skew- | Kurt- | |||||||||||||
| Name | Min | 1% | 5% | 50% | 95% | 99% | Max | 90% | 98% | StdDev | Mean | Units | ness | osis | ||
| Server Offset 139.94.144.123 | 7.327 | 7.327 | 7.327 | 7.569 | 8.239 | 8.239 | 8.239 | 0.913 | 0.913 | 0.357 | 7.696 | ms | 0.4162 | 1.533 | ||
The offset of a server in seconds. This is useful to see how the measured offset is behaving.
The chart also plots offset±rtt, where rtt is the round trip time to the server. NTP can not really know the offset of a remote chimer, NTP computes it by subtracting rtt/2 from the offset. Plotting the offset±rtt reverses this calculation to more easily see the effects of rtt changes.
Closer to 0s is better. An ideal system would be a horizontal line at 0s. Typical 90% ranges may be: local LAN server 80µs; 90% ranges for WAN server may be 4ms and much larger.
Clock Offset is field 5 in the peerstats log file. The Round Trip Time (rtt) is field 6 in the peerstats log file.
Server Offset 141.11.89.193

| Percentiles...... | Ranges...... | Skew- | Kurt- | |||||||||||||
| Name | Min | 1% | 5% | 50% | 95% | 99% | Max | 90% | 98% | StdDev | Mean | Units | ness | osis | ||
| Server Offset 141.11.89.193 | -5.133 | -3.834 | -2.747 | 0.216 | 3.825 | 5.337 | 7.287 | 6.572 | 9.171 | 2.098 | 0.486 | ms | 0.248 | 2.697 | ||
The offset of a server in seconds. This is useful to see how the measured offset is behaving.
The chart also plots offset±rtt, where rtt is the round trip time to the server. NTP can not really know the offset of a remote chimer, NTP computes it by subtracting rtt/2 from the offset. Plotting the offset±rtt reverses this calculation to more easily see the effects of rtt changes.
Closer to 0s is better. An ideal system would be a horizontal line at 0s. Typical 90% ranges may be: local LAN server 80µs; 90% ranges for WAN server may be 4ms and much larger.
Clock Offset is field 5 in the peerstats log file. The Round Trip Time (rtt) is field 6 in the peerstats log file.
Server Offset 142.202.190.19

| Percentiles...... | Ranges...... | Skew- | Kurt- | |||||||||||||
| Name | Min | 1% | 5% | 50% | 95% | 99% | Max | 90% | 98% | StdDev | Mean | Units | ness | osis | ||
| Server Offset 142.202.190.19 | -2.514 | -2.514 | -2.514 | 0.562 | 4.040 | 4.040 | 4.040 | 6.554 | 6.554 | 1.834 | 0.714 | ms | 0.1866 | 2.03 | ||
The offset of a server in seconds. This is useful to see how the measured offset is behaving.
The chart also plots offset±rtt, where rtt is the round trip time to the server. NTP can not really know the offset of a remote chimer, NTP computes it by subtracting rtt/2 from the offset. Plotting the offset±rtt reverses this calculation to more easily see the effects of rtt changes.
Closer to 0s is better. An ideal system would be a horizontal line at 0s. Typical 90% ranges may be: local LAN server 80µs; 90% ranges for WAN server may be 4ms and much larger.
Clock Offset is field 5 in the peerstats log file. The Round Trip Time (rtt) is field 6 in the peerstats log file.
Server Offset 142.248.80.92
| Percentiles...... | Ranges...... | Skew- | Kurt- | |||||||||||||
| Name | Min | 1% | 5% | 50% | 95% | 99% | Max | 90% | 98% | StdDev | Mean | Units | ness | osis | ||
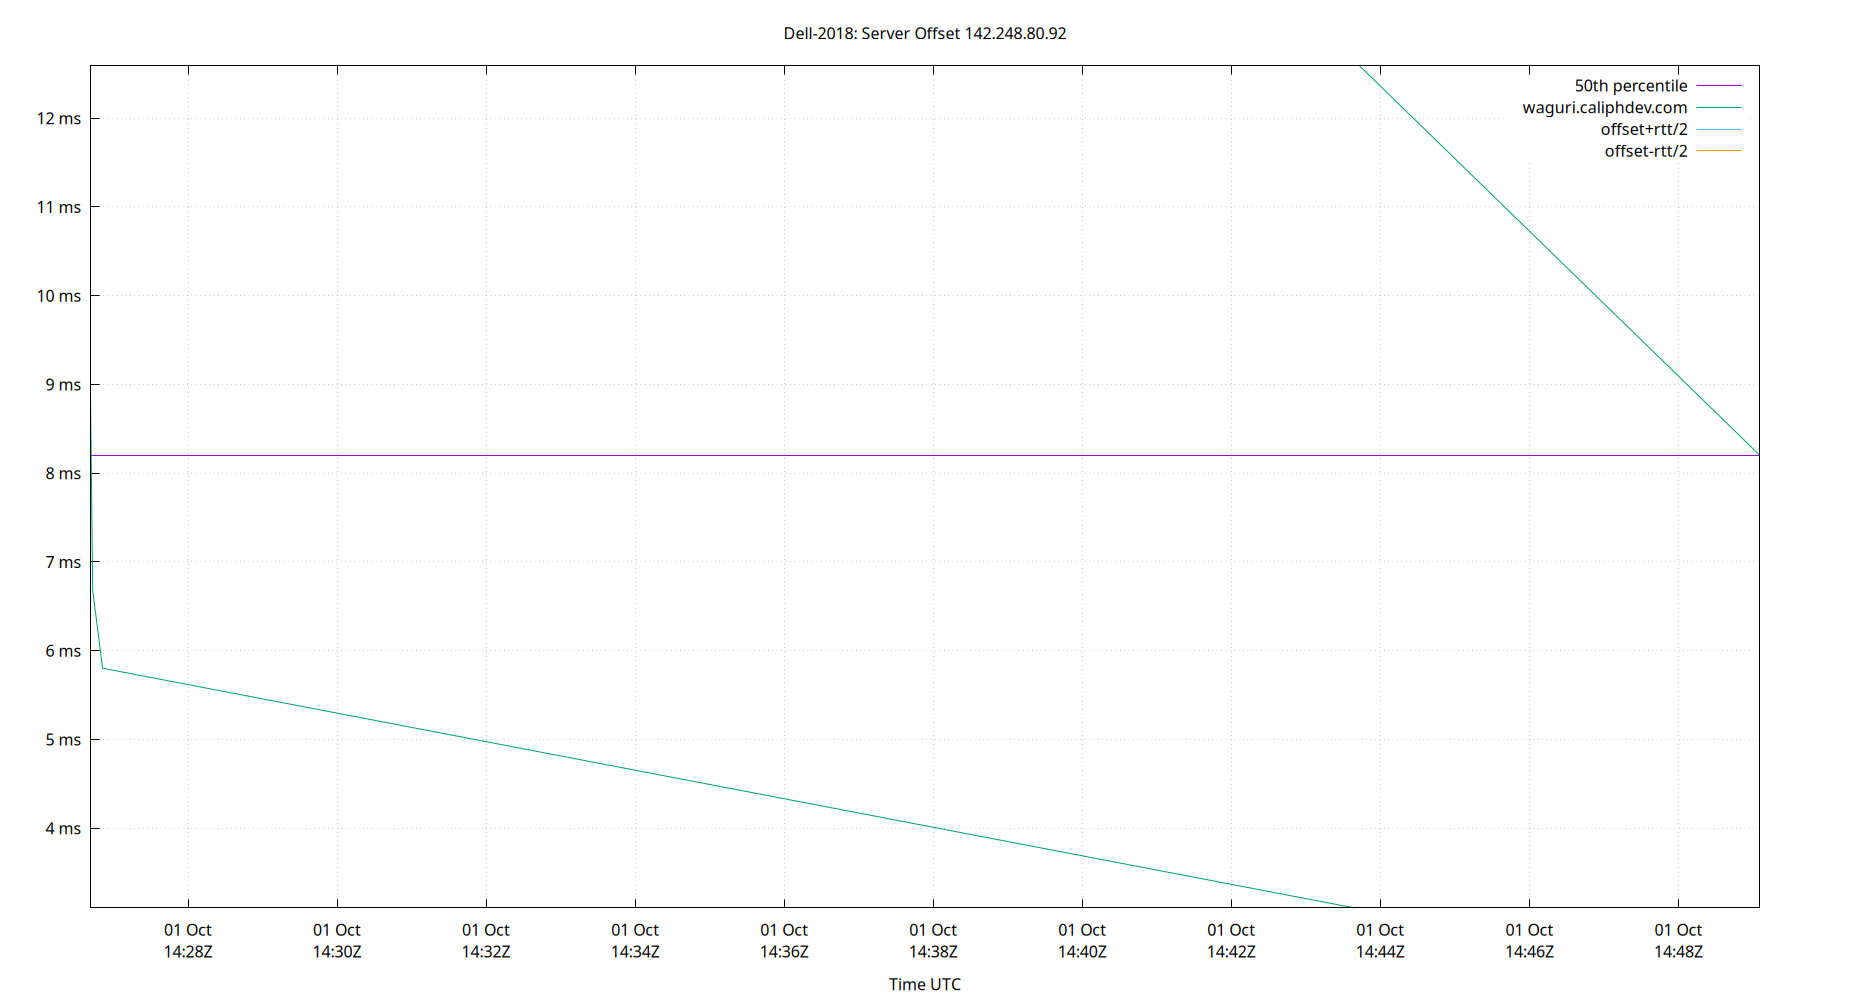
| Server Offset 142.248.80.92 | 3.101 | 3.101 | 3.101 | 8.205 | 12.589 | 12.589 | 12.589 | 9.488 | 9.488 | 2.921 | 7.543 | ms | 0.2515 | 2.405 | ||
The offset of a server in seconds. This is useful to see how the measured offset is behaving.
The chart also plots offset±rtt, where rtt is the round trip time to the server. NTP can not really know the offset of a remote chimer, NTP computes it by subtracting rtt/2 from the offset. Plotting the offset±rtt reverses this calculation to more easily see the effects of rtt changes.
Closer to 0s is better. An ideal system would be a horizontal line at 0s. Typical 90% ranges may be: local LAN server 80µs; 90% ranges for WAN server may be 4ms and much larger.
Clock Offset is field 5 in the peerstats log file. The Round Trip Time (rtt) is field 6 in the peerstats log file.
Server Offset 143.42.229.154

| Percentiles...... | Ranges...... | Skew- | Kurt- | |||||||||||||
| Name | Min | 1% | 5% | 50% | 95% | 99% | Max | 90% | 98% | StdDev | Mean | Units | ness | osis | ||
| Server Offset 143.42.229.154 | -24.531 | -9.314 | -5.526 | 0.643 | 5.859 | 8.889 | 16.272 | 11.384 | 18.203 | 3.684 | 0.419 | ms | -0.6014 | 8.176 | ||
The offset of a server in seconds. This is useful to see how the measured offset is behaving.
The chart also plots offset±rtt, where rtt is the round trip time to the server. NTP can not really know the offset of a remote chimer, NTP computes it by subtracting rtt/2 from the offset. Plotting the offset±rtt reverses this calculation to more easily see the effects of rtt changes.
Closer to 0s is better. An ideal system would be a horizontal line at 0s. Typical 90% ranges may be: local LAN server 80µs; 90% ranges for WAN server may be 4ms and much larger.
Clock Offset is field 5 in the peerstats log file. The Round Trip Time (rtt) is field 6 in the peerstats log file.
Server Offset 144.202.0.197

| Percentiles...... | Ranges...... | Skew- | Kurt- | |||||||||||||
| Name | Min | 1% | 5% | 50% | 95% | 99% | Max | 90% | 98% | StdDev | Mean | Units | ness | osis | ||
| Server Offset 144.202.0.197 | -112.597 | -110.963 | -2.839 | 1.509 | 4.185 | 5.020 | 7.488 | 7.024 | 115.983 | 13.445 | -0.323 | ms | -7.986 | 66.41 | ||
The offset of a server in seconds. This is useful to see how the measured offset is behaving.
The chart also plots offset±rtt, where rtt is the round trip time to the server. NTP can not really know the offset of a remote chimer, NTP computes it by subtracting rtt/2 from the offset. Plotting the offset±rtt reverses this calculation to more easily see the effects of rtt changes.
Closer to 0s is better. An ideal system would be a horizontal line at 0s. Typical 90% ranges may be: local LAN server 80µs; 90% ranges for WAN server may be 4ms and much larger.
Clock Offset is field 5 in the peerstats log file. The Round Trip Time (rtt) is field 6 in the peerstats log file.
Server Offset 144.202.41.38

| Percentiles...... | Ranges...... | Skew- | Kurt- | |||||||||||||
| Name | Min | 1% | 5% | 50% | 95% | 99% | Max | 90% | 98% | StdDev | Mean | Units | ness | osis | ||
| Server Offset 144.202.41.38 | -8.294 | -8.294 | -8.294 | 10.653 | 20.588 | 20.588 | 20.588 | 28.882 | 28.882 | 6.808 | 8.785 | ms | -0.8454 | 3.947 | ||
The offset of a server in seconds. This is useful to see how the measured offset is behaving.
The chart also plots offset±rtt, where rtt is the round trip time to the server. NTP can not really know the offset of a remote chimer, NTP computes it by subtracting rtt/2 from the offset. Plotting the offset±rtt reverses this calculation to more easily see the effects of rtt changes.
Closer to 0s is better. An ideal system would be a horizontal line at 0s. Typical 90% ranges may be: local LAN server 80µs; 90% ranges for WAN server may be 4ms and much larger.
Clock Offset is field 5 in the peerstats log file. The Round Trip Time (rtt) is field 6 in the peerstats log file.
Server Offset 144.202.62.209

| Percentiles...... | Ranges...... | Skew- | Kurt- | |||||||||||||
| Name | Min | 1% | 5% | 50% | 95% | 99% | Max | 90% | 98% | StdDev | Mean | Units | ness | osis | ||
| Server Offset 144.202.62.209 | -359.531 | -4.209 | -1.517 | 1.251 | 5.257 | 7.227 | 36.327 | 6.774 | 11.436 | 27.588 | -0.646 | ms | -11.94 | 150 | ||
The offset of a server in seconds. This is useful to see how the measured offset is behaving.
The chart also plots offset±rtt, where rtt is the round trip time to the server. NTP can not really know the offset of a remote chimer, NTP computes it by subtracting rtt/2 from the offset. Plotting the offset±rtt reverses this calculation to more easily see the effects of rtt changes.
Closer to 0s is better. An ideal system would be a horizontal line at 0s. Typical 90% ranges may be: local LAN server 80µs; 90% ranges for WAN server may be 4ms and much larger.
Clock Offset is field 5 in the peerstats log file. The Round Trip Time (rtt) is field 6 in the peerstats log file.
Server Offset 144.202.66.214

| Percentiles...... | Ranges...... | Skew- | Kurt- | |||||||||||||
| Name | Min | 1% | 5% | 50% | 95% | 99% | Max | 90% | 98% | StdDev | Mean | Units | ness | osis | ||
| Server Offset 144.202.66.214 | -1,991.190 | -5.972 | 2.629 | 9.116 | 12.650 | 26.232 | 405.866 | 10.021 | 32.203 | 139.131 | -0.132 | ms | -13.95 | 200 | ||
The offset of a server in seconds. This is useful to see how the measured offset is behaving.
The chart also plots offset±rtt, where rtt is the round trip time to the server. NTP can not really know the offset of a remote chimer, NTP computes it by subtracting rtt/2 from the offset. Plotting the offset±rtt reverses this calculation to more easily see the effects of rtt changes.
Closer to 0s is better. An ideal system would be a horizontal line at 0s. Typical 90% ranges may be: local LAN server 80µs; 90% ranges for WAN server may be 4ms and much larger.
Clock Offset is field 5 in the peerstats log file. The Round Trip Time (rtt) is field 6 in the peerstats log file.
Server Offset 144.31.251.154

| Percentiles...... | Ranges...... | Skew- | Kurt- | |||||||||||||
| Name | Min | 1% | 5% | 50% | 95% | 99% | Max | 90% | 98% | StdDev | Mean | Units | ness | osis | ||
| Server Offset 144.31.251.154 | -1.884 | -1.884 | -1.884 | 1.637 | 9.630 | 9.630 | 9.630 | 11.515 | 11.515 | 4.100 | 3.810 | ms | 0.1811 | 1.537 | ||
The offset of a server in seconds. This is useful to see how the measured offset is behaving.
The chart also plots offset±rtt, where rtt is the round trip time to the server. NTP can not really know the offset of a remote chimer, NTP computes it by subtracting rtt/2 from the offset. Plotting the offset±rtt reverses this calculation to more easily see the effects of rtt changes.
Closer to 0s is better. An ideal system would be a horizontal line at 0s. Typical 90% ranges may be: local LAN server 80µs; 90% ranges for WAN server may be 4ms and much larger.
Clock Offset is field 5 in the peerstats log file. The Round Trip Time (rtt) is field 6 in the peerstats log file.
Server Offset 144.76.66.157
| Percentiles...... | Ranges...... | Skew- | Kurt- | |||||||||||||
| Name | Min | 1% | 5% | 50% | 95% | 99% | Max | 90% | 98% | StdDev | Mean | Units | ness | osis | ||
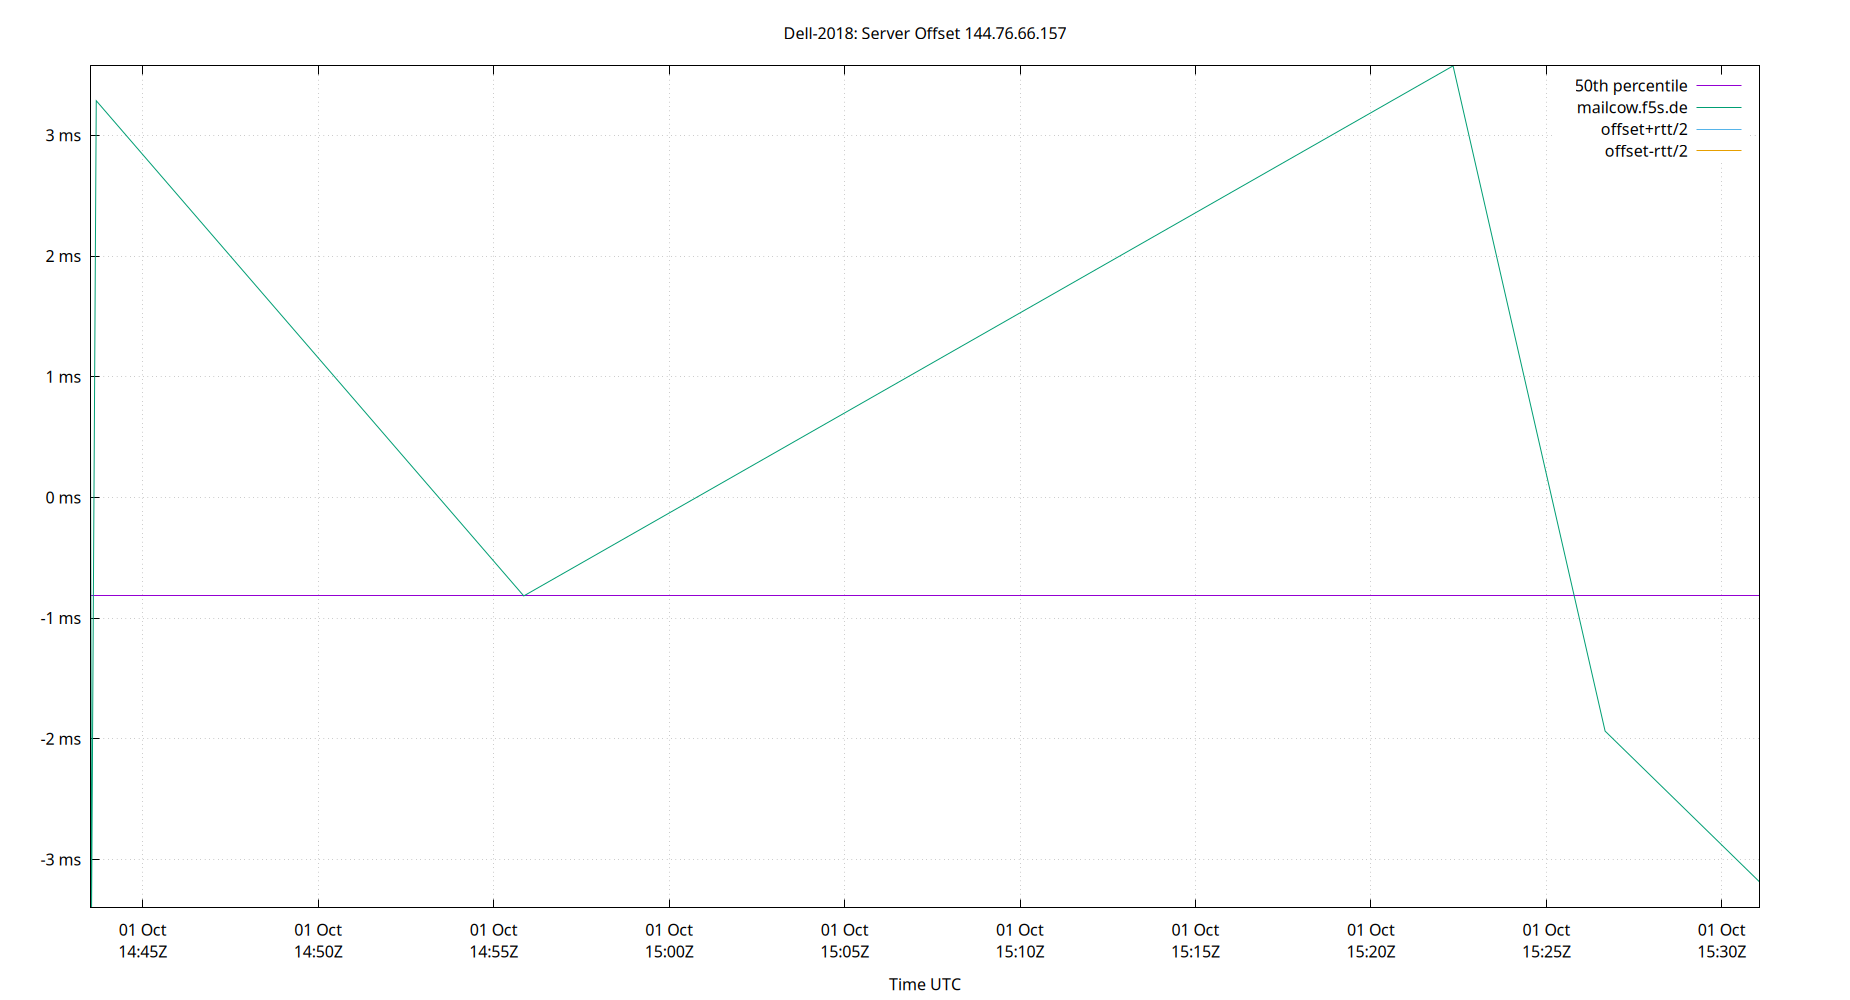
| Server Offset 144.76.66.157 | -3.402 | -3.402 | -3.402 | -0.816 | 3.576 | 3.576 | 3.576 | 6.977 | 6.977 | 2.655 | -0.287 | ms | 0.3401 | 1.604 | ||
The offset of a server in seconds. This is useful to see how the measured offset is behaving.
The chart also plots offset±rtt, where rtt is the round trip time to the server. NTP can not really know the offset of a remote chimer, NTP computes it by subtracting rtt/2 from the offset. Plotting the offset±rtt reverses this calculation to more easily see the effects of rtt changes.
Closer to 0s is better. An ideal system would be a horizontal line at 0s. Typical 90% ranges may be: local LAN server 80µs; 90% ranges for WAN server may be 4ms and much larger.
Clock Offset is field 5 in the peerstats log file. The Round Trip Time (rtt) is field 6 in the peerstats log file.
Server Offset 147.88.195.53

| Percentiles...... | Ranges...... | Skew- | Kurt- | |||||||||||||
| Name | Min | 1% | 5% | 50% | 95% | 99% | Max | 90% | 98% | StdDev | Mean | Units | ness | osis | ||
| Server Offset 147.88.195.53 | -119.005 | -102.607 | -72.223 | -5.953 | 6.214 | 10.280 | 13.559 | 78.438 | 112.887 | 24.442 | -16.854 | ms | -1.622 | 5.339 | ||
The offset of a server in seconds. This is useful to see how the measured offset is behaving.
The chart also plots offset±rtt, where rtt is the round trip time to the server. NTP can not really know the offset of a remote chimer, NTP computes it by subtracting rtt/2 from the offset. Plotting the offset±rtt reverses this calculation to more easily see the effects of rtt changes.
Closer to 0s is better. An ideal system would be a horizontal line at 0s. Typical 90% ranges may be: local LAN server 80µs; 90% ranges for WAN server may be 4ms and much larger.
Clock Offset is field 5 in the peerstats log file. The Round Trip Time (rtt) is field 6 in the peerstats log file.
Server Offset 148.163.226.148

| Percentiles...... | Ranges...... | Skew- | Kurt- | |||||||||||||
| Name | Min | 1% | 5% | 50% | 95% | 99% | Max | 90% | 98% | StdDev | Mean | Units | ness | osis | ||
| Server Offset 148.163.226.148 | -76.672 | -76.672 | -76.672 | 2.891 | 6.433 | 6.433 | 6.433 | 83.105 | 83.105 | 25.184 | -5.515 | ms | -2.465 | 7.097 | ||
The offset of a server in seconds. This is useful to see how the measured offset is behaving.
The chart also plots offset±rtt, where rtt is the round trip time to the server. NTP can not really know the offset of a remote chimer, NTP computes it by subtracting rtt/2 from the offset. Plotting the offset±rtt reverses this calculation to more easily see the effects of rtt changes.
Closer to 0s is better. An ideal system would be a horizontal line at 0s. Typical 90% ranges may be: local LAN server 80µs; 90% ranges for WAN server may be 4ms and much larger.
Clock Offset is field 5 in the peerstats log file. The Round Trip Time (rtt) is field 6 in the peerstats log file.
Server Offset 149.248.12.167

| Percentiles...... | Ranges...... | Skew- | Kurt- | |||||||||||||
| Name | Min | 1% | 5% | 50% | 95% | 99% | Max | 90% | 98% | StdDev | Mean | Units | ness | osis | ||
| Server Offset 149.248.12.167 | -8.248 | -8.248 | -5.145 | 3.379 | 12.833 | 13.486 | 13.486 | 17.978 | 21.734 | 4.968 | 2.979 | ms | 0.2457 | 2.932 | ||
The offset of a server in seconds. This is useful to see how the measured offset is behaving.
The chart also plots offset±rtt, where rtt is the round trip time to the server. NTP can not really know the offset of a remote chimer, NTP computes it by subtracting rtt/2 from the offset. Plotting the offset±rtt reverses this calculation to more easily see the effects of rtt changes.
Closer to 0s is better. An ideal system would be a horizontal line at 0s. Typical 90% ranges may be: local LAN server 80µs; 90% ranges for WAN server may be 4ms and much larger.
Clock Offset is field 5 in the peerstats log file. The Round Trip Time (rtt) is field 6 in the peerstats log file.
Server Offset 149.28.200.179

| Percentiles...... | Ranges...... | Skew- | Kurt- | |||||||||||||
| Name | Min | 1% | 5% | 50% | 95% | 99% | Max | 90% | 98% | StdDev | Mean | Units | ness | osis | ||
| Server Offset 149.28.200.179 | -88.226 | -86.256 | -9.082 | 0.875 | 6.594 | 11.091 | 14.392 | 15.676 | 97.347 | 9.995 | -0.363 | ms | -7.077 | 60.97 | ||
The offset of a server in seconds. This is useful to see how the measured offset is behaving.
The chart also plots offset±rtt, where rtt is the round trip time to the server. NTP can not really know the offset of a remote chimer, NTP computes it by subtracting rtt/2 from the offset. Plotting the offset±rtt reverses this calculation to more easily see the effects of rtt changes.
Closer to 0s is better. An ideal system would be a horizontal line at 0s. Typical 90% ranges may be: local LAN server 80µs; 90% ranges for WAN server may be 4ms and much larger.
Clock Offset is field 5 in the peerstats log file. The Round Trip Time (rtt) is field 6 in the peerstats log file.
Server Offset 149.28.61.105

| Percentiles...... | Ranges...... | Skew- | Kurt- | |||||||||||||
| Name | Min | 1% | 5% | 50% | 95% | 99% | Max | 90% | 98% | StdDev | Mean | Units | ness | osis | ||
| Server Offset 149.28.61.105 | -1,995.498 | -17.899 | -3.536 | 3.526 | 6.244 | 11.798 | 44.622 | 9.780 | 29.697 | 146.291 | -7.946 | ms | -13.48 | 182.9 | ||
The offset of a server in seconds. This is useful to see how the measured offset is behaving.
The chart also plots offset±rtt, where rtt is the round trip time to the server. NTP can not really know the offset of a remote chimer, NTP computes it by subtracting rtt/2 from the offset. Plotting the offset±rtt reverses this calculation to more easily see the effects of rtt changes.
Closer to 0s is better. An ideal system would be a horizontal line at 0s. Typical 90% ranges may be: local LAN server 80µs; 90% ranges for WAN server may be 4ms and much larger.
Clock Offset is field 5 in the peerstats log file. The Round Trip Time (rtt) is field 6 in the peerstats log file.
Server Offset 151.236.20.166

| Percentiles...... | Ranges...... | Skew- | Kurt- | |||||||||||||
| Name | Min | 1% | 5% | 50% | 95% | 99% | Max | 90% | 98% | StdDev | Mean | Units | ness | osis | ||
| Server Offset 151.236.20.166 | -7.947 | -5.621 | -3.416 | 0.364 | 5.984 | 9.517 | 13.621 | 9.399 | 15.138 | 3.092 | 0.765 | ms | 0.5972 | 3.916 | ||
The offset of a server in seconds. This is useful to see how the measured offset is behaving.
The chart also plots offset±rtt, where rtt is the round trip time to the server. NTP can not really know the offset of a remote chimer, NTP computes it by subtracting rtt/2 from the offset. Plotting the offset±rtt reverses this calculation to more easily see the effects of rtt changes.
Closer to 0s is better. An ideal system would be a horizontal line at 0s. Typical 90% ranges may be: local LAN server 80µs; 90% ranges for WAN server may be 4ms and much larger.
Clock Offset is field 5 in the peerstats log file. The Round Trip Time (rtt) is field 6 in the peerstats log file.
Server Offset 155.248.196.28

| Percentiles...... | Ranges...... | Skew- | Kurt- | |||||||||||||
| Name | Min | 1% | 5% | 50% | 95% | 99% | Max | 90% | 98% | StdDev | Mean | Units | ness | osis | ||
| Server Offset 155.248.196.28 | -7.263 | -4.833 | -2.774 | 0.162 | 4.381 | 7.586 | 11.821 | 7.155 | 12.418 | 2.274 | 0.520 | ms | 0.7526 | 4.999 | ||
The offset of a server in seconds. This is useful to see how the measured offset is behaving.
The chart also plots offset±rtt, where rtt is the round trip time to the server. NTP can not really know the offset of a remote chimer, NTP computes it by subtracting rtt/2 from the offset. Plotting the offset±rtt reverses this calculation to more easily see the effects of rtt changes.
Closer to 0s is better. An ideal system would be a horizontal line at 0s. Typical 90% ranges may be: local LAN server 80µs; 90% ranges for WAN server may be 4ms and much larger.
Clock Offset is field 5 in the peerstats log file. The Round Trip Time (rtt) is field 6 in the peerstats log file.
Server Offset 157.245.125.229

| Percentiles...... | Ranges...... | Skew- | Kurt- | |||||||||||||
| Name | Min | 1% | 5% | 50% | 95% | 99% | Max | 90% | 98% | StdDev | Mean | Units | ness | osis | ||
| Server Offset 157.245.125.229 | -11.025 | -0.605 | 1.272 | 5.230 | 7.446 | 8.834 | 14.151 | 6.173 | 9.439 | 2.038 | 4.890 | ms | -0.9644 | 8.059 | ||
The offset of a server in seconds. This is useful to see how the measured offset is behaving.
The chart also plots offset±rtt, where rtt is the round trip time to the server. NTP can not really know the offset of a remote chimer, NTP computes it by subtracting rtt/2 from the offset. Plotting the offset±rtt reverses this calculation to more easily see the effects of rtt changes.
Closer to 0s is better. An ideal system would be a horizontal line at 0s. Typical 90% ranges may be: local LAN server 80µs; 90% ranges for WAN server may be 4ms and much larger.
Clock Offset is field 5 in the peerstats log file. The Round Trip Time (rtt) is field 6 in the peerstats log file.
Server Offset 158.51.99.19

| Percentiles...... | Ranges...... | Skew- | Kurt- | |||||||||||||
| Name | Min | 1% | 5% | 50% | 95% | 99% | Max | 90% | 98% | StdDev | Mean | Units | ness | osis | ||
| Server Offset 158.51.99.19 | -157.868 | -3.938 | -0.237 | 3.374 | 5.765 | 9.486 | 24.445 | 6.002 | 13.424 | 10.501 | 2.610 | ms | -13.72 | 206.1 | ||
The offset of a server in seconds. This is useful to see how the measured offset is behaving.
The chart also plots offset±rtt, where rtt is the round trip time to the server. NTP can not really know the offset of a remote chimer, NTP computes it by subtracting rtt/2 from the offset. Plotting the offset±rtt reverses this calculation to more easily see the effects of rtt changes.
Closer to 0s is better. An ideal system would be a horizontal line at 0s. Typical 90% ranges may be: local LAN server 80µs; 90% ranges for WAN server may be 4ms and much larger.
Clock Offset is field 5 in the peerstats log file. The Round Trip Time (rtt) is field 6 in the peerstats log file.
Server Offset 159.203.158.197
| Percentiles...... | Ranges...... | Skew- | Kurt- | |||||||||||||
| Name | Min | 1% | 5% | 50% | 95% | 99% | Max | 90% | 98% | StdDev | Mean | Units | ness | osis | ||
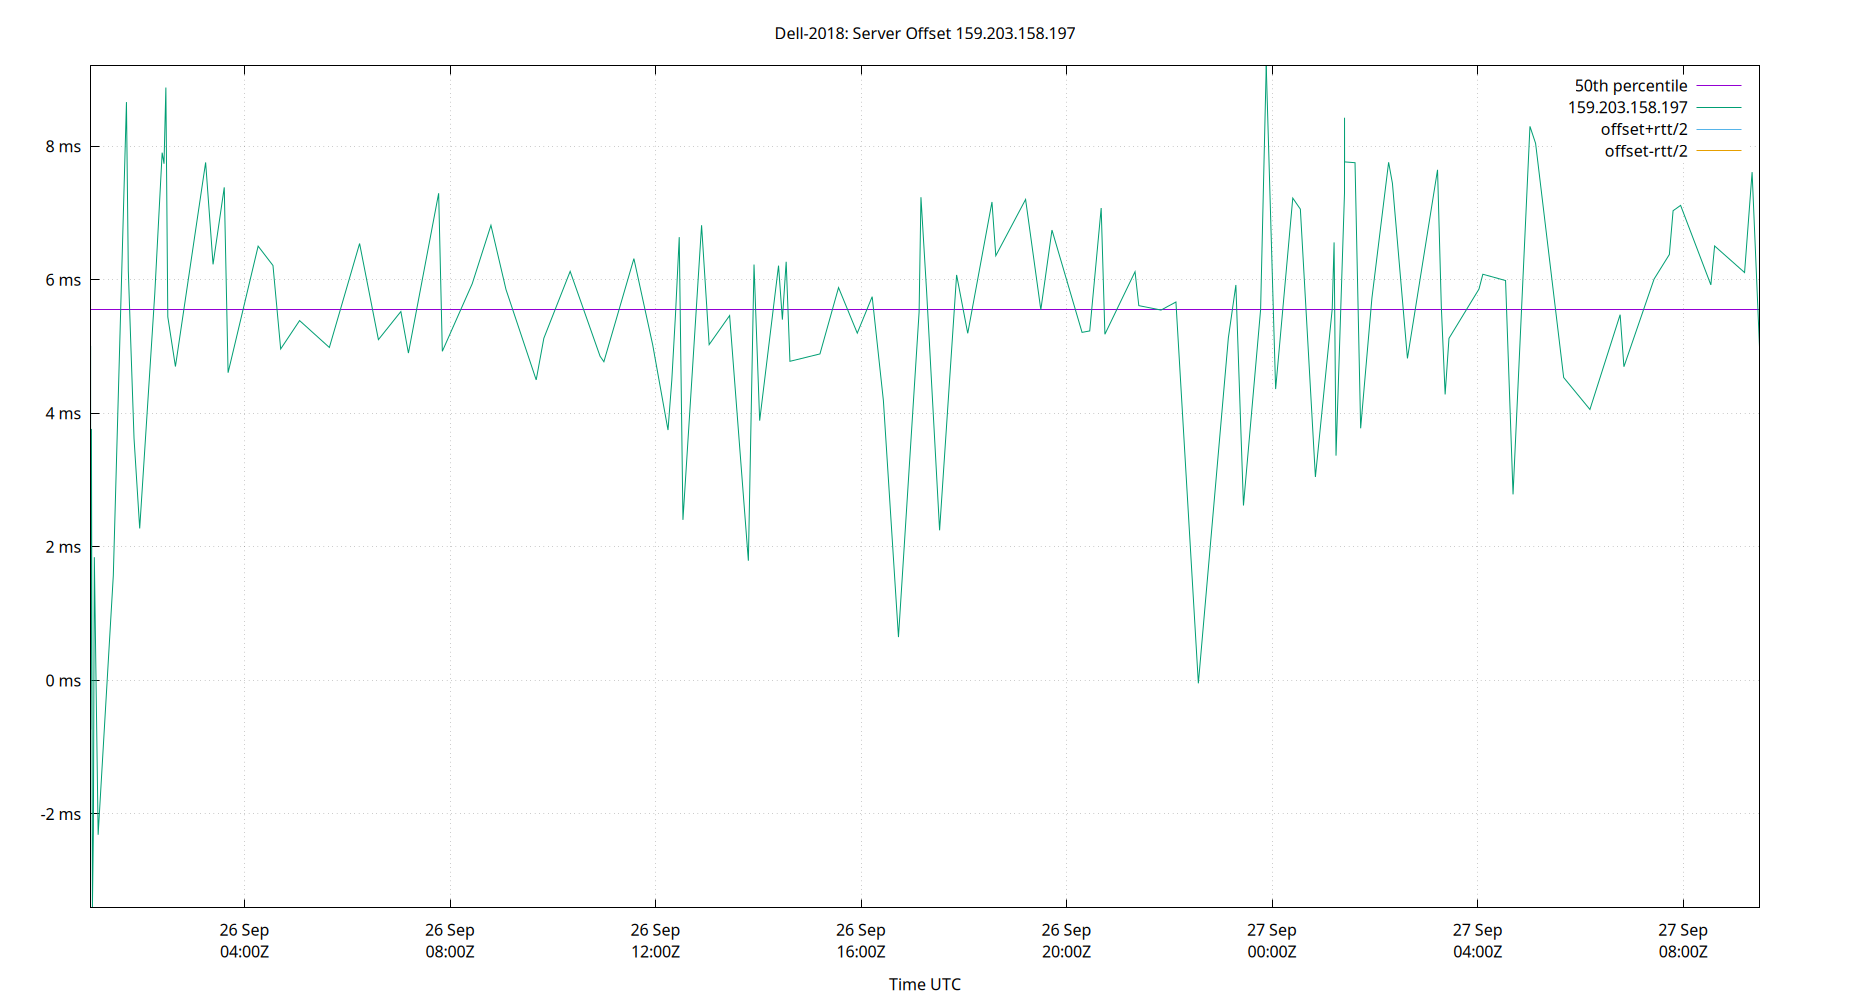
| Server Offset 159.203.158.197 | -3.409 | -2.313 | 0.649 | 5.552 | 7.905 | 8.880 | 9.205 | 7.257 | 11.193 | 2.163 | 5.248 | ms | -1.443 | 6.054 | ||
The offset of a server in seconds. This is useful to see how the measured offset is behaving.
The chart also plots offset±rtt, where rtt is the round trip time to the server. NTP can not really know the offset of a remote chimer, NTP computes it by subtracting rtt/2 from the offset. Plotting the offset±rtt reverses this calculation to more easily see the effects of rtt changes.
Closer to 0s is better. An ideal system would be a horizontal line at 0s. Typical 90% ranges may be: local LAN server 80µs; 90% ranges for WAN server may be 4ms and much larger.
Clock Offset is field 5 in the peerstats log file. The Round Trip Time (rtt) is field 6 in the peerstats log file.
Server Offset 161.35.230.200

| Percentiles...... | Ranges...... | Skew- | Kurt- | |||||||||||||
| Name | Min | 1% | 5% | 50% | 95% | 99% | Max | 90% | 98% | StdDev | Mean | Units | ness | osis | ||
| Server Offset 161.35.230.200 | -2.730 | -2.730 | -1.127 | 1.511 | 390.595 | 395.667 | 395.667 | 391.722 | 398.397 | 147.881 | 68.930 | ms | 1.72 | 3.961 | ||
The offset of a server in seconds. This is useful to see how the measured offset is behaving.
The chart also plots offset±rtt, where rtt is the round trip time to the server. NTP can not really know the offset of a remote chimer, NTP computes it by subtracting rtt/2 from the offset. Plotting the offset±rtt reverses this calculation to more easily see the effects of rtt changes.
Closer to 0s is better. An ideal system would be a horizontal line at 0s. Typical 90% ranges may be: local LAN server 80µs; 90% ranges for WAN server may be 4ms and much larger.
Clock Offset is field 5 in the peerstats log file. The Round Trip Time (rtt) is field 6 in the peerstats log file.
Server Offset 162.159.200.1

| Percentiles...... | Ranges...... | Skew- | Kurt- | |||||||||||||
| Name | Min | 1% | 5% | 50% | 95% | 99% | Max | 90% | 98% | StdDev | Mean | Units | ness | osis | ||
| Server Offset 162.159.200.1 | -33.205 | -2.721 | -0.176 | 4.894 | 7.533 | 9.550 | 392.310 | 7.709 | 12.272 | 14.429 | 4.965 | ms | 25.84 | 690.8 | ||
The offset of a server in seconds. This is useful to see how the measured offset is behaving.
The chart also plots offset±rtt, where rtt is the round trip time to the server. NTP can not really know the offset of a remote chimer, NTP computes it by subtracting rtt/2 from the offset. Plotting the offset±rtt reverses this calculation to more easily see the effects of rtt changes.
Closer to 0s is better. An ideal system would be a horizontal line at 0s. Typical 90% ranges may be: local LAN server 80µs; 90% ranges for WAN server may be 4ms and much larger.
Clock Offset is field 5 in the peerstats log file. The Round Trip Time (rtt) is field 6 in the peerstats log file.
Server Offset 162.159.200.123

| Percentiles...... | Ranges...... | Skew- | Kurt- | |||||||||||||
| Name | Min | 1% | 5% | 50% | 95% | 99% | Max | 90% | 98% | StdDev | Mean | Units | ness | osis | ||
| Server Offset 162.159.200.123 | -1,990.740 | -3.157 | 0.042 | 5.862 | 8.977 | 11.927 | 41.636 | 8.935 | 15.084 | 40.692 | 4.710 | ms | -48.73 | 2389 | ||
The offset of a server in seconds. This is useful to see how the measured offset is behaving.
The chart also plots offset±rtt, where rtt is the round trip time to the server. NTP can not really know the offset of a remote chimer, NTP computes it by subtracting rtt/2 from the offset. Plotting the offset±rtt reverses this calculation to more easily see the effects of rtt changes.
Closer to 0s is better. An ideal system would be a horizontal line at 0s. Typical 90% ranges may be: local LAN server 80µs; 90% ranges for WAN server may be 4ms and much larger.
Clock Offset is field 5 in the peerstats log file. The Round Trip Time (rtt) is field 6 in the peerstats log file.
Server Offset 162.244.81.139

| Percentiles...... | Ranges...... | Skew- | Kurt- | |||||||||||||
| Name | Min | 1% | 5% | 50% | 95% | 99% | Max | 90% | 98% | StdDev | Mean | Units | ness | osis | ||
| Server Offset 162.244.81.139 | -358.787 | -176.780 | -2.089 | 2.650 | 5.489 | 8.702 | 11.561 | 7.578 | 185.481 | 34.896 | -1.383 | ms | -9.428 | 92.93 | ||
The offset of a server in seconds. This is useful to see how the measured offset is behaving.
The chart also plots offset±rtt, where rtt is the round trip time to the server. NTP can not really know the offset of a remote chimer, NTP computes it by subtracting rtt/2 from the offset. Plotting the offset±rtt reverses this calculation to more easily see the effects of rtt changes.
Closer to 0s is better. An ideal system would be a horizontal line at 0s. Typical 90% ranges may be: local LAN server 80µs; 90% ranges for WAN server may be 4ms and much larger.
Clock Offset is field 5 in the peerstats log file. The Round Trip Time (rtt) is field 6 in the peerstats log file.
Server Offset 162.254.225.151
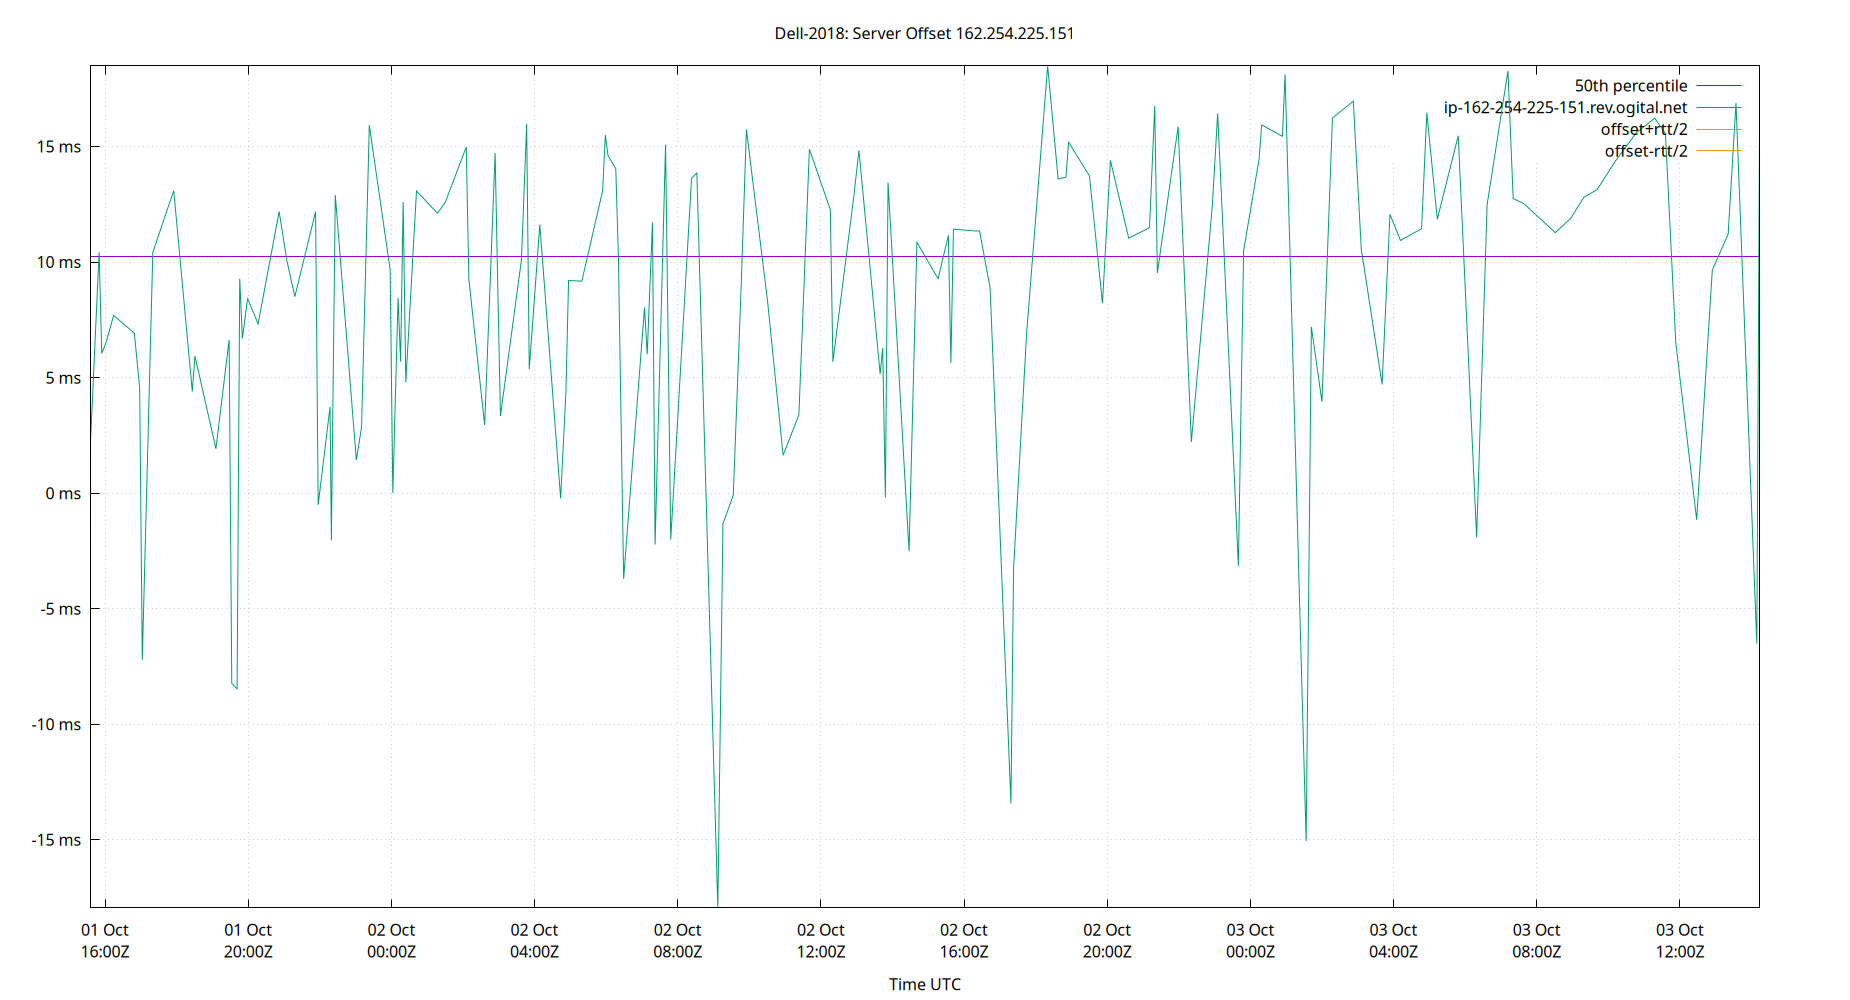
| Percentiles...... | Ranges...... | Skew- | Kurt- | |||||||||||||
| Name | Min | 1% | 5% | 50% | 95% | 99% | Max | 90% | 98% | StdDev | Mean | Units | ness | osis | ||
| Server Offset 162.254.225.151 | -17.956 | -15.060 | -5.708 | 10.223 | 16.437 | 18.274 | 18.494 | 22.145 | 33.334 | 6.977 | 8.368 | ms | -1.195 | 4.441 | ||
The offset of a server in seconds. This is useful to see how the measured offset is behaving.
The chart also plots offset±rtt, where rtt is the round trip time to the server. NTP can not really know the offset of a remote chimer, NTP computes it by subtracting rtt/2 from the offset. Plotting the offset±rtt reverses this calculation to more easily see the effects of rtt changes.
Closer to 0s is better. An ideal system would be a horizontal line at 0s. Typical 90% ranges may be: local LAN server 80µs; 90% ranges for WAN server may be 4ms and much larger.
Clock Offset is field 5 in the peerstats log file. The Round Trip Time (rtt) is field 6 in the peerstats log file.
Server Offset 162.254.225.152
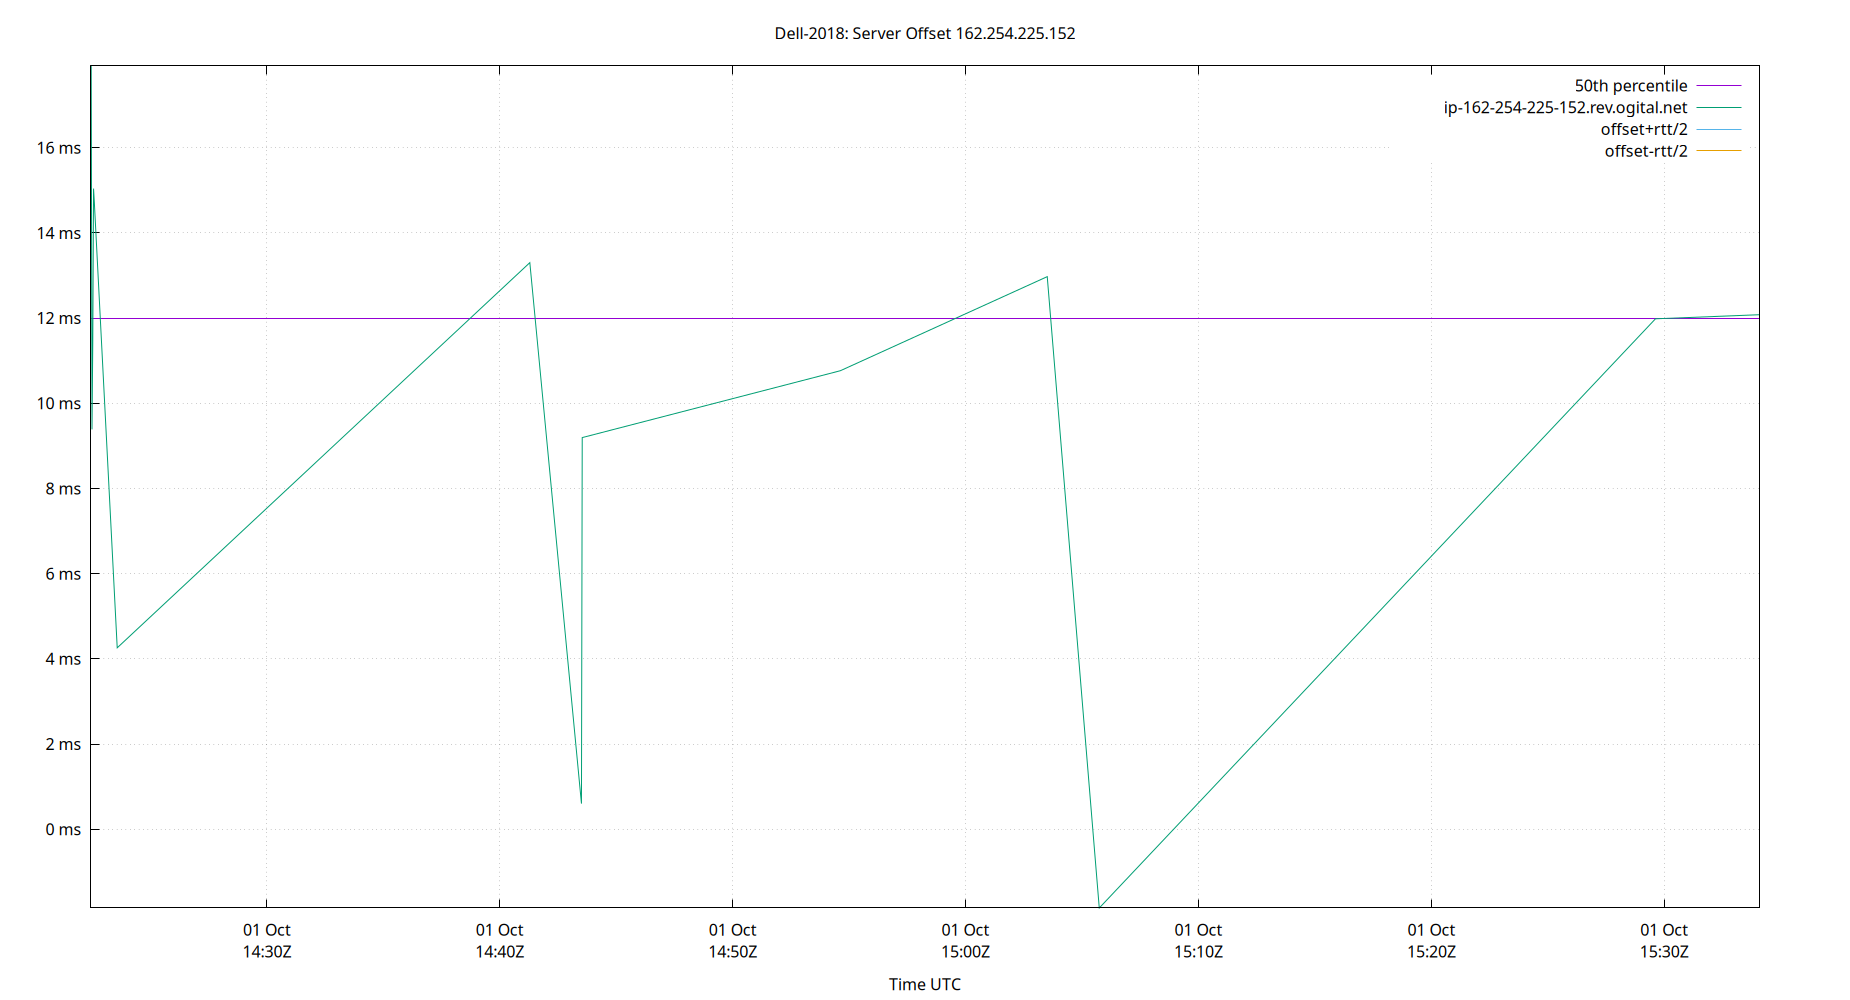
| Percentiles...... | Ranges...... | Skew- | Kurt- | |||||||||||||
| Name | Min | 1% | 5% | 50% | 95% | 99% | Max | 90% | 98% | StdDev | Mean | Units | ness | osis | ||
| Server Offset 162.254.225.152 | -1.848 | -1.848 | -1.848 | 11.984 | 17.922 | 17.922 | 17.922 | 19.770 | 19.770 | 5.527 | 10.638 | ms | -0.901 | 3.021 | ||
The offset of a server in seconds. This is useful to see how the measured offset is behaving.
The chart also plots offset±rtt, where rtt is the round trip time to the server. NTP can not really know the offset of a remote chimer, NTP computes it by subtracting rtt/2 from the offset. Plotting the offset±rtt reverses this calculation to more easily see the effects of rtt changes.
Closer to 0s is better. An ideal system would be a horizontal line at 0s. Typical 90% ranges may be: local LAN server 80µs; 90% ranges for WAN server may be 4ms and much larger.
Clock Offset is field 5 in the peerstats log file. The Round Trip Time (rtt) is field 6 in the peerstats log file.
Server Offset 163.123.152.14

| Percentiles...... | Ranges...... | Skew- | Kurt- | |||||||||||||
| Name | Min | 1% | 5% | 50% | 95% | 99% | Max | 90% | 98% | StdDev | Mean | Units | ness | osis | ||
| Server Offset 163.123.152.14 | 8.299 | 8.299 | 8.299 | 9.300 | 12.567 | 12.567 | 12.567 | 4.268 | 4.268 | 1.664 | 9.751 | ms | 0.9993 | 2.22 | ||
The offset of a server in seconds. This is useful to see how the measured offset is behaving.
The chart also plots offset±rtt, where rtt is the round trip time to the server. NTP can not really know the offset of a remote chimer, NTP computes it by subtracting rtt/2 from the offset. Plotting the offset±rtt reverses this calculation to more easily see the effects of rtt changes.
Closer to 0s is better. An ideal system would be a horizontal line at 0s. Typical 90% ranges may be: local LAN server 80µs; 90% ranges for WAN server may be 4ms and much larger.
Clock Offset is field 5 in the peerstats log file. The Round Trip Time (rtt) is field 6 in the peerstats log file.
Server Offset 163.123.153.14
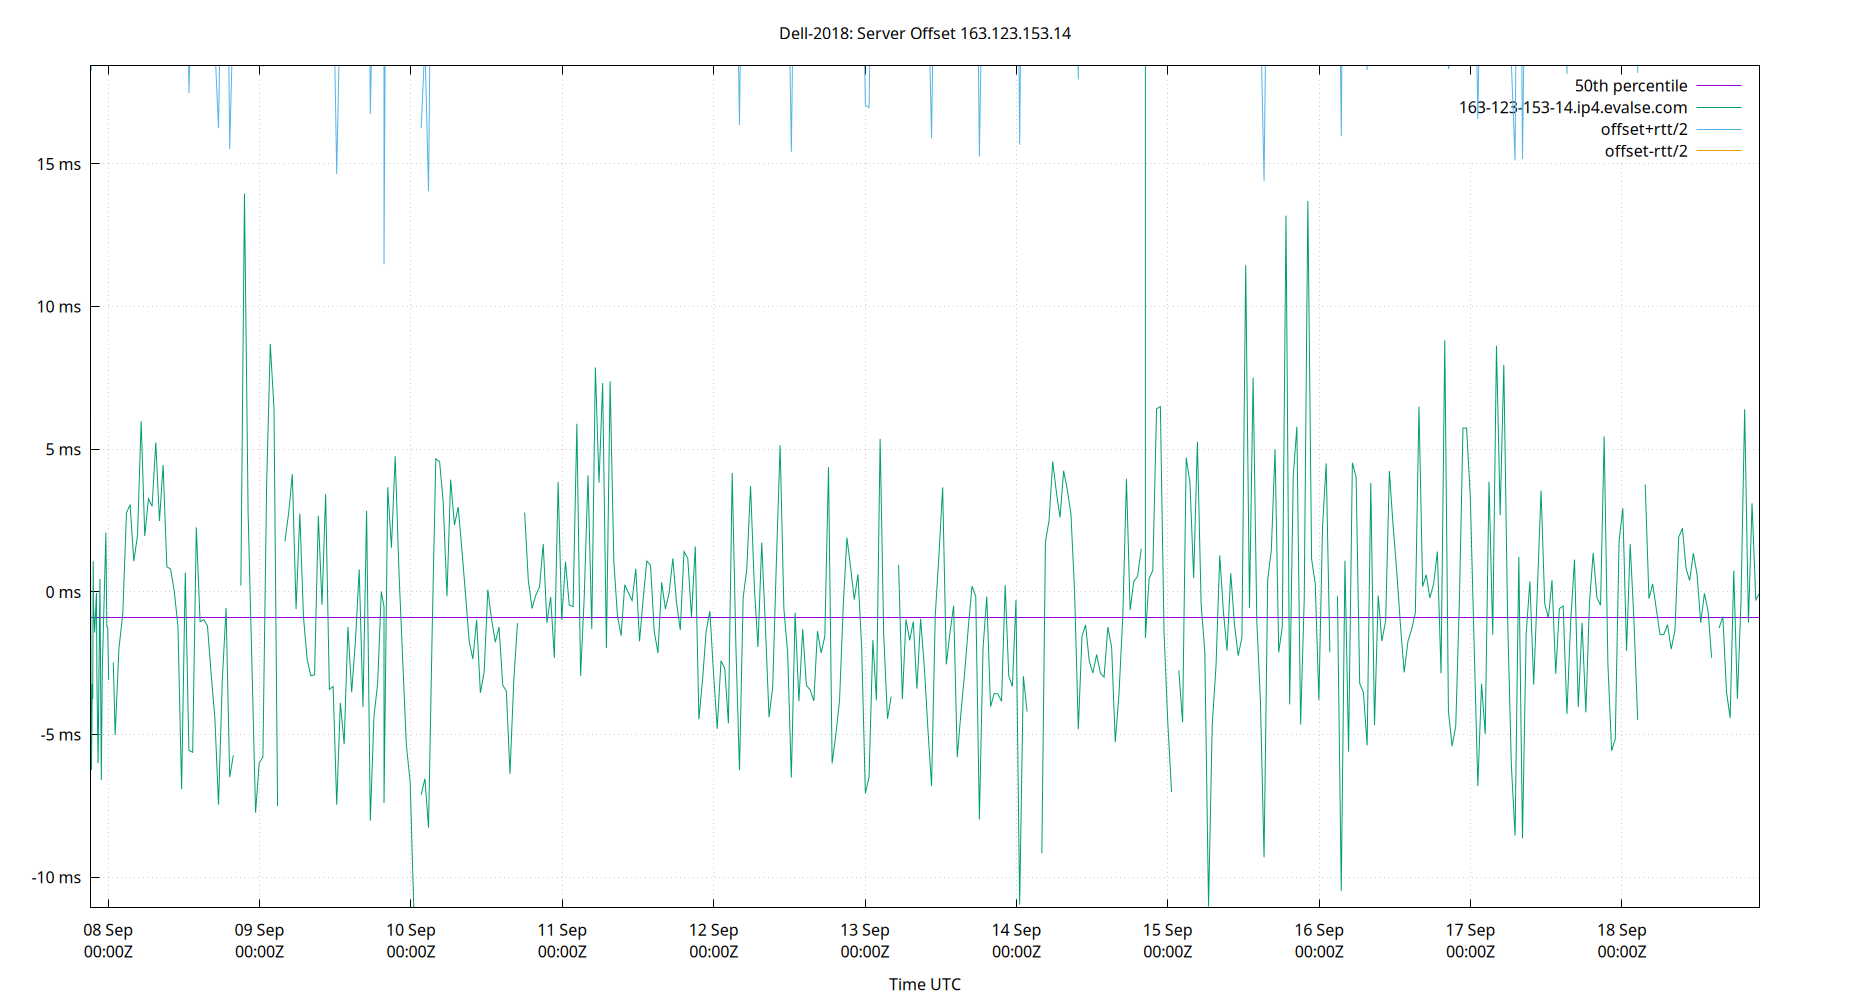
| Percentiles...... | Ranges...... | Skew- | Kurt- | |||||||||||||
| Name | Min | 1% | 5% | 50% | 95% | 99% | Max | 90% | 98% | StdDev | Mean | Units | ness | osis | ||
| Server Offset 163.123.153.14 | -11.080 | -9.441 | -6.494 | -0.864 | 5.239 | 8.821 | 18.438 | 11.732 | 18.261 | 3.609 | -0.733 | ms | 0.5776 | 5.508 | ||
The offset of a server in seconds. This is useful to see how the measured offset is behaving.
The chart also plots offset±rtt, where rtt is the round trip time to the server. NTP can not really know the offset of a remote chimer, NTP computes it by subtracting rtt/2 from the offset. Plotting the offset±rtt reverses this calculation to more easily see the effects of rtt changes.
Closer to 0s is better. An ideal system would be a horizontal line at 0s. Typical 90% ranges may be: local LAN server 80µs; 90% ranges for WAN server may be 4ms and much larger.
Clock Offset is field 5 in the peerstats log file. The Round Trip Time (rtt) is field 6 in the peerstats log file.
Server Offset 166.88.142.52

| Percentiles...... | Ranges...... | Skew- | Kurt- | |||||||||||||
| Name | Min | 1% | 5% | 50% | 95% | 99% | Max | 90% | 98% | StdDev | Mean | Units | ness | osis | ||
| Server Offset 166.88.142.52 | 2.966 | 2.966 | 2.966 | 4.246 | 7.638 | 7.638 | 7.638 | 4.671 | 4.671 | 1.508 | 4.329 | ms | 1.273 | 3.521 | ||
The offset of a server in seconds. This is useful to see how the measured offset is behaving.
The chart also plots offset±rtt, where rtt is the round trip time to the server. NTP can not really know the offset of a remote chimer, NTP computes it by subtracting rtt/2 from the offset. Plotting the offset±rtt reverses this calculation to more easily see the effects of rtt changes.
Closer to 0s is better. An ideal system would be a horizontal line at 0s. Typical 90% ranges may be: local LAN server 80µs; 90% ranges for WAN server may be 4ms and much larger.
Clock Offset is field 5 in the peerstats log file. The Round Trip Time (rtt) is field 6 in the peerstats log file.
Server Offset 168.235.89.132

| Percentiles...... | Ranges...... | Skew- | Kurt- | |||||||||||||
| Name | Min | 1% | 5% | 50% | 95% | 99% | Max | 90% | 98% | StdDev | Mean | Units | ness | osis | ||
| Server Offset 168.235.89.132 | -361.703 | -177.856 | -1.214 | 2.049 | 6.635 | 8.852 | 9.305 | 7.848 | 186.709 | 37.893 | -2.184 | ms | -8.706 | 79.36 | ||
The offset of a server in seconds. This is useful to see how the measured offset is behaving.
The chart also plots offset±rtt, where rtt is the round trip time to the server. NTP can not really know the offset of a remote chimer, NTP computes it by subtracting rtt/2 from the offset. Plotting the offset±rtt reverses this calculation to more easily see the effects of rtt changes.
Closer to 0s is better. An ideal system would be a horizontal line at 0s. Typical 90% ranges may be: local LAN server 80µs; 90% ranges for WAN server may be 4ms and much larger.
Clock Offset is field 5 in the peerstats log file. The Round Trip Time (rtt) is field 6 in the peerstats log file.
Server Offset 170.187.147.56

| Percentiles...... | Ranges...... | Skew- | Kurt- | |||||||||||||
| Name | Min | 1% | 5% | 50% | 95% | 99% | Max | 90% | 98% | StdDev | Mean | Units | ness | osis | ||
| Server Offset 170.187.147.56 | -0.641 | 0.705 | 1.980 | 4.722 | 8.587 | 9.921 | 12.448 | 6.607 | 9.216 | 2.044 | 4.934 | ms | 0.3738 | 3.245 | ||
The offset of a server in seconds. This is useful to see how the measured offset is behaving.
The chart also plots offset±rtt, where rtt is the round trip time to the server. NTP can not really know the offset of a remote chimer, NTP computes it by subtracting rtt/2 from the offset. Plotting the offset±rtt reverses this calculation to more easily see the effects of rtt changes.
Closer to 0s is better. An ideal system would be a horizontal line at 0s. Typical 90% ranges may be: local LAN server 80µs; 90% ranges for WAN server may be 4ms and much larger.
Clock Offset is field 5 in the peerstats log file. The Round Trip Time (rtt) is field 6 in the peerstats log file.
Server Offset 171.66.97.126

| Percentiles...... | Ranges...... | Skew- | Kurt- | |||||||||||||
| Name | Min | 1% | 5% | 50% | 95% | 99% | Max | 90% | 98% | StdDev | Mean | Units | ness | osis | ||
| Server Offset 171.66.97.126 | -111.117 | -109.795 | -2.851 | 0.792 | 3.175 | 6.263 | 130.236 | 6.027 | 116.058 | 15.291 | -0.217 | ms | -2.186 | 57.79 | ||
The offset of a server in seconds. This is useful to see how the measured offset is behaving.
The chart also plots offset±rtt, where rtt is the round trip time to the server. NTP can not really know the offset of a remote chimer, NTP computes it by subtracting rtt/2 from the offset. Plotting the offset±rtt reverses this calculation to more easily see the effects of rtt changes.
Closer to 0s is better. An ideal system would be a horizontal line at 0s. Typical 90% ranges may be: local LAN server 80µs; 90% ranges for WAN server may be 4ms and much larger.
Clock Offset is field 5 in the peerstats log file. The Round Trip Time (rtt) is field 6 in the peerstats log file.
Server Offset 172.104.28.175
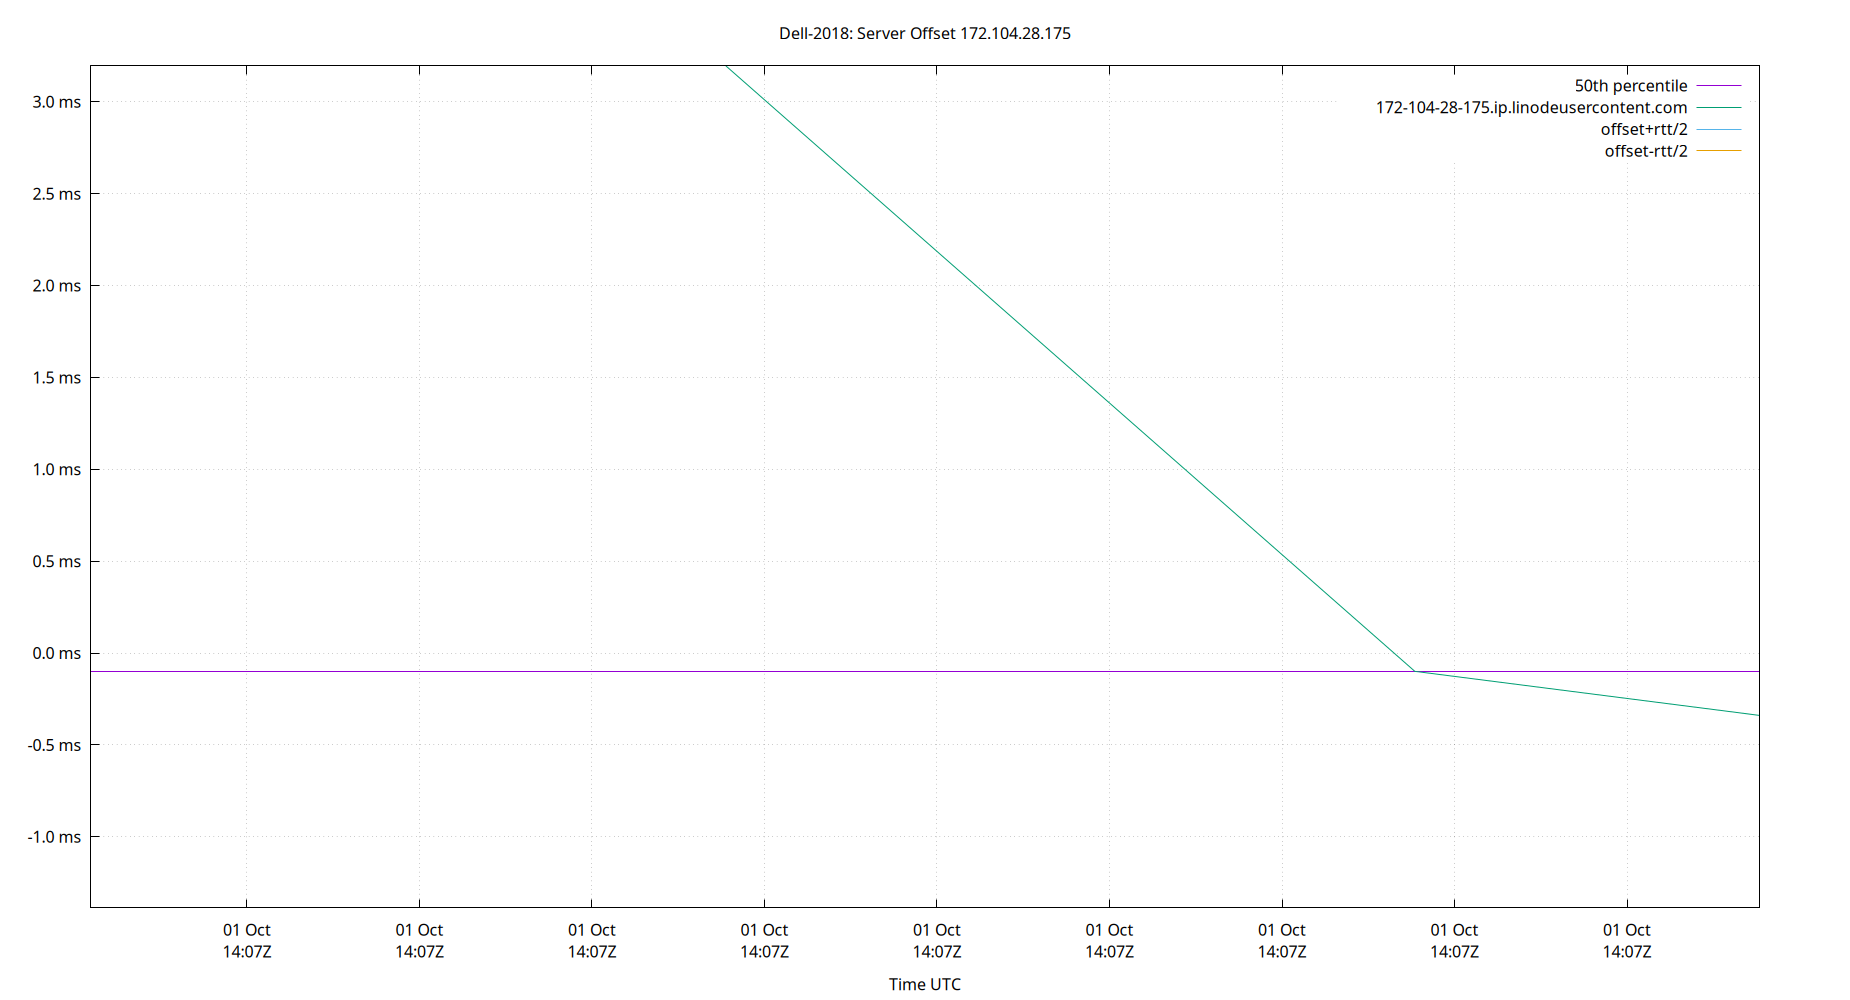
| Percentiles...... | Ranges...... | Skew- | Kurt- | |||||||||||||
| Name | Min | 1% | 5% | 50% | 95% | 99% | Max | 90% | 98% | StdDev | Mean | Units | ness | osis | ||
| Server Offset 172.104.28.175 | -1.388 | -1.388 | -1.388 | -0.100 | 3.196 | 3.196 | 3.196 | 4.583 | 4.583 | 1.717 | 0.342 | ms | 0.8717 | 2.171 | ||
The offset of a server in seconds. This is useful to see how the measured offset is behaving.
The chart also plots offset±rtt, where rtt is the round trip time to the server. NTP can not really know the offset of a remote chimer, NTP computes it by subtracting rtt/2 from the offset. Plotting the offset±rtt reverses this calculation to more easily see the effects of rtt changes.
Closer to 0s is better. An ideal system would be a horizontal line at 0s. Typical 90% ranges may be: local LAN server 80µs; 90% ranges for WAN server may be 4ms and much larger.
Clock Offset is field 5 in the peerstats log file. The Round Trip Time (rtt) is field 6 in the peerstats log file.
Server Offset 172.232.15.202

| Percentiles...... | Ranges...... | Skew- | Kurt- | |||||||||||||
| Name | Min | 1% | 5% | 50% | 95% | 99% | Max | 90% | 98% | StdDev | Mean | Units | ness | osis | ||
| Server Offset 172.232.15.202 | 0.710 | 0.710 | 0.710 | 4.702 | 38.555 | 38.555 | 38.555 | 37.846 | 37.846 | 15.838 | 13.311 | ms | 0.9197 | 1.889 | ||
The offset of a server in seconds. This is useful to see how the measured offset is behaving.
The chart also plots offset±rtt, where rtt is the round trip time to the server. NTP can not really know the offset of a remote chimer, NTP computes it by subtracting rtt/2 from the offset. Plotting the offset±rtt reverses this calculation to more easily see the effects of rtt changes.
Closer to 0s is better. An ideal system would be a horizontal line at 0s. Typical 90% ranges may be: local LAN server 80µs; 90% ranges for WAN server may be 4ms and much larger.
Clock Offset is field 5 in the peerstats log file. The Round Trip Time (rtt) is field 6 in the peerstats log file.
Server Offset 172.233.153.85

| Percentiles...... | Ranges...... | Skew- | Kurt- | |||||||||||||
| Name | Min | 1% | 5% | 50% | 95% | 99% | Max | 90% | 98% | StdDev | Mean | Units | ness | osis | ||
| Server Offset 172.233.153.85 | -9.447 | -9.196 | -7.932 | -3.852 | 1.978 | 2.524 | 2.830 | 9.910 | 11.720 | 3.072 | -3.587 | ms | 0.398 | 2.315 | ||
The offset of a server in seconds. This is useful to see how the measured offset is behaving.
The chart also plots offset±rtt, where rtt is the round trip time to the server. NTP can not really know the offset of a remote chimer, NTP computes it by subtracting rtt/2 from the offset. Plotting the offset±rtt reverses this calculation to more easily see the effects of rtt changes.
Closer to 0s is better. An ideal system would be a horizontal line at 0s. Typical 90% ranges may be: local LAN server 80µs; 90% ranges for WAN server may be 4ms and much larger.
Clock Offset is field 5 in the peerstats log file. The Round Trip Time (rtt) is field 6 in the peerstats log file.
Server Offset 172.233.155.39

| Percentiles...... | Ranges...... | Skew- | Kurt- | |||||||||||||
| Name | Min | 1% | 5% | 50% | 95% | 99% | Max | 90% | 98% | StdDev | Mean | Units | ness | osis | ||
| Server Offset 172.233.155.39 | -12.270 | -2.993 | -0.238 | 3.828 | 6.492 | 7.576 | 9.891 | 6.730 | 10.570 | 2.348 | 3.523 | ms | -1.715 | 12.15 | ||
The offset of a server in seconds. This is useful to see how the measured offset is behaving.
The chart also plots offset±rtt, where rtt is the round trip time to the server. NTP can not really know the offset of a remote chimer, NTP computes it by subtracting rtt/2 from the offset. Plotting the offset±rtt reverses this calculation to more easily see the effects of rtt changes.
Closer to 0s is better. An ideal system would be a horizontal line at 0s. Typical 90% ranges may be: local LAN server 80µs; 90% ranges for WAN server may be 4ms and much larger.
Clock Offset is field 5 in the peerstats log file. The Round Trip Time (rtt) is field 6 in the peerstats log file.
Server Offset 172.233.157.223

| Percentiles...... | Ranges...... | Skew- | Kurt- | |||||||||||||
| Name | Min | 1% | 5% | 50% | 95% | 99% | Max | 90% | 98% | StdDev | Mean | Units | ness | osis | ||
| Server Offset 172.233.157.223 | -34.981 | -2.753 | -0.945 | 2.900 | 14.155 | 443.646 | 725.734 | 15.100 | 446.399 | 61.368 | 11.433 | ms | 8.767 | 85.81 | ||
The offset of a server in seconds. This is useful to see how the measured offset is behaving.
The chart also plots offset±rtt, where rtt is the round trip time to the server. NTP can not really know the offset of a remote chimer, NTP computes it by subtracting rtt/2 from the offset. Plotting the offset±rtt reverses this calculation to more easily see the effects of rtt changes.
Closer to 0s is better. An ideal system would be a horizontal line at 0s. Typical 90% ranges may be: local LAN server 80µs; 90% ranges for WAN server may be 4ms and much larger.
Clock Offset is field 5 in the peerstats log file. The Round Trip Time (rtt) is field 6 in the peerstats log file.
Server Offset 172.233.177.198

| Percentiles...... | Ranges...... | Skew- | Kurt- | |||||||||||||
| Name | Min | 1% | 5% | 50% | 95% | 99% | Max | 90% | 98% | StdDev | Mean | Units | ness | osis | ||
| Server Offset 172.233.177.198 | -5.527 | -5.527 | -5.527 | 3.622 | 7.415 | 7.415 | 7.415 | 12.942 | 12.942 | 3.634 | 2.383 | ms | -0.9084 | 3.103 | ||
The offset of a server in seconds. This is useful to see how the measured offset is behaving.
The chart also plots offset±rtt, where rtt is the round trip time to the server. NTP can not really know the offset of a remote chimer, NTP computes it by subtracting rtt/2 from the offset. Plotting the offset±rtt reverses this calculation to more easily see the effects of rtt changes.
Closer to 0s is better. An ideal system would be a horizontal line at 0s. Typical 90% ranges may be: local LAN server 80µs; 90% ranges for WAN server may be 4ms and much larger.
Clock Offset is field 5 in the peerstats log file. The Round Trip Time (rtt) is field 6 in the peerstats log file.
Server Offset 172.233.189.68

| Percentiles...... | Ranges...... | Skew- | Kurt- | |||||||||||||
| Name | Min | 1% | 5% | 50% | 95% | 99% | Max | 90% | 98% | StdDev | Mean | Units | ness | osis | ||
| Server Offset 172.233.189.68 | 0.880 | 1.706 | 3.586 | 9.337 | 13.869 | 16.678 | 17.957 | 10.283 | 14.973 | 3.107 | 9.013 | ms | -0.04156 | 3.157 | ||
The offset of a server in seconds. This is useful to see how the measured offset is behaving.
The chart also plots offset±rtt, where rtt is the round trip time to the server. NTP can not really know the offset of a remote chimer, NTP computes it by subtracting rtt/2 from the offset. Plotting the offset±rtt reverses this calculation to more easily see the effects of rtt changes.
Closer to 0s is better. An ideal system would be a horizontal line at 0s. Typical 90% ranges may be: local LAN server 80µs; 90% ranges for WAN server may be 4ms and much larger.
Clock Offset is field 5 in the peerstats log file. The Round Trip Time (rtt) is field 6 in the peerstats log file.
Server Offset 172.234.25.10

| Percentiles...... | Ranges...... | Skew- | Kurt- | |||||||||||||
| Name | Min | 1% | 5% | 50% | 95% | 99% | Max | 90% | 98% | StdDev | Mean | Units | ness | osis | ||
| Server Offset 172.234.25.10 | -378.349 | -376.717 | 0.628 | 6.419 | 13.831 | 393.676 | 399.088 | 13.203 | 770.393 | 71.780 | 4.992 | ms | -0.5597 | 28.69 | ||
The offset of a server in seconds. This is useful to see how the measured offset is behaving.
The chart also plots offset±rtt, where rtt is the round trip time to the server. NTP can not really know the offset of a remote chimer, NTP computes it by subtracting rtt/2 from the offset. Plotting the offset±rtt reverses this calculation to more easily see the effects of rtt changes.
Closer to 0s is better. An ideal system would be a horizontal line at 0s. Typical 90% ranges may be: local LAN server 80µs; 90% ranges for WAN server may be 4ms and much larger.
Clock Offset is field 5 in the peerstats log file. The Round Trip Time (rtt) is field 6 in the peerstats log file.
Server Offset 172.234.37.140

| Percentiles...... | Ranges...... | Skew- | Kurt- | |||||||||||||
| Name | Min | 1% | 5% | 50% | 95% | 99% | Max | 90% | 98% | StdDev | Mean | Units | ness | osis | ||
| Server Offset 172.234.37.140 | -384.852 | -24.916 | -12.855 | 3.638 | 9.759 | 35.486 | 41.762 | 22.614 | 60.401 | 38.808 | -0.901 | ms | -9.283 | 91.27 | ||
The offset of a server in seconds. This is useful to see how the measured offset is behaving.
The chart also plots offset±rtt, where rtt is the round trip time to the server. NTP can not really know the offset of a remote chimer, NTP computes it by subtracting rtt/2 from the offset. Plotting the offset±rtt reverses this calculation to more easily see the effects of rtt changes.
Closer to 0s is better. An ideal system would be a horizontal line at 0s. Typical 90% ranges may be: local LAN server 80µs; 90% ranges for WAN server may be 4ms and much larger.
Clock Offset is field 5 in the peerstats log file. The Round Trip Time (rtt) is field 6 in the peerstats log file.
Server Offset 172.234.44.141

| Percentiles...... | Ranges...... | Skew- | Kurt- | |||||||||||||
| Name | Min | 1% | 5% | 50% | 95% | 99% | Max | 90% | 98% | StdDev | Mean | Units | ness | osis | ||
| Server Offset 172.234.44.141 | -1.177 | -0.747 | 1.570 | 5.464 | 9.373 | 13.230 | 14.363 | 7.803 | 13.977 | 2.599 | 5.476 | ms | 0.3544 | 4.619 | ||
The offset of a server in seconds. This is useful to see how the measured offset is behaving.
The chart also plots offset±rtt, where rtt is the round trip time to the server. NTP can not really know the offset of a remote chimer, NTP computes it by subtracting rtt/2 from the offset. Plotting the offset±rtt reverses this calculation to more easily see the effects of rtt changes.
Closer to 0s is better. An ideal system would be a horizontal line at 0s. Typical 90% ranges may be: local LAN server 80µs; 90% ranges for WAN server may be 4ms and much larger.
Clock Offset is field 5 in the peerstats log file. The Round Trip Time (rtt) is field 6 in the peerstats log file.
Server Offset 172.235.154.118
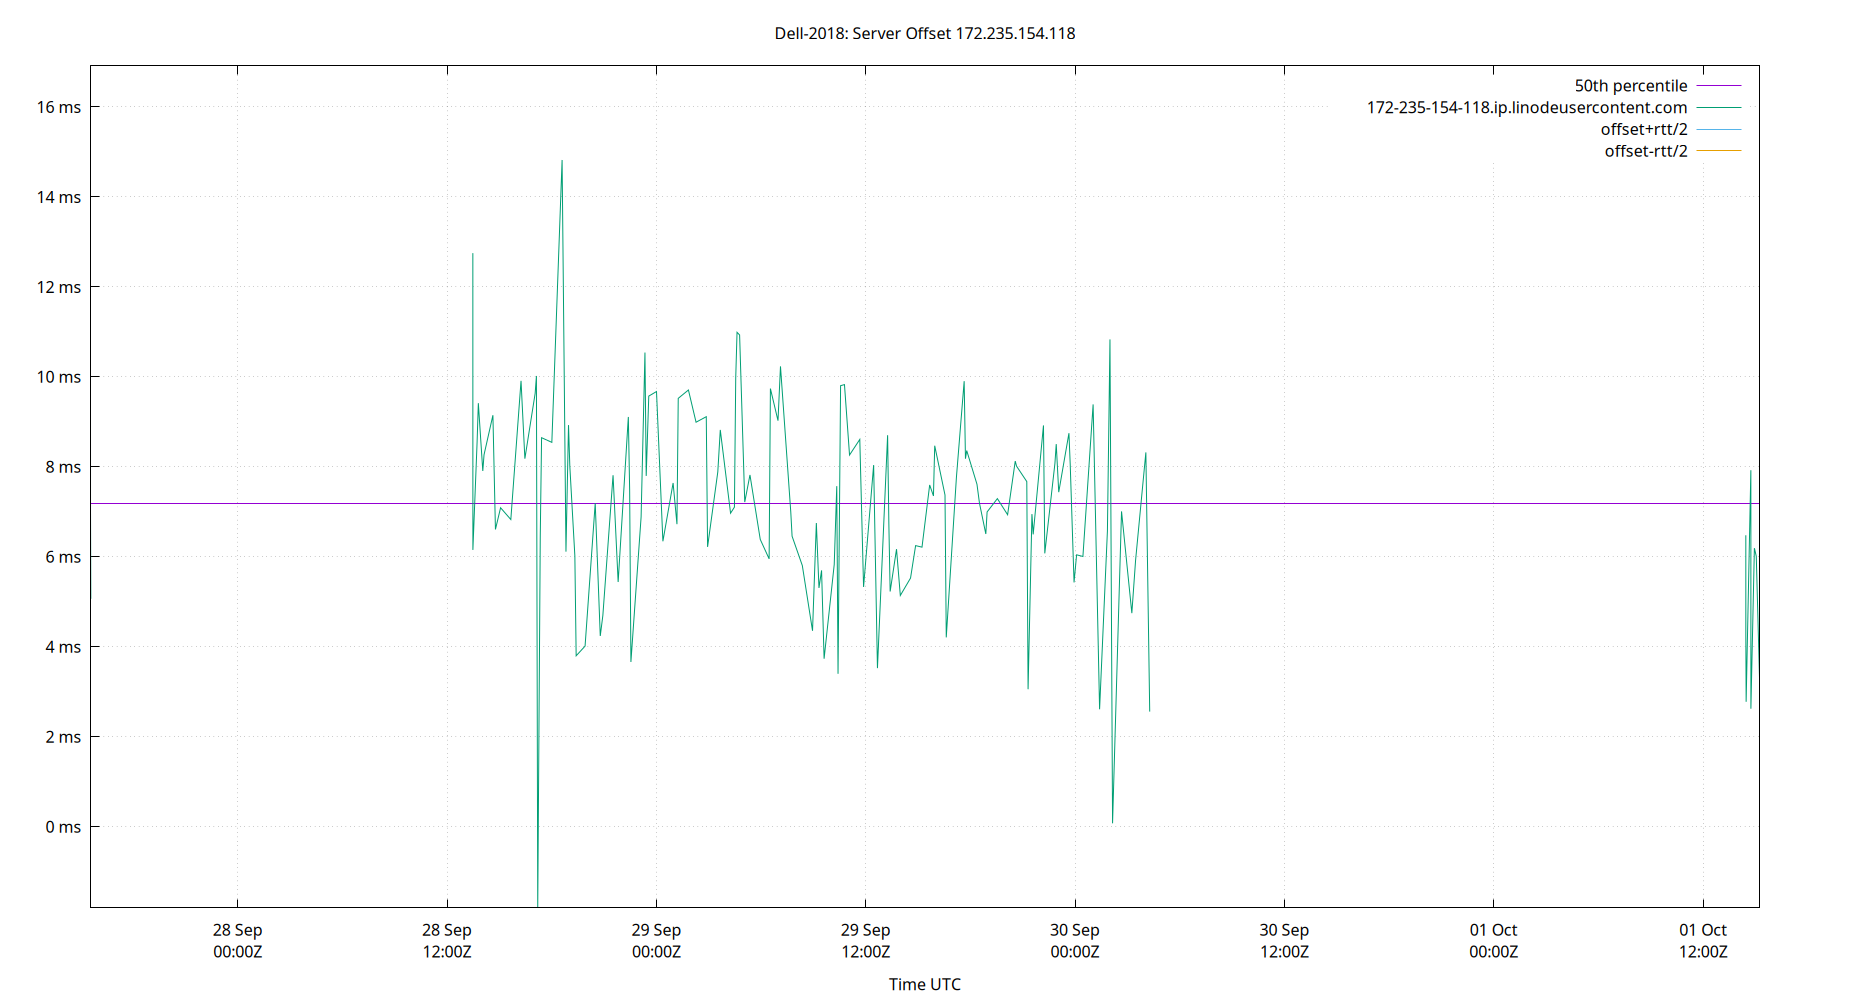
| Percentiles...... | Ranges...... | Skew- | Kurt- | |||||||||||||
| Name | Min | 1% | 5% | 50% | 95% | 99% | Max | 90% | 98% | StdDev | Mean | Units | ness | osis | ||
| Server Offset 172.235.154.118 | -1.805 | 0.077 | 3.315 | 7.192 | 10.233 | 14.821 | 16.912 | 6.918 | 14.744 | 2.413 | 7.174 | ms | 0.02952 | 5.667 | ||
The offset of a server in seconds. This is useful to see how the measured offset is behaving.
The chart also plots offset±rtt, where rtt is the round trip time to the server. NTP can not really know the offset of a remote chimer, NTP computes it by subtracting rtt/2 from the offset. Plotting the offset±rtt reverses this calculation to more easily see the effects of rtt changes.
Closer to 0s is better. An ideal system would be a horizontal line at 0s. Typical 90% ranges may be: local LAN server 80µs; 90% ranges for WAN server may be 4ms and much larger.
Clock Offset is field 5 in the peerstats log file. The Round Trip Time (rtt) is field 6 in the peerstats log file.
Server Offset 172.235.60.8

| Percentiles...... | Ranges...... | Skew- | Kurt- | |||||||||||||
| Name | Min | 1% | 5% | 50% | 95% | 99% | Max | 90% | 98% | StdDev | Mean | Units | ness | osis | ||
| Server Offset 172.235.60.8 | -1,994.828 | -7.193 | -2.951 | 1.687 | 6.652 | 8.955 | 47.412 | 9.602 | 16.148 | 100.097 | -3.238 | ms | -19.74 | 391.2 | ||
The offset of a server in seconds. This is useful to see how the measured offset is behaving.
The chart also plots offset±rtt, where rtt is the round trip time to the server. NTP can not really know the offset of a remote chimer, NTP computes it by subtracting rtt/2 from the offset. Plotting the offset±rtt reverses this calculation to more easily see the effects of rtt changes.
Closer to 0s is better. An ideal system would be a horizontal line at 0s. Typical 90% ranges may be: local LAN server 80µs; 90% ranges for WAN server may be 4ms and much larger.
Clock Offset is field 5 in the peerstats log file. The Round Trip Time (rtt) is field 6 in the peerstats log file.
Server Offset 172.238.164.57

| Percentiles...... | Ranges...... | Skew- | Kurt- | |||||||||||||
| Name | Min | 1% | 5% | 50% | 95% | 99% | Max | 90% | 98% | StdDev | Mean | Units | ness | osis | ||
| Server Offset 172.238.164.57 | -20.678 | -5.109 | -3.388 | 1.693 | 6.481 | 7.573 | 11.018 | 9.869 | 12.682 | 3.241 | 1.724 | ms | -0.3793 | 3.926 | ||
The offset of a server in seconds. This is useful to see how the measured offset is behaving.
The chart also plots offset±rtt, where rtt is the round trip time to the server. NTP can not really know the offset of a remote chimer, NTP computes it by subtracting rtt/2 from the offset. Plotting the offset±rtt reverses this calculation to more easily see the effects of rtt changes.
Closer to 0s is better. An ideal system would be a horizontal line at 0s. Typical 90% ranges may be: local LAN server 80µs; 90% ranges for WAN server may be 4ms and much larger.
Clock Offset is field 5 in the peerstats log file. The Round Trip Time (rtt) is field 6 in the peerstats log file.
Server Offset 172.245.210.108

| Percentiles...... | Ranges...... | Skew- | Kurt- | |||||||||||||
| Name | Min | 1% | 5% | 50% | 95% | 99% | Max | 90% | 98% | StdDev | Mean | Units | ness | osis | ||
| Server Offset 172.245.210.108 | -261.506 | -261.506 | -251.411 | 0.386 | 170.775 | 173.801 | 173.801 | 422.186 | 435.307 | 82.626 | -6.480 | ms | -0.7581 | 6.622 | ||
The offset of a server in seconds. This is useful to see how the measured offset is behaving.
The chart also plots offset±rtt, where rtt is the round trip time to the server. NTP can not really know the offset of a remote chimer, NTP computes it by subtracting rtt/2 from the offset. Plotting the offset±rtt reverses this calculation to more easily see the effects of rtt changes.
Closer to 0s is better. An ideal system would be a horizontal line at 0s. Typical 90% ranges may be: local LAN server 80µs; 90% ranges for WAN server may be 4ms and much larger.
Clock Offset is field 5 in the peerstats log file. The Round Trip Time (rtt) is field 6 in the peerstats log file.
Server Offset 173.249.203.227

| Percentiles...... | Ranges...... | Skew- | Kurt- | |||||||||||||
| Name | Min | 1% | 5% | 50% | 95% | 99% | Max | 90% | 98% | StdDev | Mean | Units | ness | osis | ||
| Server Offset 173.249.203.227 | 2.418 | 2.418 | 2.418 | 7.578 | 11.331 | 11.331 | 11.331 | 8.912 | 8.912 | 2.607 | 6.865 | ms | -0.2799 | 2.399 | ||
The offset of a server in seconds. This is useful to see how the measured offset is behaving.
The chart also plots offset±rtt, where rtt is the round trip time to the server. NTP can not really know the offset of a remote chimer, NTP computes it by subtracting rtt/2 from the offset. Plotting the offset±rtt reverses this calculation to more easily see the effects of rtt changes.
Closer to 0s is better. An ideal system would be a horizontal line at 0s. Typical 90% ranges may be: local LAN server 80µs; 90% ranges for WAN server may be 4ms and much larger.
Clock Offset is field 5 in the peerstats log file. The Round Trip Time (rtt) is field 6 in the peerstats log file.
Server Offset 173.255.230.96

| Percentiles...... | Ranges...... | Skew- | Kurt- | |||||||||||||
| Name | Min | 1% | 5% | 50% | 95% | 99% | Max | 90% | 98% | StdDev | Mean | Units | ness | osis | ||
| Server Offset 173.255.230.96 | -4.019 | -1.915 | 0.365 | 4.658 | 8.077 | 9.189 | 28.541 | 7.712 | 11.104 | 2.614 | 4.581 | ms | 2.225 | 26.93 | ||
The offset of a server in seconds. This is useful to see how the measured offset is behaving.
The chart also plots offset±rtt, where rtt is the round trip time to the server. NTP can not really know the offset of a remote chimer, NTP computes it by subtracting rtt/2 from the offset. Plotting the offset±rtt reverses this calculation to more easily see the effects of rtt changes.
Closer to 0s is better. An ideal system would be a horizontal line at 0s. Typical 90% ranges may be: local LAN server 80µs; 90% ranges for WAN server may be 4ms and much larger.
Clock Offset is field 5 in the peerstats log file. The Round Trip Time (rtt) is field 6 in the peerstats log file.
Server Offset 173.255.255.133

| Percentiles...... | Ranges...... | Skew- | Kurt- | |||||||||||||
| Name | Min | 1% | 5% | 50% | 95% | 99% | Max | 90% | 98% | StdDev | Mean | Units | ness | osis | ||
| Server Offset 173.255.255.133 | -1.715 | -1.715 | -1.715 | -0.964 | 1.511 | 1.511 | 1.511 | 3.226 | 3.226 | 1.274 | -0.647 | ms | 1.007 | 2.214 | ||
The offset of a server in seconds. This is useful to see how the measured offset is behaving.
The chart also plots offset±rtt, where rtt is the round trip time to the server. NTP can not really know the offset of a remote chimer, NTP computes it by subtracting rtt/2 from the offset. Plotting the offset±rtt reverses this calculation to more easily see the effects of rtt changes.
Closer to 0s is better. An ideal system would be a horizontal line at 0s. Typical 90% ranges may be: local LAN server 80µs; 90% ranges for WAN server may be 4ms and much larger.
Clock Offset is field 5 in the peerstats log file. The Round Trip Time (rtt) is field 6 in the peerstats log file.
Server Offset 178.156.185.92

| Percentiles...... | Ranges...... | Skew- | Kurt- | |||||||||||||
| Name | Min | 1% | 5% | 50% | 95% | 99% | Max | 90% | 98% | StdDev | Mean | Units | ness | osis | ||
| Server Offset 178.156.185.92 | -26.222 | -8.831 | -4.147 | -0.703 | 5.776 | 8.694 | 15.799 | 9.923 | 17.525 | 3.089 | -0.428 | ms | -0.01771 | 10.84 | ||
The offset of a server in seconds. This is useful to see how the measured offset is behaving.
The chart also plots offset±rtt, where rtt is the round trip time to the server. NTP can not really know the offset of a remote chimer, NTP computes it by subtracting rtt/2 from the offset. Plotting the offset±rtt reverses this calculation to more easily see the effects of rtt changes.
Closer to 0s is better. An ideal system would be a horizontal line at 0s. Typical 90% ranges may be: local LAN server 80µs; 90% ranges for WAN server may be 4ms and much larger.
Clock Offset is field 5 in the peerstats log file. The Round Trip Time (rtt) is field 6 in the peerstats log file.
Server Offset 185.214.143.237

| Percentiles...... | Ranges...... | Skew- | Kurt- | |||||||||||||
| Name | Min | 1% | 5% | 50% | 95% | 99% | Max | 90% | 98% | StdDev | Mean | Units | ness | osis | ||
| Server Offset 185.214.143.237 | -1.142 | -1.142 | 0.235 | 4.432 | 9.788 | 396.180 | 396.180 | 9.553 | 397.322 | 67.845 | 16.688 | ms | 5.377 | 29.95 | ||
The offset of a server in seconds. This is useful to see how the measured offset is behaving.
The chart also plots offset±rtt, where rtt is the round trip time to the server. NTP can not really know the offset of a remote chimer, NTP computes it by subtracting rtt/2 from the offset. Plotting the offset±rtt reverses this calculation to more easily see the effects of rtt changes.
Closer to 0s is better. An ideal system would be a horizontal line at 0s. Typical 90% ranges may be: local LAN server 80µs; 90% ranges for WAN server may be 4ms and much larger.
Clock Offset is field 5 in the peerstats log file. The Round Trip Time (rtt) is field 6 in the peerstats log file.
Server Offset 185.234.20.134

| Percentiles...... | Ranges...... | Skew- | Kurt- | |||||||||||||
| Name | Min | 1% | 5% | 50% | 95% | 99% | Max | 90% | 98% | StdDev | Mean | Units | ness | osis | ||
| Server Offset 185.234.20.134 | -207.966 | -198.229 | 8.539 | 43.765 | 55.709 | 222.317 | 228.892 | 47.170 | 420.546 | 42.923 | 39.520 | ms | -0.8843 | 22.3 | ||
The offset of a server in seconds. This is useful to see how the measured offset is behaving.
The chart also plots offset±rtt, where rtt is the round trip time to the server. NTP can not really know the offset of a remote chimer, NTP computes it by subtracting rtt/2 from the offset. Plotting the offset±rtt reverses this calculation to more easily see the effects of rtt changes.
Closer to 0s is better. An ideal system would be a horizontal line at 0s. Typical 90% ranges may be: local LAN server 80µs; 90% ranges for WAN server may be 4ms and much larger.
Clock Offset is field 5 in the peerstats log file. The Round Trip Time (rtt) is field 6 in the peerstats log file.
Server Offset 192.207.55.254
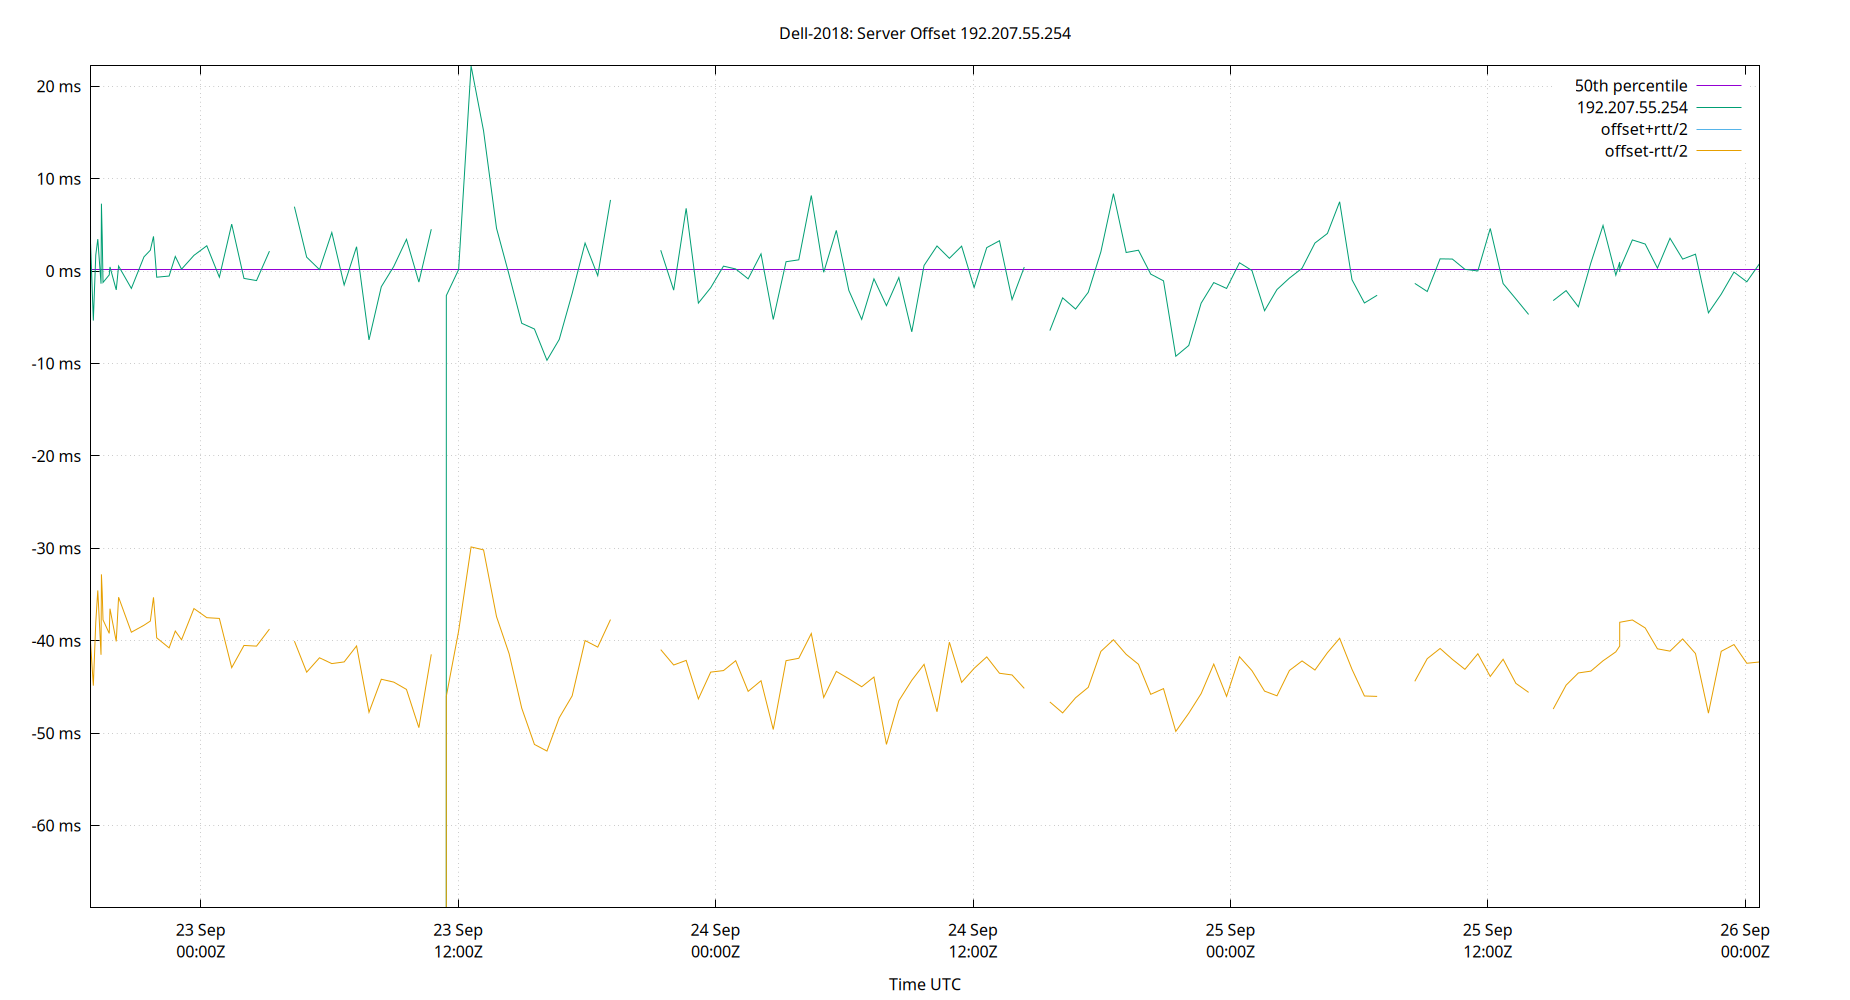
| Percentiles...... | Ranges...... | Skew- | Kurt- | |||||||||||||
| Name | Min | 1% | 5% | 50% | 95% | 99% | Max | 90% | 98% | StdDev | Mean | Units | ness | osis | ||
| Server Offset 192.207.55.254 | -68.913 | -55.256 | -6.572 | 0.132 | 6.972 | 15.177 | 22.208 | 13.544 | 70.432 | 8.299 | -0.601 | ms | -5.484 | 44.3 | ||
The offset of a server in seconds. This is useful to see how the measured offset is behaving.
The chart also plots offset±rtt, where rtt is the round trip time to the server. NTP can not really know the offset of a remote chimer, NTP computes it by subtracting rtt/2 from the offset. Plotting the offset±rtt reverses this calculation to more easily see the effects of rtt changes.
Closer to 0s is better. An ideal system would be a horizontal line at 0s. Typical 90% ranges may be: local LAN server 80µs; 90% ranges for WAN server may be 4ms and much larger.
Clock Offset is field 5 in the peerstats log file. The Round Trip Time (rtt) is field 6 in the peerstats log file.
Server Offset 192.231.84.117
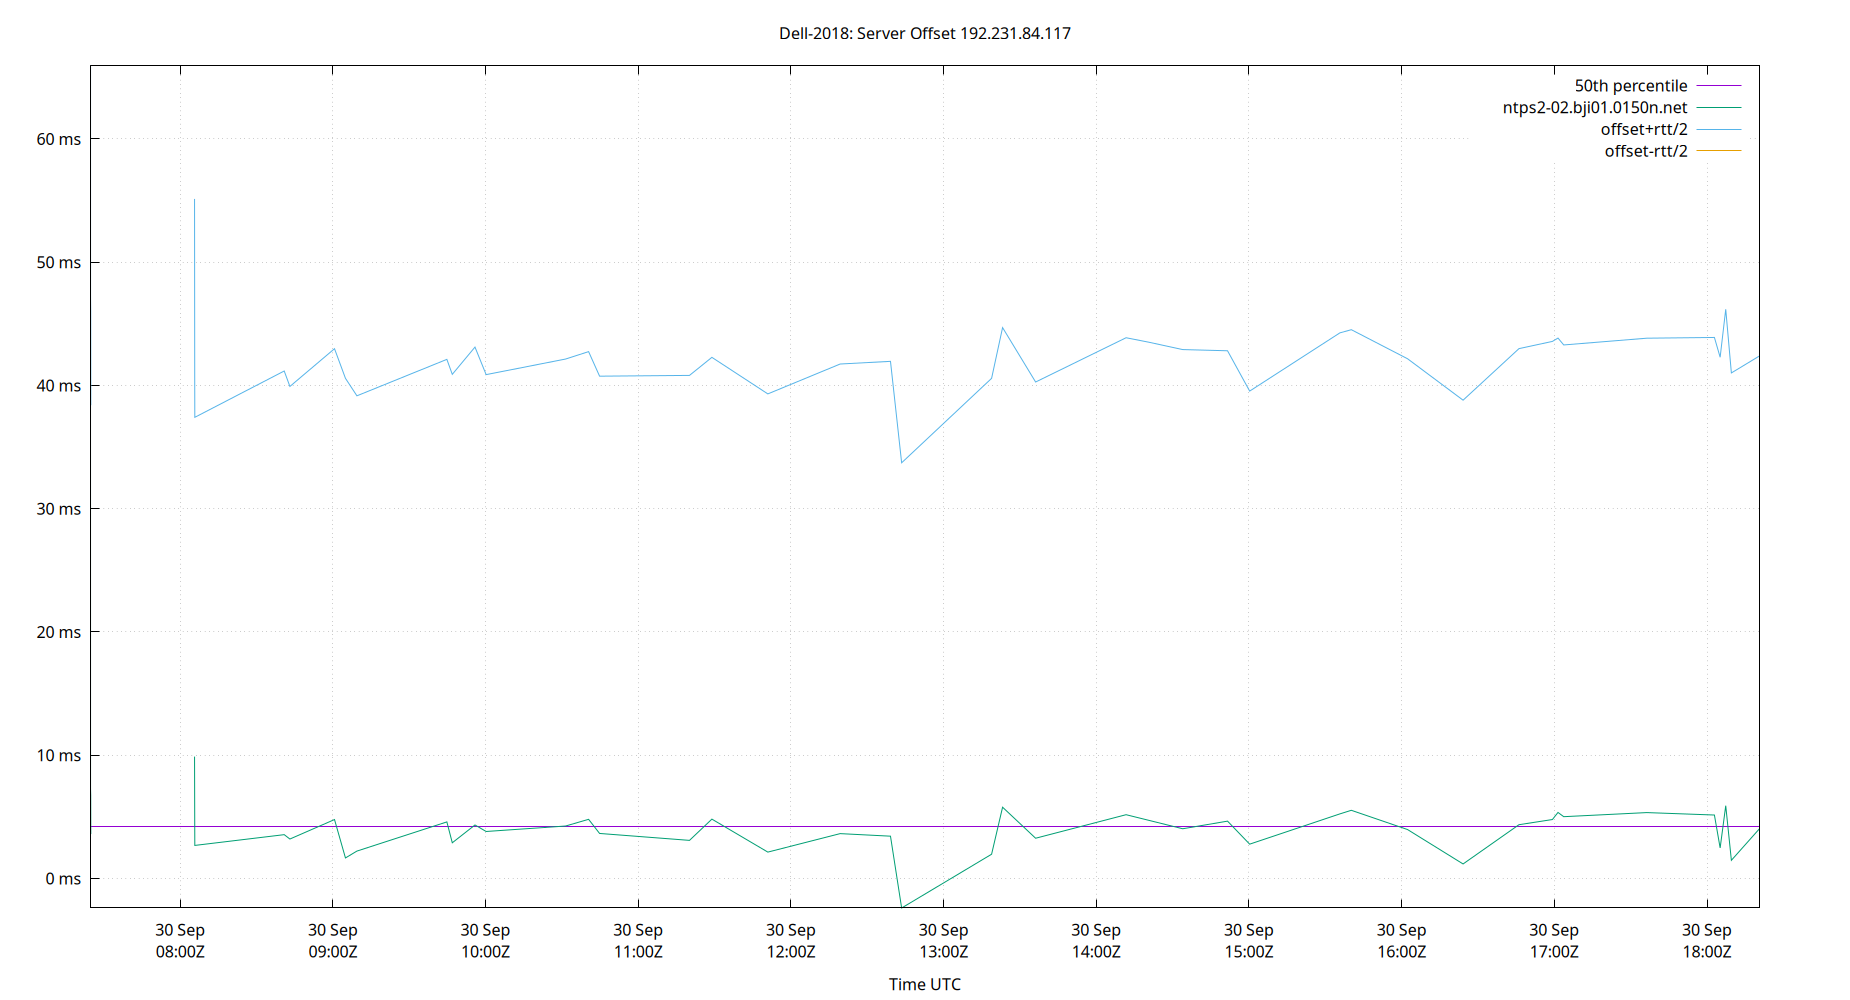
| Percentiles...... | Ranges...... | Skew- | Kurt- | |||||||||||||
| Name | Min | 1% | 5% | 50% | 95% | 99% | Max | 90% | 98% | StdDev | Mean | Units | ness | osis | ||
| Server Offset 192.231.84.117 | -2.391 | -2.391 | 1.478 | 4.260 | 7.283 | 65.926 | 65.926 | 5.805 | 68.317 | 9.116 | 5.351 | ms | 6.221 | 41.5 | ||
The offset of a server in seconds. This is useful to see how the measured offset is behaving.
The chart also plots offset±rtt, where rtt is the round trip time to the server. NTP can not really know the offset of a remote chimer, NTP computes it by subtracting rtt/2 from the offset. Plotting the offset±rtt reverses this calculation to more easily see the effects of rtt changes.
Closer to 0s is better. An ideal system would be a horizontal line at 0s. Typical 90% ranges may be: local LAN server 80µs; 90% ranges for WAN server may be 4ms and much larger.
Clock Offset is field 5 in the peerstats log file. The Round Trip Time (rtt) is field 6 in the peerstats log file.
Server Offset 192.231.84.118
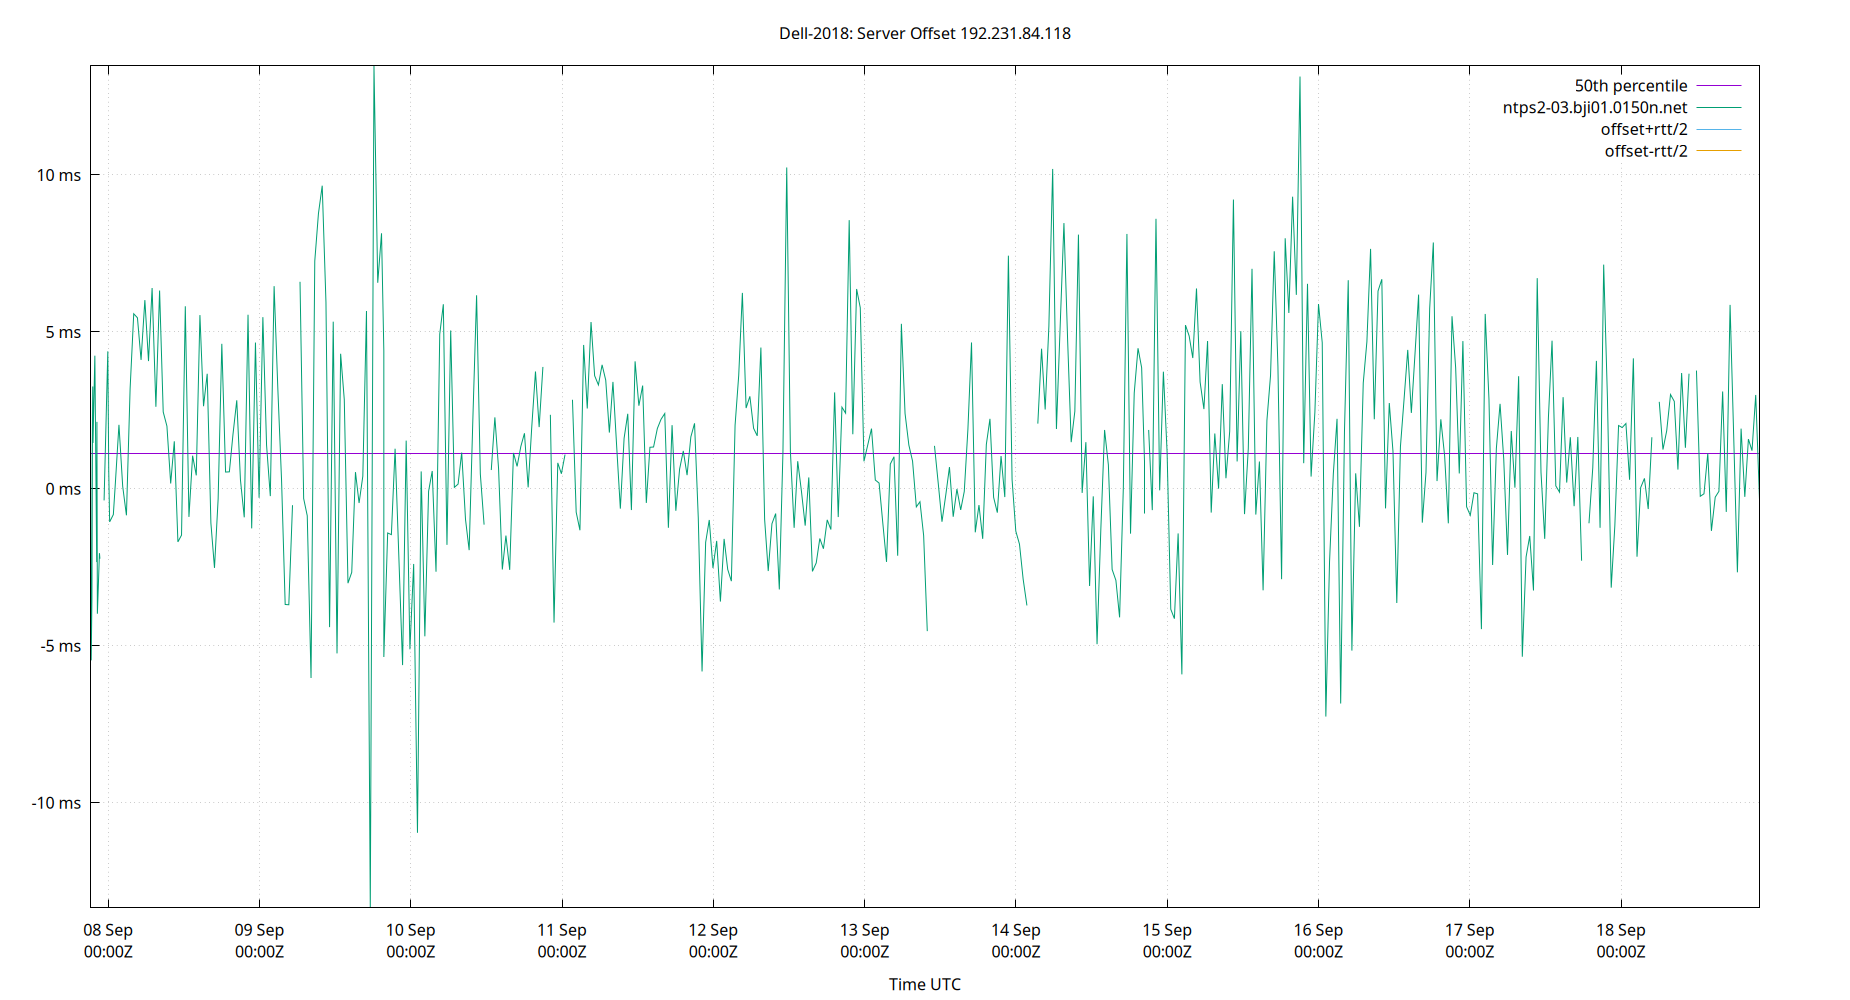
| Percentiles...... | Ranges...... | Skew- | Kurt- | |||||||||||||
| Name | Min | 1% | 5% | 50% | 95% | 99% | Max | 90% | 98% | StdDev | Mean | Units | ness | osis | ||
| Server Offset 192.231.84.118 | -13.353 | -5.910 | -3.636 | 1.189 | 6.565 | 9.659 | 13.476 | 10.201 | 15.569 | 3.189 | 1.298 | ms | 0.1704 | 4.599 | ||
The offset of a server in seconds. This is useful to see how the measured offset is behaving.
The chart also plots offset±rtt, where rtt is the round trip time to the server. NTP can not really know the offset of a remote chimer, NTP computes it by subtracting rtt/2 from the offset. Plotting the offset±rtt reverses this calculation to more easily see the effects of rtt changes.
Closer to 0s is better. An ideal system would be a horizontal line at 0s. Typical 90% ranges may be: local LAN server 80µs; 90% ranges for WAN server may be 4ms and much larger.
Clock Offset is field 5 in the peerstats log file. The Round Trip Time (rtt) is field 6 in the peerstats log file.
Server Offset 192.48.105.15

| Percentiles...... | Ranges...... | Skew- | Kurt- | |||||||||||||
| Name | Min | 1% | 5% | 50% | 95% | 99% | Max | 90% | 98% | StdDev | Mean | Units | ness | osis | ||
| Server Offset 192.48.105.15 | -38.144 | -16.120 | -9.873 | 4.243 | 8.544 | 13.335 | 24.385 | 18.417 | 29.455 | 5.972 | 2.916 | ms | -2.066 | 11.6 | ||
The offset of a server in seconds. This is useful to see how the measured offset is behaving.
The chart also plots offset±rtt, where rtt is the round trip time to the server. NTP can not really know the offset of a remote chimer, NTP computes it by subtracting rtt/2 from the offset. Plotting the offset±rtt reverses this calculation to more easily see the effects of rtt changes.
Closer to 0s is better. An ideal system would be a horizontal line at 0s. Typical 90% ranges may be: local LAN server 80µs; 90% ranges for WAN server may be 4ms and much larger.
Clock Offset is field 5 in the peerstats log file. The Round Trip Time (rtt) is field 6 in the peerstats log file.
Server Offset 193.29.63.226

| Percentiles...... | Ranges...... | Skew- | Kurt- | |||||||||||||
| Name | Min | 1% | 5% | 50% | 95% | 99% | Max | 90% | 98% | StdDev | Mean | Units | ness | osis | ||
| Server Offset 193.29.63.226 | -3.460 | -3.460 | -3.460 | 3.103 | 9.170 | 9.170 | 9.170 | 12.629 | 12.629 | 3.530 | 2.605 | ms | 0.006634 | 1.907 | ||
The offset of a server in seconds. This is useful to see how the measured offset is behaving.
The chart also plots offset±rtt, where rtt is the round trip time to the server. NTP can not really know the offset of a remote chimer, NTP computes it by subtracting rtt/2 from the offset. Plotting the offset±rtt reverses this calculation to more easily see the effects of rtt changes.
Closer to 0s is better. An ideal system would be a horizontal line at 0s. Typical 90% ranges may be: local LAN server 80µs; 90% ranges for WAN server may be 4ms and much larger.
Clock Offset is field 5 in the peerstats log file. The Round Trip Time (rtt) is field 6 in the peerstats log file.
Server Offset 194.0.5.123

| Percentiles...... | Ranges...... | Skew- | Kurt- | |||||||||||||
| Name | Min | 1% | 5% | 50% | 95% | 99% | Max | 90% | 98% | StdDev | Mean | Units | ness | osis | ||
| Server Offset 194.0.5.123 | -1,993.360 | -6.802 | -3.131 | 1.946 | 7.362 | 10.340 | 898.980 | 10.494 | 17.142 | 45.184 | 1.508 | ms | -37.13 | 1737 | ||
The offset of a server in seconds. This is useful to see how the measured offset is behaving.
The chart also plots offset±rtt, where rtt is the round trip time to the server. NTP can not really know the offset of a remote chimer, NTP computes it by subtracting rtt/2 from the offset. Plotting the offset±rtt reverses this calculation to more easily see the effects of rtt changes.
Closer to 0s is better. An ideal system would be a horizontal line at 0s. Typical 90% ranges may be: local LAN server 80µs; 90% ranges for WAN server may be 4ms and much larger.
Clock Offset is field 5 in the peerstats log file. The Round Trip Time (rtt) is field 6 in the peerstats log file.
Server Offset 198.137.202.56

| Percentiles...... | Ranges...... | Skew- | Kurt- | |||||||||||||
| Name | Min | 1% | 5% | 50% | 95% | 99% | Max | 90% | 98% | StdDev | Mean | Units | ness | osis | ||
| Server Offset 198.137.202.56 | -206.226 | -10.041 | -4.536 | -0.451 | 4.604 | 14.936 | 34.211 | 9.140 | 24.977 | 10.104 | -0.736 | ms | -14.4 | 266 | ||
The offset of a server in seconds. This is useful to see how the measured offset is behaving.
The chart also plots offset±rtt, where rtt is the round trip time to the server. NTP can not really know the offset of a remote chimer, NTP computes it by subtracting rtt/2 from the offset. Plotting the offset±rtt reverses this calculation to more easily see the effects of rtt changes.
Closer to 0s is better. An ideal system would be a horizontal line at 0s. Typical 90% ranges may be: local LAN server 80µs; 90% ranges for WAN server may be 4ms and much larger.
Clock Offset is field 5 in the peerstats log file. The Round Trip Time (rtt) is field 6 in the peerstats log file.
Server Offset 198.206.187.98
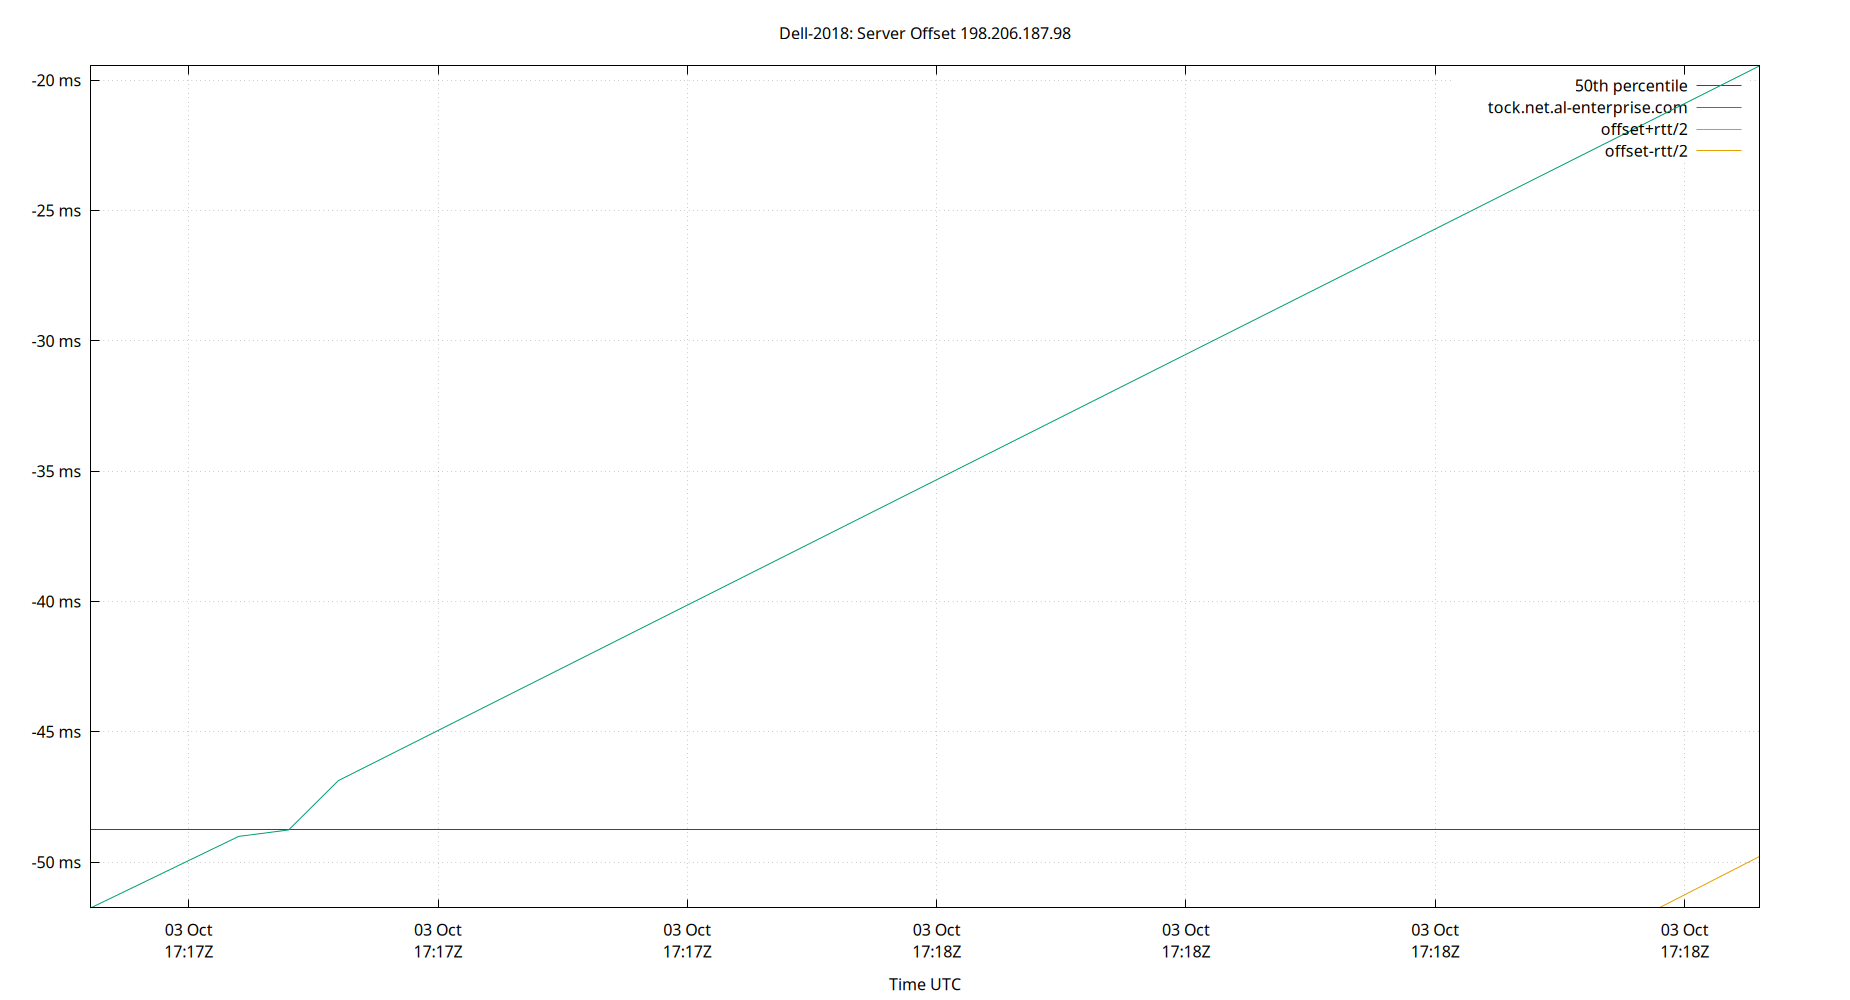
| Percentiles...... | Ranges...... | Skew- | Kurt- | |||||||||||||
| Name | Min | 1% | 5% | 50% | 95% | 99% | Max | 90% | 98% | StdDev | Mean | Units | ness | osis | ||
| Server Offset 198.206.187.98 | -51.757 | -51.757 | -51.757 | -48.763 | -19.447 | -19.447 | -19.447 | 32.310 | 32.310 | 11.963 | -43.169 | ms | 1.436 | 3.168 | ||
The offset of a server in seconds. This is useful to see how the measured offset is behaving.
The chart also plots offset±rtt, where rtt is the round trip time to the server. NTP can not really know the offset of a remote chimer, NTP computes it by subtracting rtt/2 from the offset. Plotting the offset±rtt reverses this calculation to more easily see the effects of rtt changes.
Closer to 0s is better. An ideal system would be a horizontal line at 0s. Typical 90% ranges may be: local LAN server 80µs; 90% ranges for WAN server may be 4ms and much larger.
Clock Offset is field 5 in the peerstats log file. The Round Trip Time (rtt) is field 6 in the peerstats log file.
Server Offset 198.23.132.33
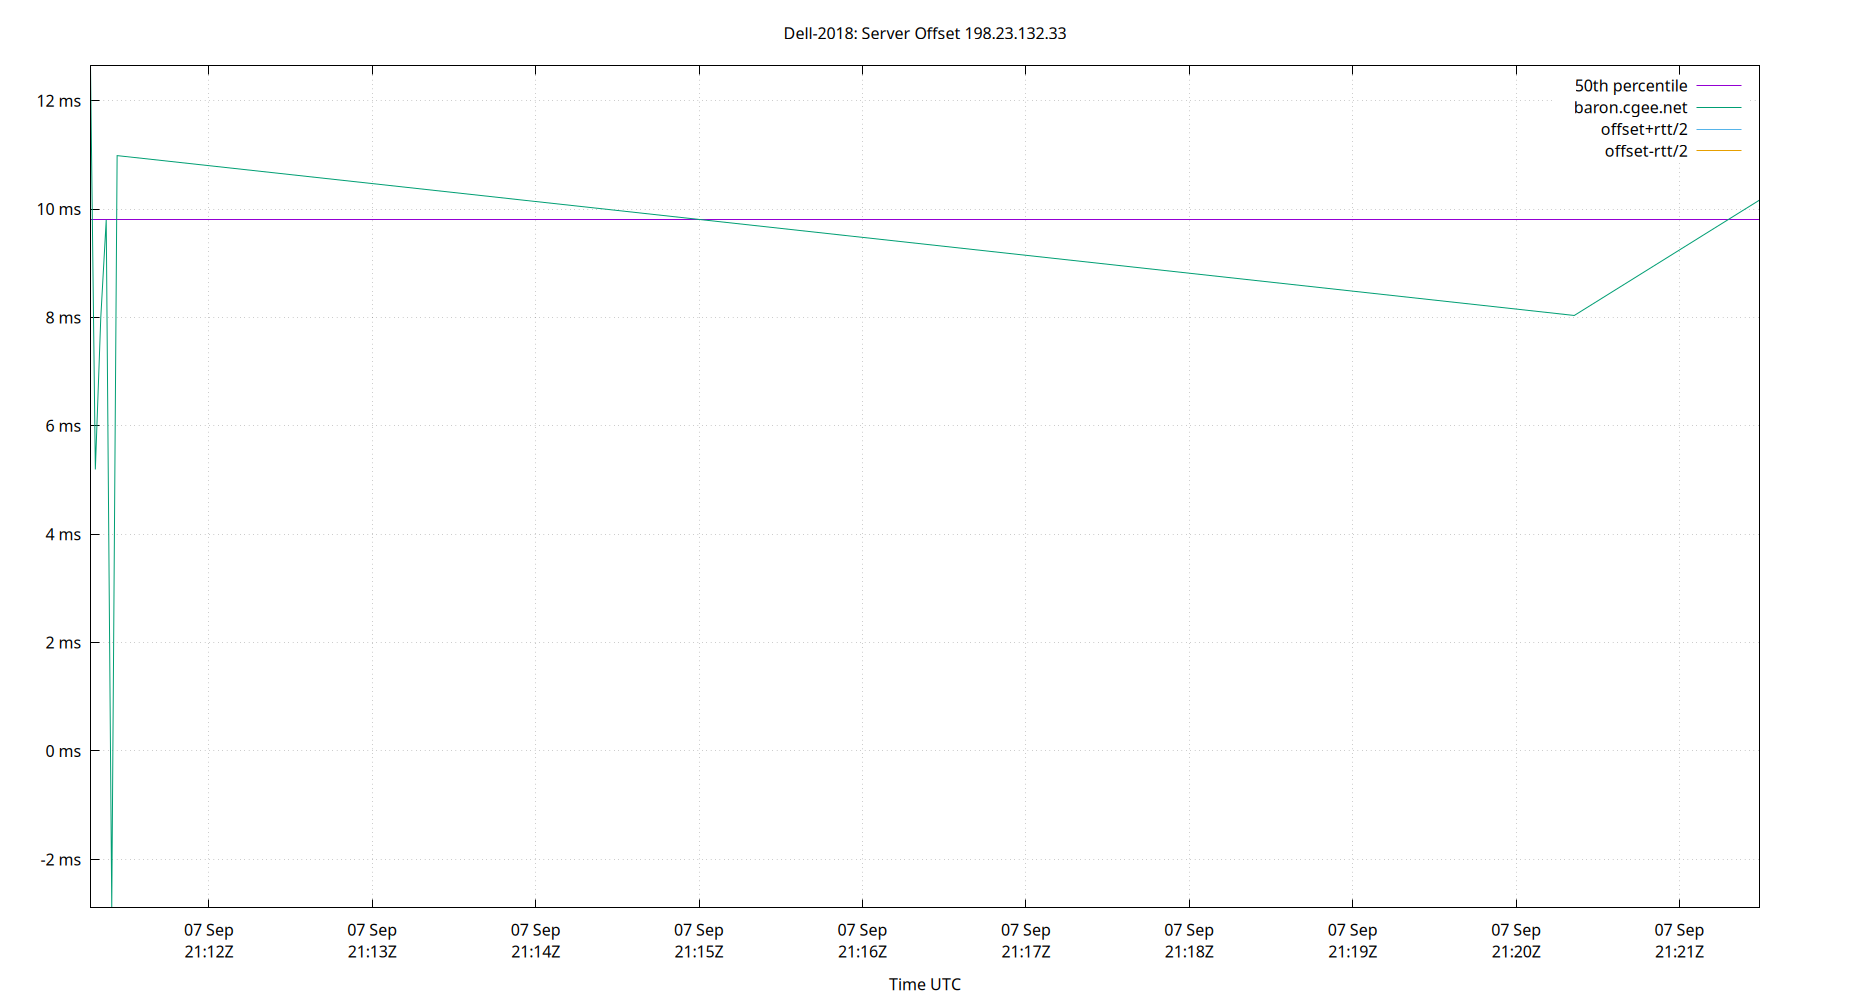
| Percentiles...... | Ranges...... | Skew- | Kurt- | |||||||||||||
| Name | Min | 1% | 5% | 50% | 95% | 99% | Max | 90% | 98% | StdDev | Mean | Units | ness | osis | ||
| Server Offset 198.23.132.33 | -2.897 | -2.897 | -2.897 | 9.802 | 12.642 | 12.642 | 12.642 | 15.539 | 15.539 | 4.534 | 7.741 | ms | -1.402 | 4.019 | ||
The offset of a server in seconds. This is useful to see how the measured offset is behaving.
The chart also plots offset±rtt, where rtt is the round trip time to the server. NTP can not really know the offset of a remote chimer, NTP computes it by subtracting rtt/2 from the offset. Plotting the offset±rtt reverses this calculation to more easily see the effects of rtt changes.
Closer to 0s is better. An ideal system would be a horizontal line at 0s. Typical 90% ranges may be: local LAN server 80µs; 90% ranges for WAN server may be 4ms and much larger.
Clock Offset is field 5 in the peerstats log file. The Round Trip Time (rtt) is field 6 in the peerstats log file.
Server Offset 198.46.254.130

| Percentiles...... | Ranges...... | Skew- | Kurt- | |||||||||||||
| Name | Min | 1% | 5% | 50% | 95% | 99% | Max | 90% | 98% | StdDev | Mean | Units | ness | osis | ||
| Server Offset 198.46.254.130 | -11.109 | -10.105 | -8.900 | -0.000 | 6.524 | 48.594 | 50.250 | 15.424 | 58.699 | 6.597 | 0.210 | ms | 4.556 | 35.9 | ||
The offset of a server in seconds. This is useful to see how the measured offset is behaving.
The chart also plots offset±rtt, where rtt is the round trip time to the server. NTP can not really know the offset of a remote chimer, NTP computes it by subtracting rtt/2 from the offset. Plotting the offset±rtt reverses this calculation to more easily see the effects of rtt changes.
Closer to 0s is better. An ideal system would be a horizontal line at 0s. Typical 90% ranges may be: local LAN server 80µs; 90% ranges for WAN server may be 4ms and much larger.
Clock Offset is field 5 in the peerstats log file. The Round Trip Time (rtt) is field 6 in the peerstats log file.
Server Offset 198.60.22.240

| Percentiles...... | Ranges...... | Skew- | Kurt- | |||||||||||||
| Name | Min | 1% | 5% | 50% | 95% | 99% | Max | 90% | 98% | StdDev | Mean | Units | ness | osis | ||
| Server Offset 198.60.22.240 | -144.129 | -144.129 | -144.129 | 9.541 | 18.010 | 18.010 | 18.010 | 162.140 | 162.140 | 65.641 | -23.178 | ms | -1.269 | 2.625 | ||
The offset of a server in seconds. This is useful to see how the measured offset is behaving.
The chart also plots offset±rtt, where rtt is the round trip time to the server. NTP can not really know the offset of a remote chimer, NTP computes it by subtracting rtt/2 from the offset. Plotting the offset±rtt reverses this calculation to more easily see the effects of rtt changes.
Closer to 0s is better. An ideal system would be a horizontal line at 0s. Typical 90% ranges may be: local LAN server 80µs; 90% ranges for WAN server may be 4ms and much larger.
Clock Offset is field 5 in the peerstats log file. The Round Trip Time (rtt) is field 6 in the peerstats log file.
Server Offset 198.71.50.75

| Percentiles...... | Ranges...... | Skew- | Kurt- | |||||||||||||
| Name | Min | 1% | 5% | 50% | 95% | 99% | Max | 90% | 98% | StdDev | Mean | Units | ness | osis | ||
| Server Offset 198.71.50.75 | -21.461 | -16.971 | -10.397 | -4.651 | -1.037 | 1.083 | 5.931 | 9.360 | 18.054 | 3.141 | -4.906 | ms | -1.601 | 9.855 | ||
The offset of a server in seconds. This is useful to see how the measured offset is behaving.
The chart also plots offset±rtt, where rtt is the round trip time to the server. NTP can not really know the offset of a remote chimer, NTP computes it by subtracting rtt/2 from the offset. Plotting the offset±rtt reverses this calculation to more easily see the effects of rtt changes.
Closer to 0s is better. An ideal system would be a horizontal line at 0s. Typical 90% ranges may be: local LAN server 80µs; 90% ranges for WAN server may be 4ms and much larger.
Clock Offset is field 5 in the peerstats log file. The Round Trip Time (rtt) is field 6 in the peerstats log file.
Server Offset 199.68.201.237

| Percentiles...... | Ranges...... | Skew- | Kurt- | |||||||||||||
| Name | Min | 1% | 5% | 50% | 95% | 99% | Max | 90% | 98% | StdDev | Mean | Units | ness | osis | ||
| Server Offset 199.68.201.237 | -54.221 | -4.457 | -2.342 | 2.245 | 5.491 | 7.434 | 14.187 | 7.833 | 11.890 | 3.323 | 1.891 | ms | -8.342 | 141.8 | ||
The offset of a server in seconds. This is useful to see how the measured offset is behaving.
The chart also plots offset±rtt, where rtt is the round trip time to the server. NTP can not really know the offset of a remote chimer, NTP computes it by subtracting rtt/2 from the offset. Plotting the offset±rtt reverses this calculation to more easily see the effects of rtt changes.
Closer to 0s is better. An ideal system would be a horizontal line at 0s. Typical 90% ranges may be: local LAN server 80µs; 90% ranges for WAN server may be 4ms and much larger.
Clock Offset is field 5 in the peerstats log file. The Round Trip Time (rtt) is field 6 in the peerstats log file.
Server Offset 20.55.26.153

| Percentiles...... | Ranges...... | Skew- | Kurt- | |||||||||||||
| Name | Min | 1% | 5% | 50% | 95% | 99% | Max | 90% | 98% | StdDev | Mean | Units | ness | osis | ||
| Server Offset 20.55.26.153 | -90.128 | -90.128 | -90.128 | 0.419 | 4.026 | 4.026 | 4.026 | 94.154 | 94.154 | 29.373 | -11.273 | ms | -2.13 | 5.815 | ||
The offset of a server in seconds. This is useful to see how the measured offset is behaving.
The chart also plots offset±rtt, where rtt is the round trip time to the server. NTP can not really know the offset of a remote chimer, NTP computes it by subtracting rtt/2 from the offset. Plotting the offset±rtt reverses this calculation to more easily see the effects of rtt changes.
Closer to 0s is better. An ideal system would be a horizontal line at 0s. Typical 90% ranges may be: local LAN server 80µs; 90% ranges for WAN server may be 4ms and much larger.
Clock Offset is field 5 in the peerstats log file. The Round Trip Time (rtt) is field 6 in the peerstats log file.
Server Offset 2001:1600:13:101::16b7

| Percentiles...... | Ranges...... | Skew- | Kurt- | |||||||||||||
| Name | Min | 1% | 5% | 50% | 95% | 99% | Max | 90% | 98% | StdDev | Mean | Units | ness | osis | ||
| Server Offset 2001:1600:13:101::16b7 | -48.803 | -25.492 | -13.939 | -1.873 | 9.982 | 15.177 | 36.277 | 23.921 | 40.669 | 7.350 | -1.722 | ms | -1.042 | 9.167 | ||
The offset of a server in seconds. This is useful to see how the measured offset is behaving.
The chart also plots offset±rtt, where rtt is the round trip time to the server. NTP can not really know the offset of a remote chimer, NTP computes it by subtracting rtt/2 from the offset. Plotting the offset±rtt reverses this calculation to more easily see the effects of rtt changes.
Closer to 0s is better. An ideal system would be a horizontal line at 0s. Typical 90% ranges may be: local LAN server 80µs; 90% ranges for WAN server may be 4ms and much larger.
Clock Offset is field 5 in the peerstats log file. The Round Trip Time (rtt) is field 6 in the peerstats log file.
Server Offset 2001:19f0:1590:5123:1057:a11:da7a:1 (lithium.constant.com)

| Percentiles...... | Ranges...... | Skew- | Kurt- | |||||||||||||
| Name | Min | 1% | 5% | 50% | 95% | 99% | Max | 90% | 98% | StdDev | Mean | Units | ness | osis | ||
| Server Offset 2001:19f0:1590:5123:1057:a11:da7a:1 (lithium.constant.com) | 0.989 | 0.989 | 0.989 | 6.668 | 7.419 | 7.419 | 7.419 | 6.430 | 6.430 | 2.339 | 5.470 | ms | -1.22 | 2.835 | ||
The offset of a server in seconds. This is useful to see how the measured offset is behaving.
The chart also plots offset±rtt, where rtt is the round trip time to the server. NTP can not really know the offset of a remote chimer, NTP computes it by subtracting rtt/2 from the offset. Plotting the offset±rtt reverses this calculation to more easily see the effects of rtt changes.
Closer to 0s is better. An ideal system would be a horizontal line at 0s. Typical 90% ranges may be: local LAN server 80µs; 90% ranges for WAN server may be 4ms and much larger.
Clock Offset is field 5 in the peerstats log file. The Round Trip Time (rtt) is field 6 in the peerstats log file.
Server Offset 2001:19f0:6401:400:5400:4ff:fec3:522a

| Percentiles...... | Ranges...... | Skew- | Kurt- | |||||||||||||
| Name | Min | 1% | 5% | 50% | 95% | 99% | Max | 90% | 98% | StdDev | Mean | Units | ness | osis | ||
| Server Offset 2001:19f0:6401:400:5400:4ff:fec3:522a | 2.311 | 2.311 | 2.311 | 4.048 | 6.282 | 6.282 | 6.282 | 3.971 | 3.971 | 1.514 | 3.891 | ms | 0.635 | 1.891 | ||
The offset of a server in seconds. This is useful to see how the measured offset is behaving.
The chart also plots offset±rtt, where rtt is the round trip time to the server. NTP can not really know the offset of a remote chimer, NTP computes it by subtracting rtt/2 from the offset. Plotting the offset±rtt reverses this calculation to more easily see the effects of rtt changes.
Closer to 0s is better. An ideal system would be a horizontal line at 0s. Typical 90% ranges may be: local LAN server 80µs; 90% ranges for WAN server may be 4ms and much larger.
Clock Offset is field 5 in the peerstats log file. The Round Trip Time (rtt) is field 6 in the peerstats log file.
Server Offset 2001:418:3ff::53 (x.ns.gin.ntt.net)

| Percentiles...... | Ranges...... | Skew- | Kurt- | |||||||||||||
| Name | Min | 1% | 5% | 50% | 95% | 99% | Max | 90% | 98% | StdDev | Mean | Units | ness | osis | ||
| Server Offset 2001:418:3ff::53 (x.ns.gin.ntt.net) | 4.247 | 4.247 | 4.247 | 7.231 | 8.571 | 8.571 | 8.571 | 4.324 | 4.324 | 1.678 | 6.539 | ms | -0.2545 | 1.376 | ||
The offset of a server in seconds. This is useful to see how the measured offset is behaving.
The chart also plots offset±rtt, where rtt is the round trip time to the server. NTP can not really know the offset of a remote chimer, NTP computes it by subtracting rtt/2 from the offset. Plotting the offset±rtt reverses this calculation to more easily see the effects of rtt changes.
Closer to 0s is better. An ideal system would be a horizontal line at 0s. Typical 90% ranges may be: local LAN server 80µs; 90% ranges for WAN server may be 4ms and much larger.
Clock Offset is field 5 in the peerstats log file. The Round Trip Time (rtt) is field 6 in the peerstats log file.
Server Offset 2001:41d0:303:65e9::1

| Percentiles...... | Ranges...... | Skew- | Kurt- | |||||||||||||
| Name | Min | 1% | 5% | 50% | 95% | 99% | Max | 90% | 98% | StdDev | Mean | Units | ness | osis | ||
| Server Offset 2001:41d0:303:65e9::1 | -150.721 | -116.304 | -14.598 | 3.013 | 11.624 | 159.827 | 305.196 | 26.222 | 276.131 | 26.191 | 2.233 | ms | 3.209 | 53 | ||
The offset of a server in seconds. This is useful to see how the measured offset is behaving.
The chart also plots offset±rtt, where rtt is the round trip time to the server. NTP can not really know the offset of a remote chimer, NTP computes it by subtracting rtt/2 from the offset. Plotting the offset±rtt reverses this calculation to more easily see the effects of rtt changes.
Closer to 0s is better. An ideal system would be a horizontal line at 0s. Typical 90% ranges may be: local LAN server 80µs; 90% ranges for WAN server may be 4ms and much larger.
Clock Offset is field 5 in the peerstats log file. The Round Trip Time (rtt) is field 6 in the peerstats log file.
Server Offset 2001:470:1f07:24f::123

| Percentiles...... | Ranges...... | Skew- | Kurt- | |||||||||||||
| Name | Min | 1% | 5% | 50% | 95% | 99% | Max | 90% | 98% | StdDev | Mean | Units | ness | osis | ||
| Server Offset 2001:470:1f07:24f::123 | 5.692 | 5.692 | 5.692 | 8.660 | 52.245 | 52.245 | 52.245 | 46.552 | 46.552 | 15.577 | 16.463 | ms | 1.347 | 3.154 | ||
The offset of a server in seconds. This is useful to see how the measured offset is behaving.
The chart also plots offset±rtt, where rtt is the round trip time to the server. NTP can not really know the offset of a remote chimer, NTP computes it by subtracting rtt/2 from the offset. Plotting the offset±rtt reverses this calculation to more easily see the effects of rtt changes.
Closer to 0s is better. An ideal system would be a horizontal line at 0s. Typical 90% ranges may be: local LAN server 80µs; 90% ranges for WAN server may be 4ms and much larger.
Clock Offset is field 5 in the peerstats log file. The Round Trip Time (rtt) is field 6 in the peerstats log file.
Server Offset 2001:470:a:b4::2 (dell-2018.jamesb912.com.)

| Percentiles...... | Ranges...... | Skew- | Kurt- | |||||||||||||
| Name | Min | 1% | 5% | 50% | 95% | 99% | Max | 90% | 98% | StdDev | Mean | Units | ness | osis | ||
| Server Offset 2001:470:a:b4::2 (dell-2018.jamesb912.com.) | -4.391 | -4.391 | -4.391 | -4.391 | -4.391 | -4.391 | -4.391 | 0.000 | 0.000 | 0.000 | -4.391 | ms | nan | nan | ||
The offset of a server in seconds. This is useful to see how the measured offset is behaving.
The chart also plots offset±rtt, where rtt is the round trip time to the server. NTP can not really know the offset of a remote chimer, NTP computes it by subtracting rtt/2 from the offset. Plotting the offset±rtt reverses this calculation to more easily see the effects of rtt changes.
Closer to 0s is better. An ideal system would be a horizontal line at 0s. Typical 90% ranges may be: local LAN server 80µs; 90% ranges for WAN server may be 4ms and much larger.
Clock Offset is field 5 in the peerstats log file. The Round Trip Time (rtt) is field 6 in the peerstats log file.
Server Offset 2001:4998:c:1028::1001 (t2.time.gq1.yahoo.com)

| Percentiles...... | Ranges...... | Skew- | Kurt- | |||||||||||||
| Name | Min | 1% | 5% | 50% | 95% | 99% | Max | 90% | 98% | StdDev | Mean | Units | ness | osis | ||
| Server Offset 2001:4998:c:1028::1001 (t2.time.gq1.yahoo.com) | -157.180 | 0.965 | 3.243 | 5.473 | 7.719 | 9.995 | 23.242 | 4.475 | 9.030 | 5.538 | 5.305 | ms | -26.07 | 749.2 | ||
The offset of a server in seconds. This is useful to see how the measured offset is behaving.
The chart also plots offset±rtt, where rtt is the round trip time to the server. NTP can not really know the offset of a remote chimer, NTP computes it by subtracting rtt/2 from the offset. Plotting the offset±rtt reverses this calculation to more easily see the effects of rtt changes.
Closer to 0s is better. An ideal system would be a horizontal line at 0s. Typical 90% ranges may be: local LAN server 80µs; 90% ranges for WAN server may be 4ms and much larger.
Clock Offset is field 5 in the peerstats log file. The Round Trip Time (rtt) is field 6 in the peerstats log file.
Server Offset 2001:559:2be:3::1001

| Percentiles...... | Ranges...... | Skew- | Kurt- | |||||||||||||
| Name | Min | 1% | 5% | 50% | 95% | 99% | Max | 90% | 98% | StdDev | Mean | Units | ness | osis | ||
| Server Offset 2001:559:2be:3::1001 | 2.838 | 2.838 | 2.838 | 6.118 | 9.658 | 9.658 | 9.658 | 6.820 | 6.820 | 2.006 | 6.562 | ms | -0.1996 | 2.201 | ||
The offset of a server in seconds. This is useful to see how the measured offset is behaving.
The chart also plots offset±rtt, where rtt is the round trip time to the server. NTP can not really know the offset of a remote chimer, NTP computes it by subtracting rtt/2 from the offset. Plotting the offset±rtt reverses this calculation to more easily see the effects of rtt changes.
Closer to 0s is better. An ideal system would be a horizontal line at 0s. Typical 90% ranges may be: local LAN server 80µs; 90% ranges for WAN server may be 4ms and much larger.
Clock Offset is field 5 in the peerstats log file. The Round Trip Time (rtt) is field 6 in the peerstats log file.
Server Offset 2001:678:8::123 (any.time.nl)

| Percentiles...... | Ranges...... | Skew- | Kurt- | |||||||||||||
| Name | Min | 1% | 5% | 50% | 95% | 99% | Max | 90% | 98% | StdDev | Mean | Units | ness | osis | ||
| Server Offset 2001:678:8::123 (any.time.nl) | -421.375 | -23.078 | -11.859 | -6.575 | -3.251 | -0.150 | 589.234 | 8.607 | 22.927 | 8.794 | -7.106 | ms | 20.66 | 2760 | ||
The offset of a server in seconds. This is useful to see how the measured offset is behaving.
The chart also plots offset±rtt, where rtt is the round trip time to the server. NTP can not really know the offset of a remote chimer, NTP computes it by subtracting rtt/2 from the offset. Plotting the offset±rtt reverses this calculation to more easily see the effects of rtt changes.
Closer to 0s is better. An ideal system would be a horizontal line at 0s. Typical 90% ranges may be: local LAN server 80µs; 90% ranges for WAN server may be 4ms and much larger.
Clock Offset is field 5 in the peerstats log file. The Round Trip Time (rtt) is field 6 in the peerstats log file.
Server Offset 204.2.134.173

| Percentiles...... | Ranges...... | Skew- | Kurt- | |||||||||||||
| Name | Min | 1% | 5% | 50% | 95% | 99% | Max | 90% | 98% | StdDev | Mean | Units | ness | osis | ||
| Server Offset 204.2.134.173 | -330.587 | -1.995 | 0.505 | 4.402 | 7.005 | 7.870 | 8.684 | 6.500 | 9.866 | 24.915 | 2.289 | ms | -13.06 | 173.8 | ||
The offset of a server in seconds. This is useful to see how the measured offset is behaving.
The chart also plots offset±rtt, where rtt is the round trip time to the server. NTP can not really know the offset of a remote chimer, NTP computes it by subtracting rtt/2 from the offset. Plotting the offset±rtt reverses this calculation to more easily see the effects of rtt changes.
Closer to 0s is better. An ideal system would be a horizontal line at 0s. Typical 90% ranges may be: local LAN server 80µs; 90% ranges for WAN server may be 4ms and much larger.
Clock Offset is field 5 in the peerstats log file. The Round Trip Time (rtt) is field 6 in the peerstats log file.
Server Offset 206.210.192.99

| Percentiles...... | Ranges...... | Skew- | Kurt- | |||||||||||||
| Name | Min | 1% | 5% | 50% | 95% | 99% | Max | 90% | 98% | StdDev | Mean | Units | ness | osis | ||
| Server Offset 206.210.192.99 | 3.732 | 3.732 | 3.732 | 10.882 | 12.986 | 12.986 | 12.986 | 9.255 | 9.255 | 2.868 | 9.737 | ms | -0.9345 | 2.785 | ||
The offset of a server in seconds. This is useful to see how the measured offset is behaving.
The chart also plots offset±rtt, where rtt is the round trip time to the server. NTP can not really know the offset of a remote chimer, NTP computes it by subtracting rtt/2 from the offset. Plotting the offset±rtt reverses this calculation to more easily see the effects of rtt changes.
Closer to 0s is better. An ideal system would be a horizontal line at 0s. Typical 90% ranges may be: local LAN server 80µs; 90% ranges for WAN server may be 4ms and much larger.
Clock Offset is field 5 in the peerstats log file. The Round Trip Time (rtt) is field 6 in the peerstats log file.
Server Offset 207.244.103.95
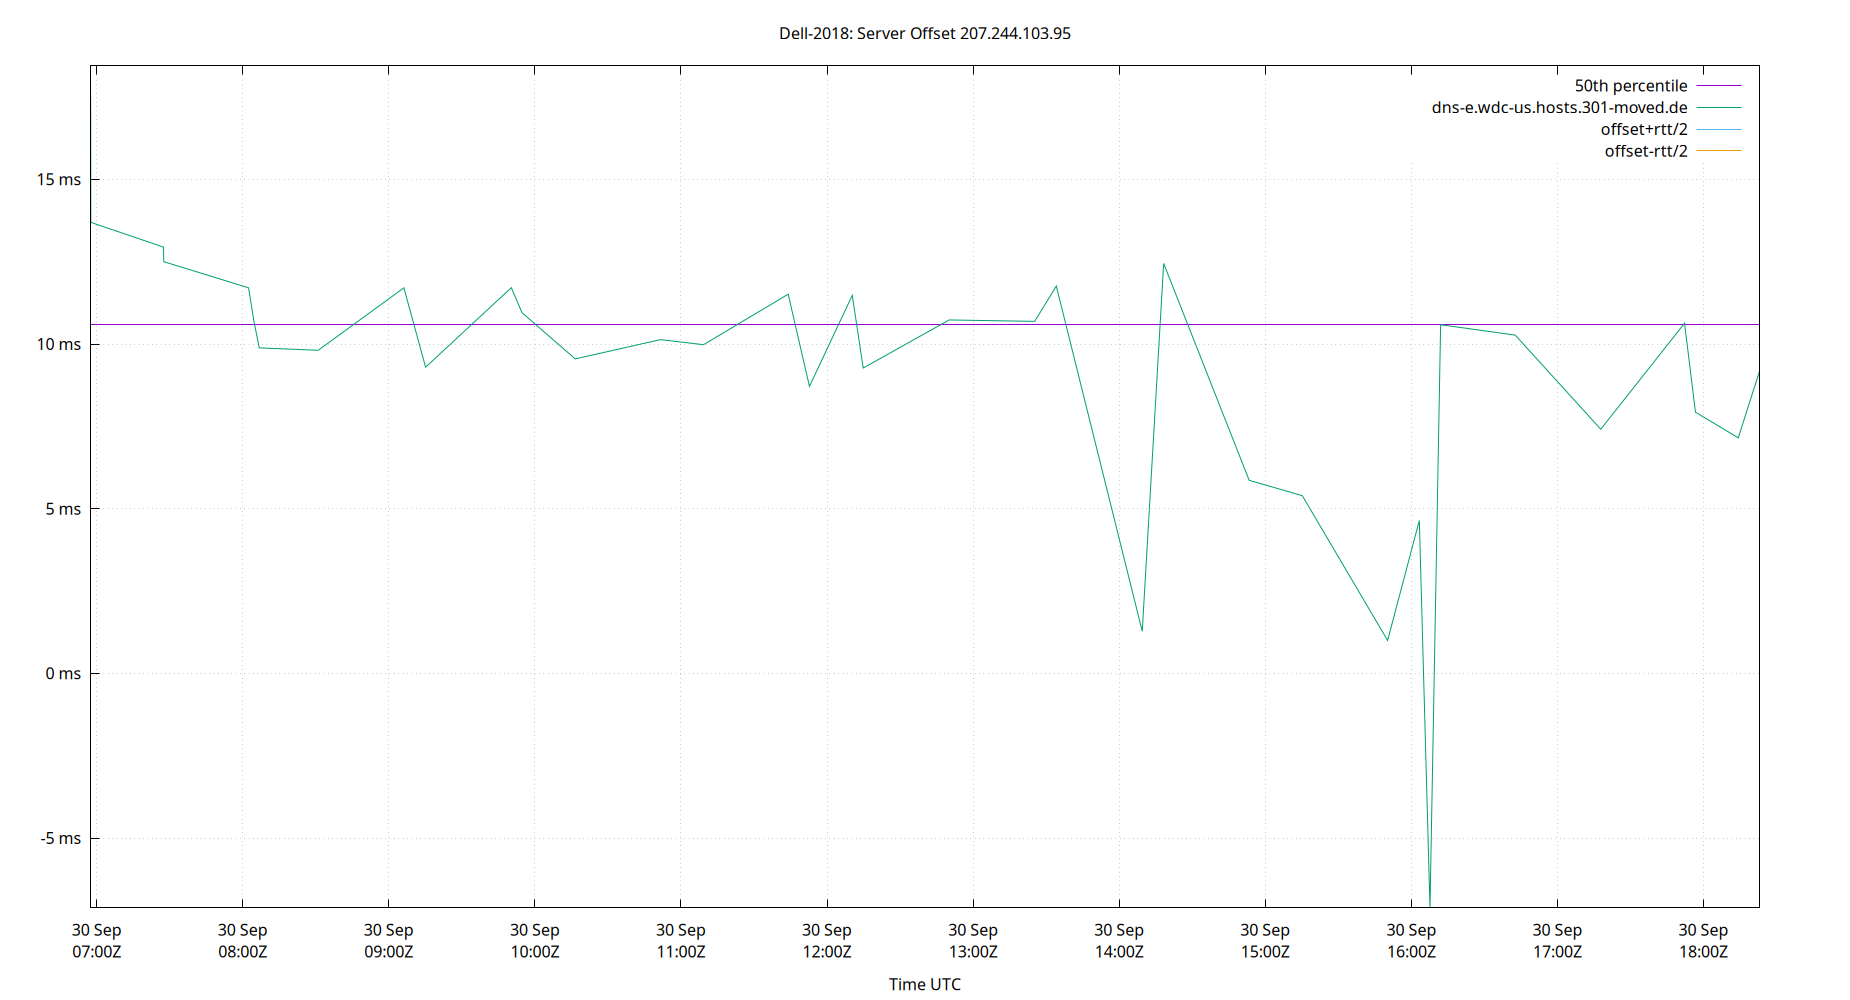
| Percentiles...... | Ranges...... | Skew- | Kurt- | |||||||||||||
| Name | Min | 1% | 5% | 50% | 95% | 99% | Max | 90% | 98% | StdDev | Mean | Units | ness | osis | ||
| Server Offset 207.244.103.95 | -7.124 | -7.124 | 0.999 | 10.585 | 17.648 | 18.445 | 18.445 | 16.649 | 25.569 | 4.483 | 9.686 | ms | -1.342 | 6.812 | ||
The offset of a server in seconds. This is useful to see how the measured offset is behaving.
The chart also plots offset±rtt, where rtt is the round trip time to the server. NTP can not really know the offset of a remote chimer, NTP computes it by subtracting rtt/2 from the offset. Plotting the offset±rtt reverses this calculation to more easily see the effects of rtt changes.
Closer to 0s is better. An ideal system would be a horizontal line at 0s. Typical 90% ranges may be: local LAN server 80µs; 90% ranges for WAN server may be 4ms and much larger.
Clock Offset is field 5 in the peerstats log file. The Round Trip Time (rtt) is field 6 in the peerstats log file.
Server Offset 208.113.130.146

| Percentiles...... | Ranges...... | Skew- | Kurt- | |||||||||||||
| Name | Min | 1% | 5% | 50% | 95% | 99% | Max | 90% | 98% | StdDev | Mean | Units | ness | osis | ||
| Server Offset 208.113.130.146 | -3.011 | -0.930 | 0.782 | 4.158 | 6.717 | 8.251 | 10.594 | 5.936 | 9.181 | 1.878 | 3.976 | ms | -0.3391 | 3.503 | ||
The offset of a server in seconds. This is useful to see how the measured offset is behaving.
The chart also plots offset±rtt, where rtt is the round trip time to the server. NTP can not really know the offset of a remote chimer, NTP computes it by subtracting rtt/2 from the offset. Plotting the offset±rtt reverses this calculation to more easily see the effects of rtt changes.
Closer to 0s is better. An ideal system would be a horizontal line at 0s. Typical 90% ranges may be: local LAN server 80µs; 90% ranges for WAN server may be 4ms and much larger.
Clock Offset is field 5 in the peerstats log file. The Round Trip Time (rtt) is field 6 in the peerstats log file.
Server Offset 208.70.148.101
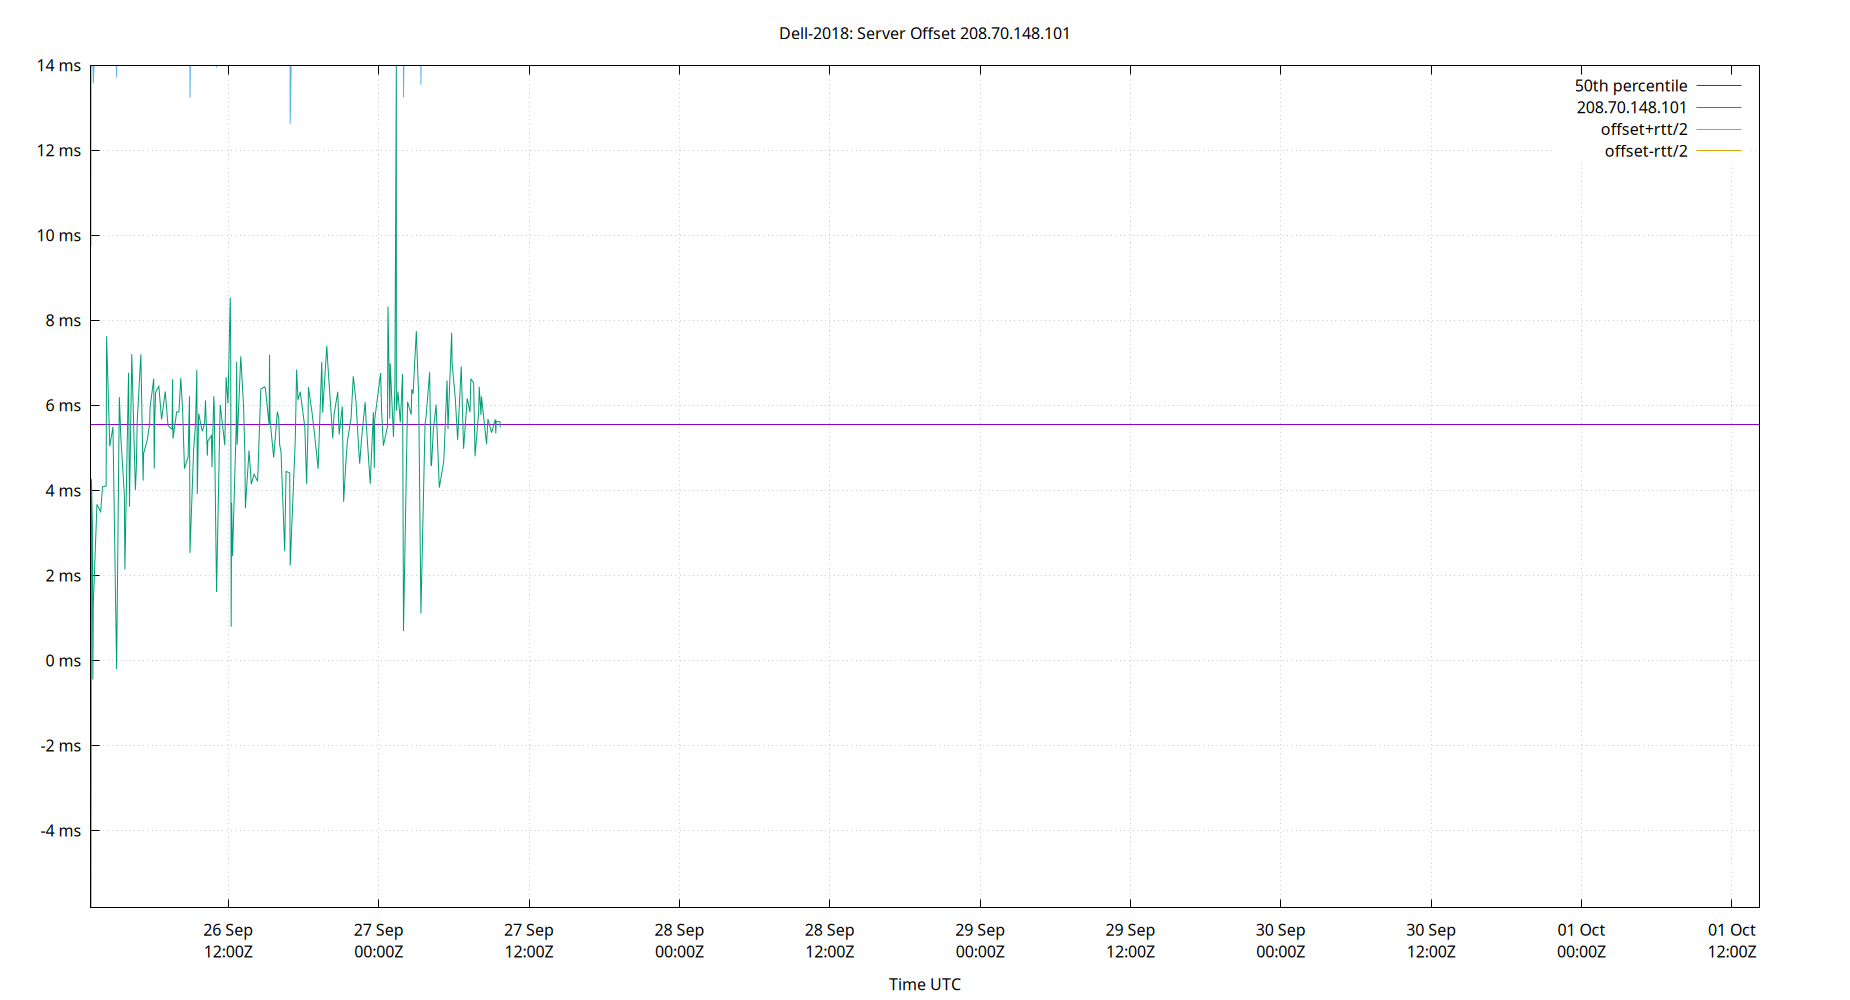
| Percentiles...... | Ranges...... | Skew- | Kurt- | |||||||||||||
| Name | Min | 1% | 5% | 50% | 95% | 99% | Max | 90% | 98% | StdDev | Mean | Units | ness | osis | ||
| Server Offset 208.70.148.101 | -5.820 | -0.448 | 1.316 | 5.542 | 7.187 | 8.320 | 13.983 | 5.871 | 8.768 | 1.888 | 5.190 | ms | -1.4 | 11.05 | ||
The offset of a server in seconds. This is useful to see how the measured offset is behaving.
The chart also plots offset±rtt, where rtt is the round trip time to the server. NTP can not really know the offset of a remote chimer, NTP computes it by subtracting rtt/2 from the offset. Plotting the offset±rtt reverses this calculation to more easily see the effects of rtt changes.
Closer to 0s is better. An ideal system would be a horizontal line at 0s. Typical 90% ranges may be: local LAN server 80µs; 90% ranges for WAN server may be 4ms and much larger.
Clock Offset is field 5 in the peerstats log file. The Round Trip Time (rtt) is field 6 in the peerstats log file.
Server Offset 209.177.158.85

| Percentiles...... | Ranges...... | Skew- | Kurt- | |||||||||||||
| Name | Min | 1% | 5% | 50% | 95% | 99% | Max | 90% | 98% | StdDev | Mean | Units | ness | osis | ||
| Server Offset 209.177.158.85 | -30.375 | -4.642 | -3.180 | 0.545 | 5.452 | 6.644 | 15.829 | 8.632 | 11.286 | 3.226 | 0.948 | ms | -2.144 | 24.9 | ||
The offset of a server in seconds. This is useful to see how the measured offset is behaving.
The chart also plots offset±rtt, where rtt is the round trip time to the server. NTP can not really know the offset of a remote chimer, NTP computes it by subtracting rtt/2 from the offset. Plotting the offset±rtt reverses this calculation to more easily see the effects of rtt changes.
Closer to 0s is better. An ideal system would be a horizontal line at 0s. Typical 90% ranges may be: local LAN server 80µs; 90% ranges for WAN server may be 4ms and much larger.
Clock Offset is field 5 in the peerstats log file. The Round Trip Time (rtt) is field 6 in the peerstats log file.
Server Offset 209.205.228.50
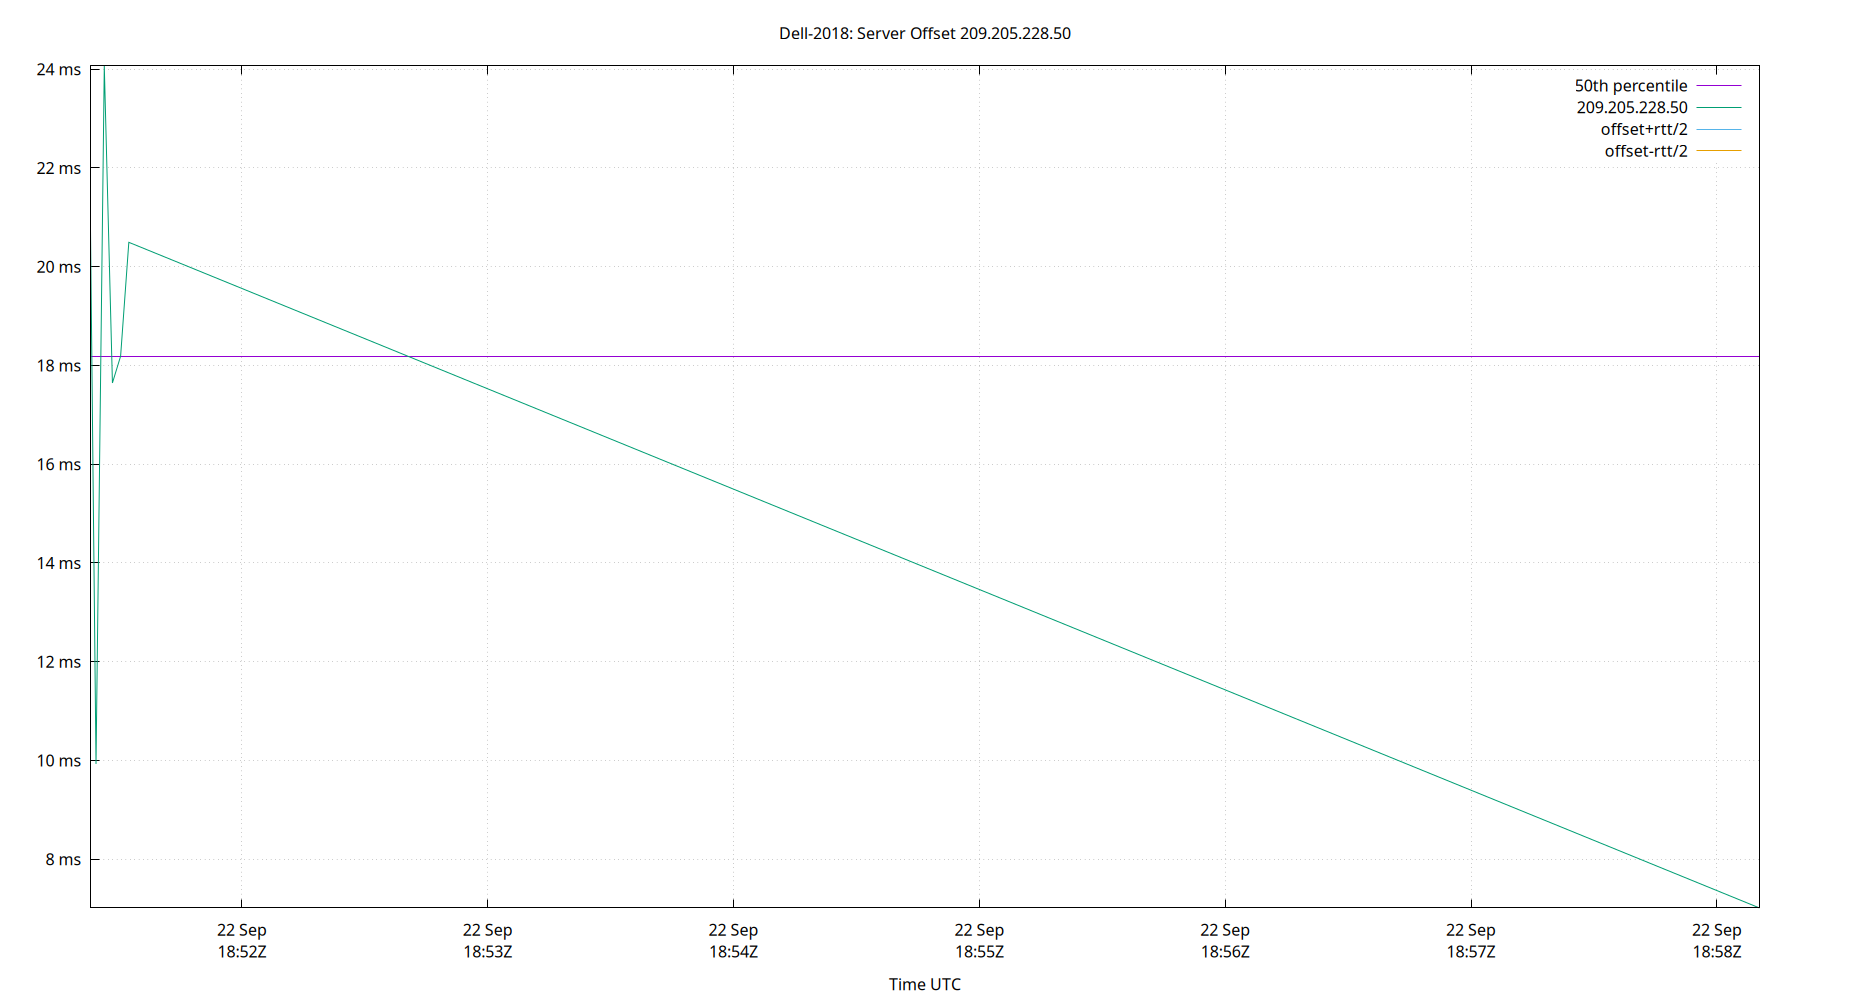
| Percentiles...... | Ranges...... | Skew- | Kurt- | |||||||||||||
| Name | Min | 1% | 5% | 50% | 95% | 99% | Max | 90% | 98% | StdDev | Mean | Units | ness | osis | ||
| Server Offset 209.205.228.50 | 7.010 | 7.010 | 7.010 | 18.187 | 24.067 | 24.067 | 24.067 | 17.057 | 17.057 | 5.704 | 16.869 | ms | -0.6241 | 2.005 | ||
The offset of a server in seconds. This is useful to see how the measured offset is behaving.
The chart also plots offset±rtt, where rtt is the round trip time to the server. NTP can not really know the offset of a remote chimer, NTP computes it by subtracting rtt/2 from the offset. Plotting the offset±rtt reverses this calculation to more easily see the effects of rtt changes.
Closer to 0s is better. An ideal system would be a horizontal line at 0s. Typical 90% ranges may be: local LAN server 80µs; 90% ranges for WAN server may be 4ms and much larger.
Clock Offset is field 5 in the peerstats log file. The Round Trip Time (rtt) is field 6 in the peerstats log file.
Server Offset 209.253.210.112
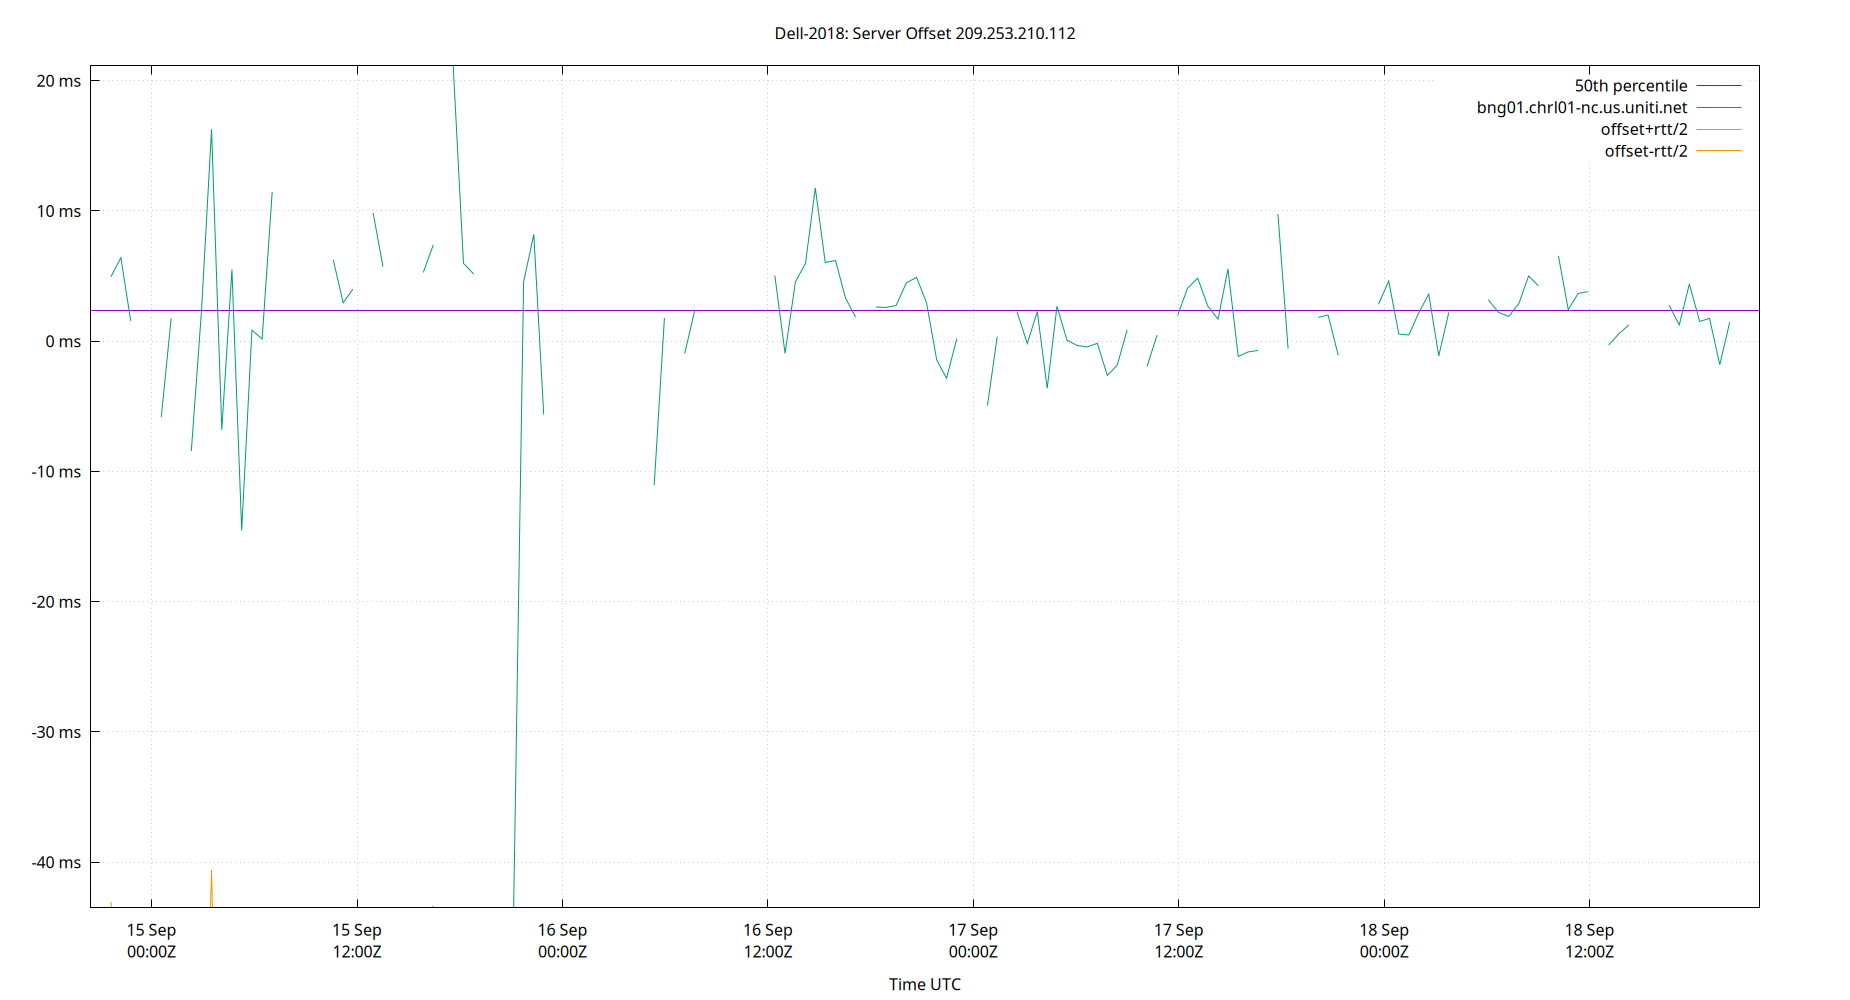
| Percentiles...... | Ranges...... | Skew- | Kurt- | |||||||||||||
| Name | Min | 1% | 5% | 50% | 95% | 99% | Max | 90% | 98% | StdDev | Mean | Units | ness | osis | ||
| Server Offset 209.253.210.112 | -43.512 | -14.756 | -5.824 | 2.424 | 9.845 | 16.262 | 21.137 | 15.669 | 31.017 | 6.264 | 2.033 | ms | -3.022 | 24.48 | ||
The offset of a server in seconds. This is useful to see how the measured offset is behaving.
The chart also plots offset±rtt, where rtt is the round trip time to the server. NTP can not really know the offset of a remote chimer, NTP computes it by subtracting rtt/2 from the offset. Plotting the offset±rtt reverses this calculation to more easily see the effects of rtt changes.
Closer to 0s is better. An ideal system would be a horizontal line at 0s. Typical 90% ranges may be: local LAN server 80µs; 90% ranges for WAN server may be 4ms and much larger.
Clock Offset is field 5 in the peerstats log file. The Round Trip Time (rtt) is field 6 in the peerstats log file.
Server Offset 209.51.161.238
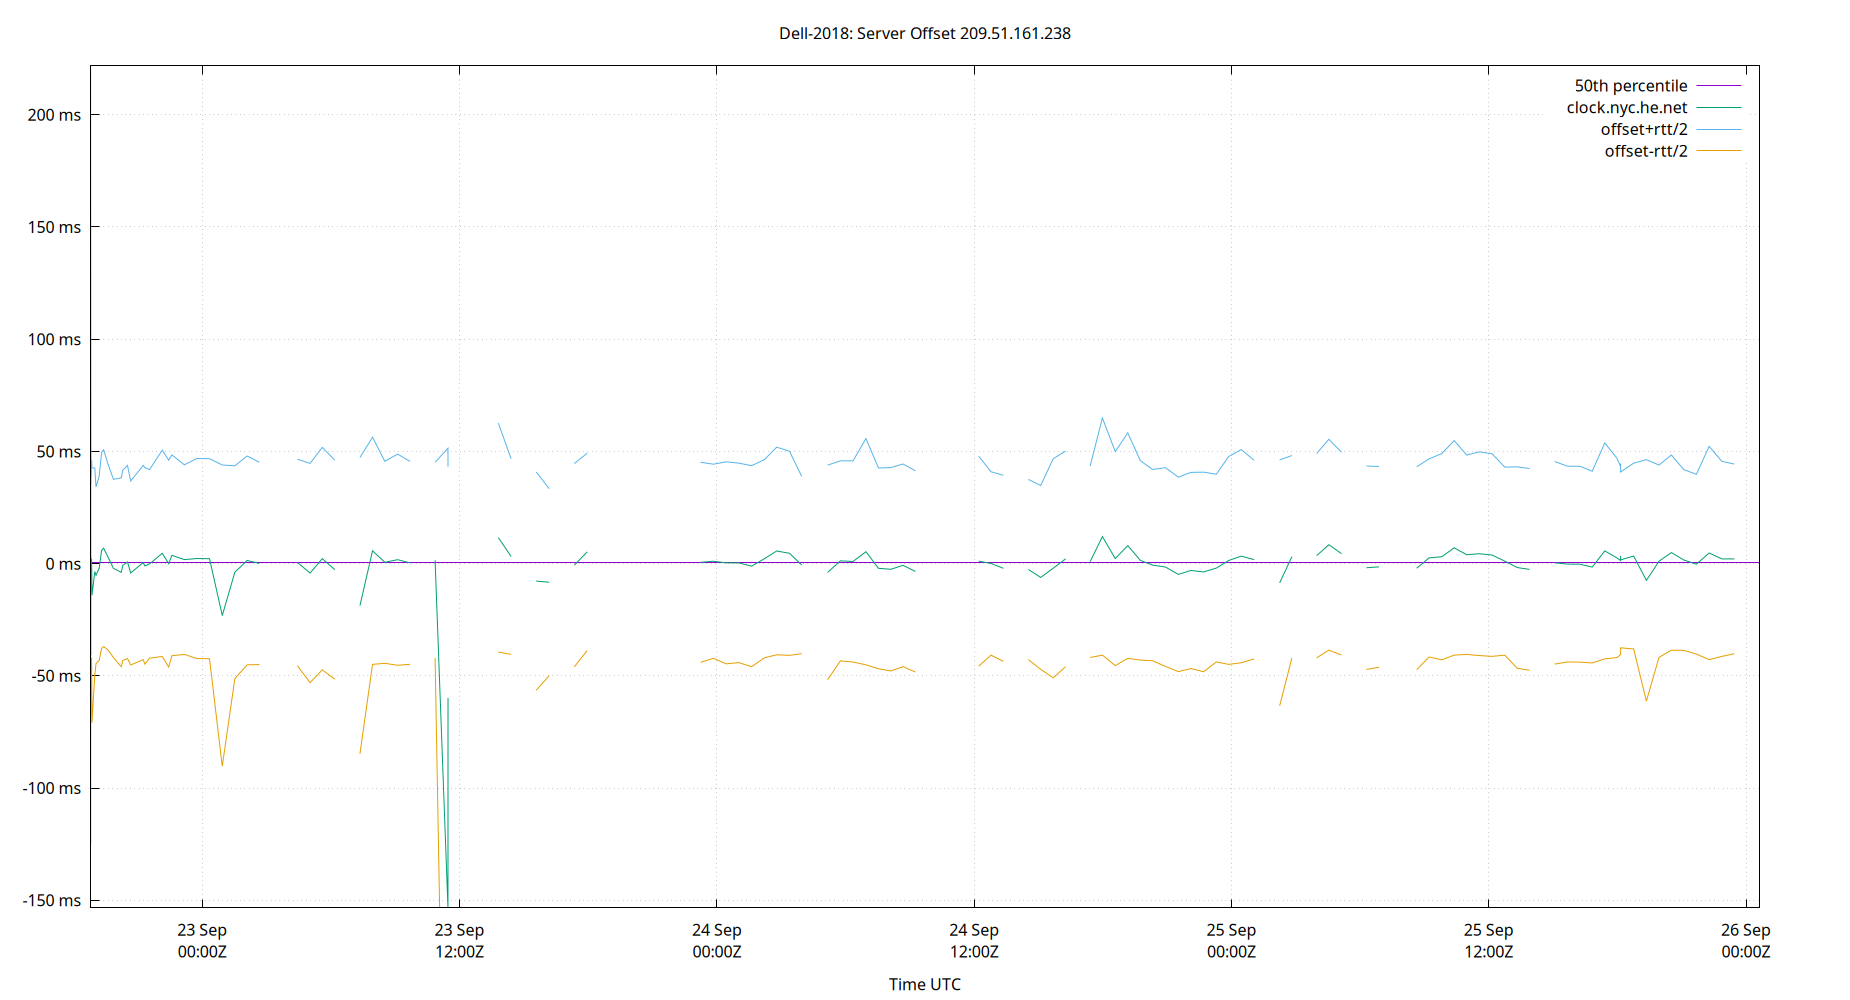
| Percentiles...... | Ranges...... | Skew- | Kurt- | |||||||||||||
| Name | Min | 1% | 5% | 50% | 95% | 99% | Max | 90% | 98% | StdDev | Mean | Units | ness | osis | ||
| Server Offset 209.51.161.238 | -153.422 | -127.019 | -23.151 | 0.591 | 8.422 | 219.405 | 221.766 | 31.573 | 346.425 | 38.719 | 1.412 | ms | 3.117 | 25.69 | ||
The offset of a server in seconds. This is useful to see how the measured offset is behaving.
The chart also plots offset±rtt, where rtt is the round trip time to the server. NTP can not really know the offset of a remote chimer, NTP computes it by subtracting rtt/2 from the offset. Plotting the offset±rtt reverses this calculation to more easily see the effects of rtt changes.
Closer to 0s is better. An ideal system would be a horizontal line at 0s. Typical 90% ranges may be: local LAN server 80µs; 90% ranges for WAN server may be 4ms and much larger.
Clock Offset is field 5 in the peerstats log file. The Round Trip Time (rtt) is field 6 in the peerstats log file.
Server Offset 212.227.240.160

| Percentiles...... | Ranges...... | Skew- | Kurt- | |||||||||||||
| Name | Min | 1% | 5% | 50% | 95% | 99% | Max | 90% | 98% | StdDev | Mean | Units | ness | osis | ||
| Server Offset 212.227.240.160 | -12.742 | -12.742 | -4.033 | -0.067 | 6.879 | 8.150 | 8.150 | 10.912 | 20.892 | 3.698 | 0.090 | ms | -0.4662 | 4.896 | ||
The offset of a server in seconds. This is useful to see how the measured offset is behaving.
The chart also plots offset±rtt, where rtt is the round trip time to the server. NTP can not really know the offset of a remote chimer, NTP computes it by subtracting rtt/2 from the offset. Plotting the offset±rtt reverses this calculation to more easily see the effects of rtt changes.
Closer to 0s is better. An ideal system would be a horizontal line at 0s. Typical 90% ranges may be: local LAN server 80µs; 90% ranges for WAN server may be 4ms and much larger.
Clock Offset is field 5 in the peerstats log file. The Round Trip Time (rtt) is field 6 in the peerstats log file.
Server Offset 213.108.170.26
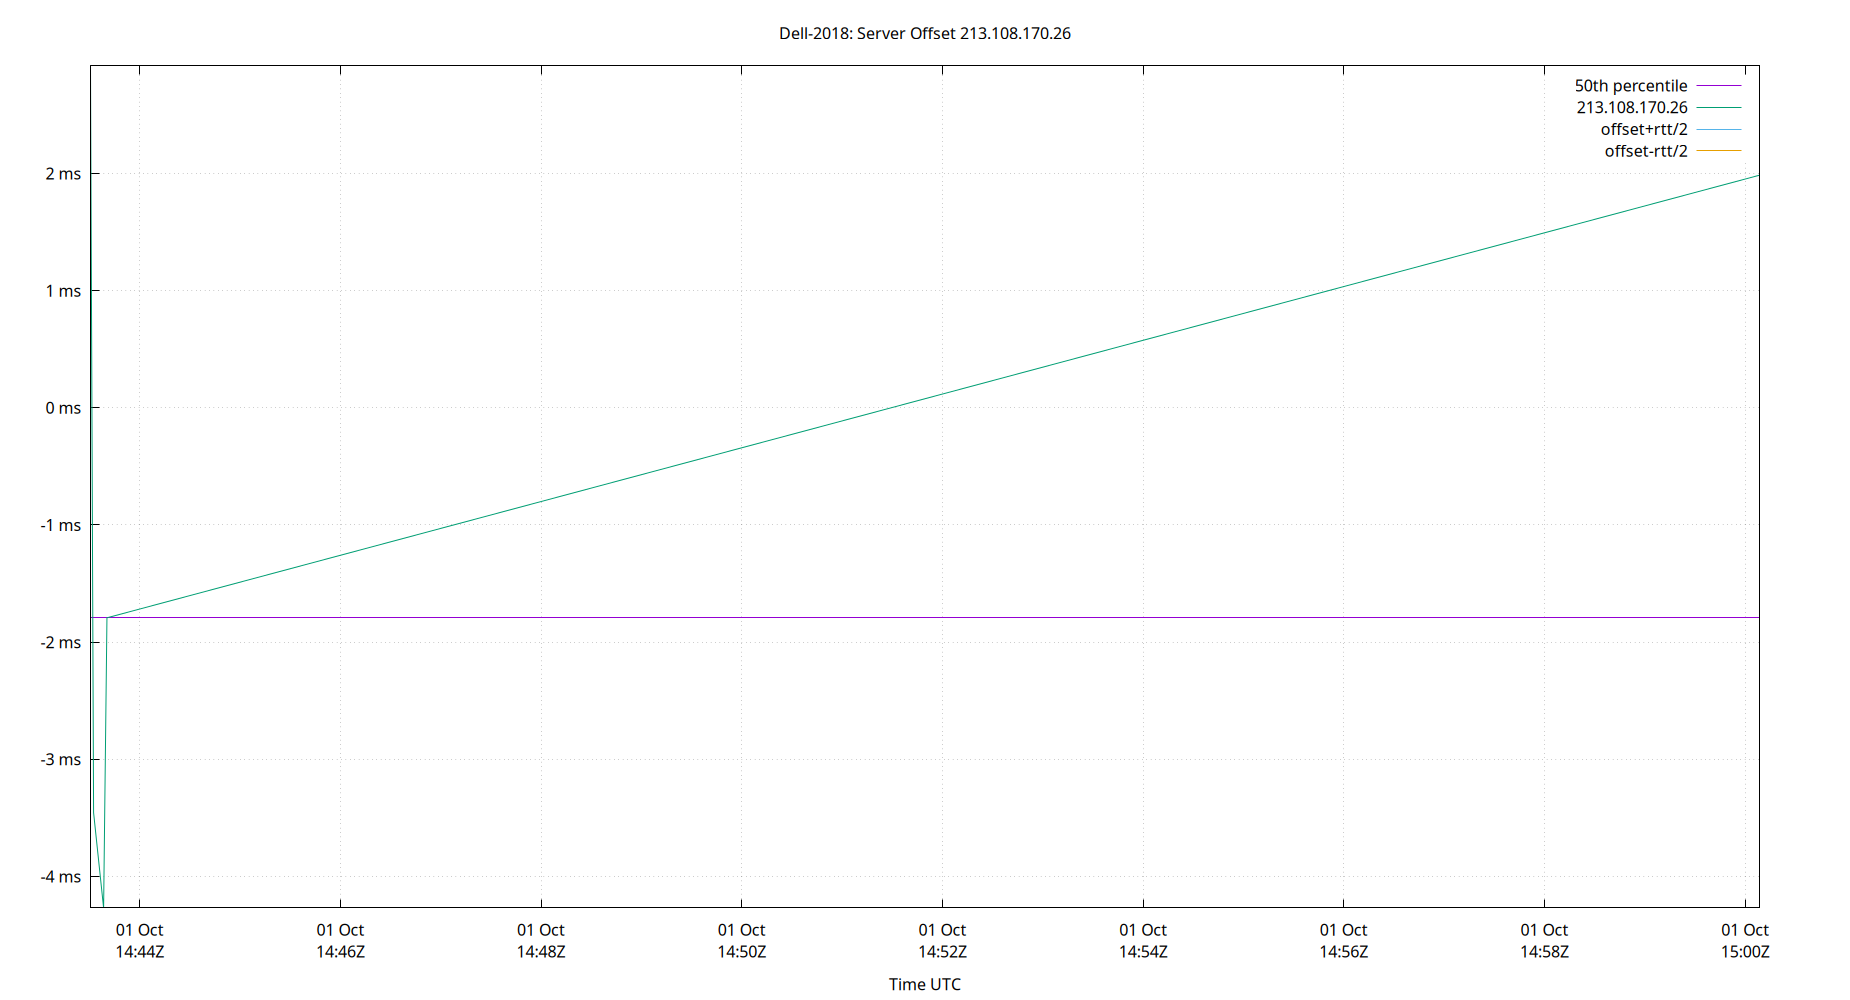
| Percentiles...... | Ranges...... | Skew- | Kurt- | |||||||||||||
| Name | Min | 1% | 5% | 50% | 95% | 99% | Max | 90% | 98% | StdDev | Mean | Units | ness | osis | ||
| Server Offset 213.108.170.26 | -4.269 | -4.269 | -4.269 | -1.792 | 2.919 | 2.919 | 2.919 | 7.189 | 7.189 | 2.884 | -0.922 | ms | 0.2241 | 1.32 | ||
The offset of a server in seconds. This is useful to see how the measured offset is behaving.
The chart also plots offset±rtt, where rtt is the round trip time to the server. NTP can not really know the offset of a remote chimer, NTP computes it by subtracting rtt/2 from the offset. Plotting the offset±rtt reverses this calculation to more easily see the effects of rtt changes.
Closer to 0s is better. An ideal system would be a horizontal line at 0s. Typical 90% ranges may be: local LAN server 80µs; 90% ranges for WAN server may be 4ms and much larger.
Clock Offset is field 5 in the peerstats log file. The Round Trip Time (rtt) is field 6 in the peerstats log file.
Server Offset 216.229.0.50
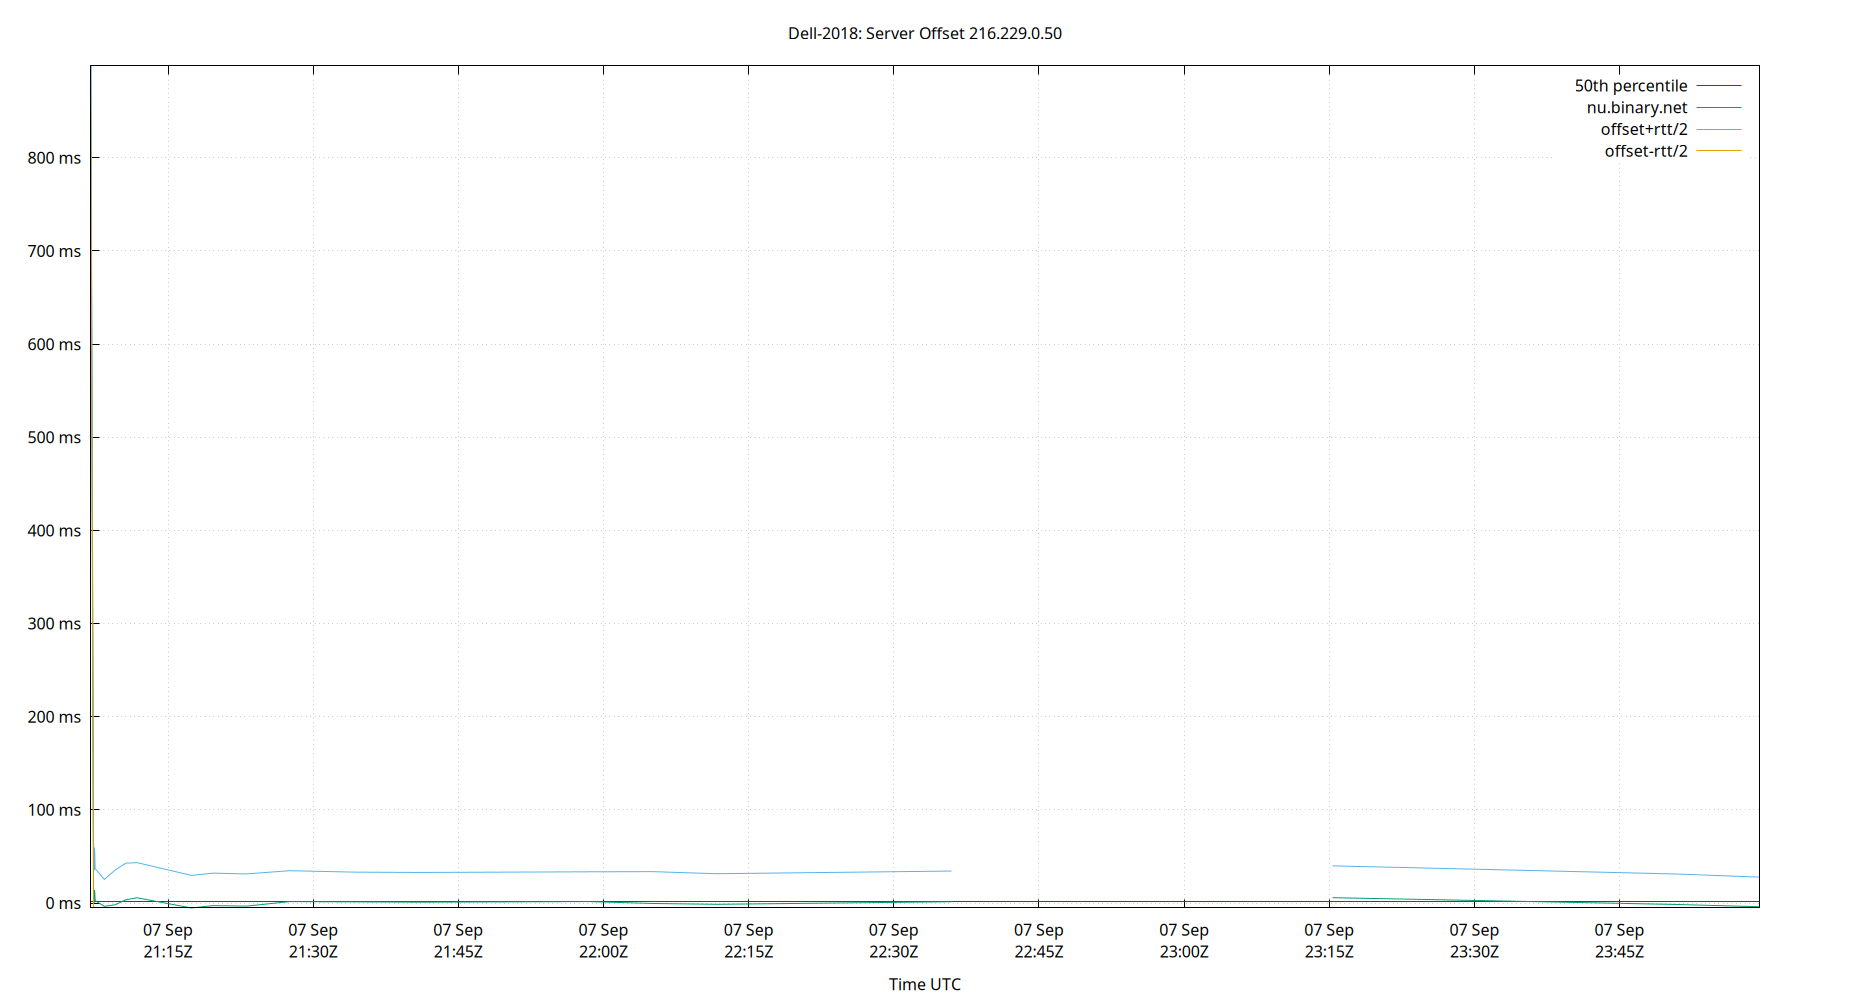
| Percentiles...... | Ranges...... | Skew- | Kurt- | |||||||||||||
| Name | Min | 1% | 5% | 50% | 95% | 99% | Max | 90% | 98% | StdDev | Mean | Units | ness | osis | ||
| Server Offset 216.229.0.50 | -5.338 | -5.338 | -4.006 | 1.384 | 897.146 | 898.740 | 898.740 | 901.151 | 904.079 | 243.079 | 73.841 | ms | 3.093 | 10.58 | ||
The offset of a server in seconds. This is useful to see how the measured offset is behaving.
The chart also plots offset±rtt, where rtt is the round trip time to the server. NTP can not really know the offset of a remote chimer, NTP computes it by subtracting rtt/2 from the offset. Plotting the offset±rtt reverses this calculation to more easily see the effects of rtt changes.
Closer to 0s is better. An ideal system would be a horizontal line at 0s. Typical 90% ranges may be: local LAN server 80µs; 90% ranges for WAN server may be 4ms and much larger.
Clock Offset is field 5 in the peerstats log file. The Round Trip Time (rtt) is field 6 in the peerstats log file.
Server Offset 216.229.4.66

| Percentiles...... | Ranges...... | Skew- | Kurt- | |||||||||||||
| Name | Min | 1% | 5% | 50% | 95% | 99% | Max | 90% | 98% | StdDev | Mean | Units | ness | osis | ||
| Server Offset 216.229.4.66 | -17.026 | -11.524 | -4.993 | 0.122 | 5.823 | 10.083 | 13.185 | 10.816 | 21.607 | 4.073 | 0.504 | ms | -0.5136 | 4.899 | ||
The offset of a server in seconds. This is useful to see how the measured offset is behaving.
The chart also plots offset±rtt, where rtt is the round trip time to the server. NTP can not really know the offset of a remote chimer, NTP computes it by subtracting rtt/2 from the offset. Plotting the offset±rtt reverses this calculation to more easily see the effects of rtt changes.
Closer to 0s is better. An ideal system would be a horizontal line at 0s. Typical 90% ranges may be: local LAN server 80µs; 90% ranges for WAN server may be 4ms and much larger.
Clock Offset is field 5 in the peerstats log file. The Round Trip Time (rtt) is field 6 in the peerstats log file.
Server Offset 216.250.115.174

| Percentiles...... | Ranges...... | Skew- | Kurt- | |||||||||||||
| Name | Min | 1% | 5% | 50% | 95% | 99% | Max | 90% | 98% | StdDev | Mean | Units | ness | osis | ||
| Server Offset 216.250.115.174 | -50.737 | -41.571 | -23.334 | -12.434 | -0.066 | 364.314 | 369.510 | 23.268 | 405.885 | 47.821 | -6.497 | ms | 7.428 | 58.12 | ||
The offset of a server in seconds. This is useful to see how the measured offset is behaving.
The chart also plots offset±rtt, where rtt is the round trip time to the server. NTP can not really know the offset of a remote chimer, NTP computes it by subtracting rtt/2 from the offset. Plotting the offset±rtt reverses this calculation to more easily see the effects of rtt changes.
Closer to 0s is better. An ideal system would be a horizontal line at 0s. Typical 90% ranges may be: local LAN server 80µs; 90% ranges for WAN server may be 4ms and much larger.
Clock Offset is field 5 in the peerstats log file. The Round Trip Time (rtt) is field 6 in the peerstats log file.
Server Offset 216.66.48.42

| Percentiles...... | Ranges...... | Skew- | Kurt- | |||||||||||||
| Name | Min | 1% | 5% | 50% | 95% | 99% | Max | 90% | 98% | StdDev | Mean | Units | ness | osis | ||
| Server Offset 216.66.48.42 | -57.714 | -48.968 | -41.803 | -10.099 | 4.232 | 45.537 | 48.178 | 46.035 | 94.505 | 15.518 | -12.901 | ms | 0.07764 | 5.238 | ||
The offset of a server in seconds. This is useful to see how the measured offset is behaving.
The chart also plots offset±rtt, where rtt is the round trip time to the server. NTP can not really know the offset of a remote chimer, NTP computes it by subtracting rtt/2 from the offset. Plotting the offset±rtt reverses this calculation to more easily see the effects of rtt changes.
Closer to 0s is better. An ideal system would be a horizontal line at 0s. Typical 90% ranges may be: local LAN server 80µs; 90% ranges for WAN server may be 4ms and much larger.
Clock Offset is field 5 in the peerstats log file. The Round Trip Time (rtt) is field 6 in the peerstats log file.
Server Offset 216.82.35.115

| Percentiles...... | Ranges...... | Skew- | Kurt- | |||||||||||||
| Name | Min | 1% | 5% | 50% | 95% | 99% | Max | 90% | 98% | StdDev | Mean | Units | ness | osis | ||
| Server Offset 216.82.35.115 | -29.297 | -29.297 | -9.388 | -1.589 | 392.815 | 392.815 | 392.815 | 402.203 | 422.112 | 140.650 | 54.907 | ms | 1.952 | 4.828 | ||
The offset of a server in seconds. This is useful to see how the measured offset is behaving.
The chart also plots offset±rtt, where rtt is the round trip time to the server. NTP can not really know the offset of a remote chimer, NTP computes it by subtracting rtt/2 from the offset. Plotting the offset±rtt reverses this calculation to more easily see the effects of rtt changes.
Closer to 0s is better. An ideal system would be a horizontal line at 0s. Typical 90% ranges may be: local LAN server 80µs; 90% ranges for WAN server may be 4ms and much larger.
Clock Offset is field 5 in the peerstats log file. The Round Trip Time (rtt) is field 6 in the peerstats log file.
Server Offset 217.197.83.230
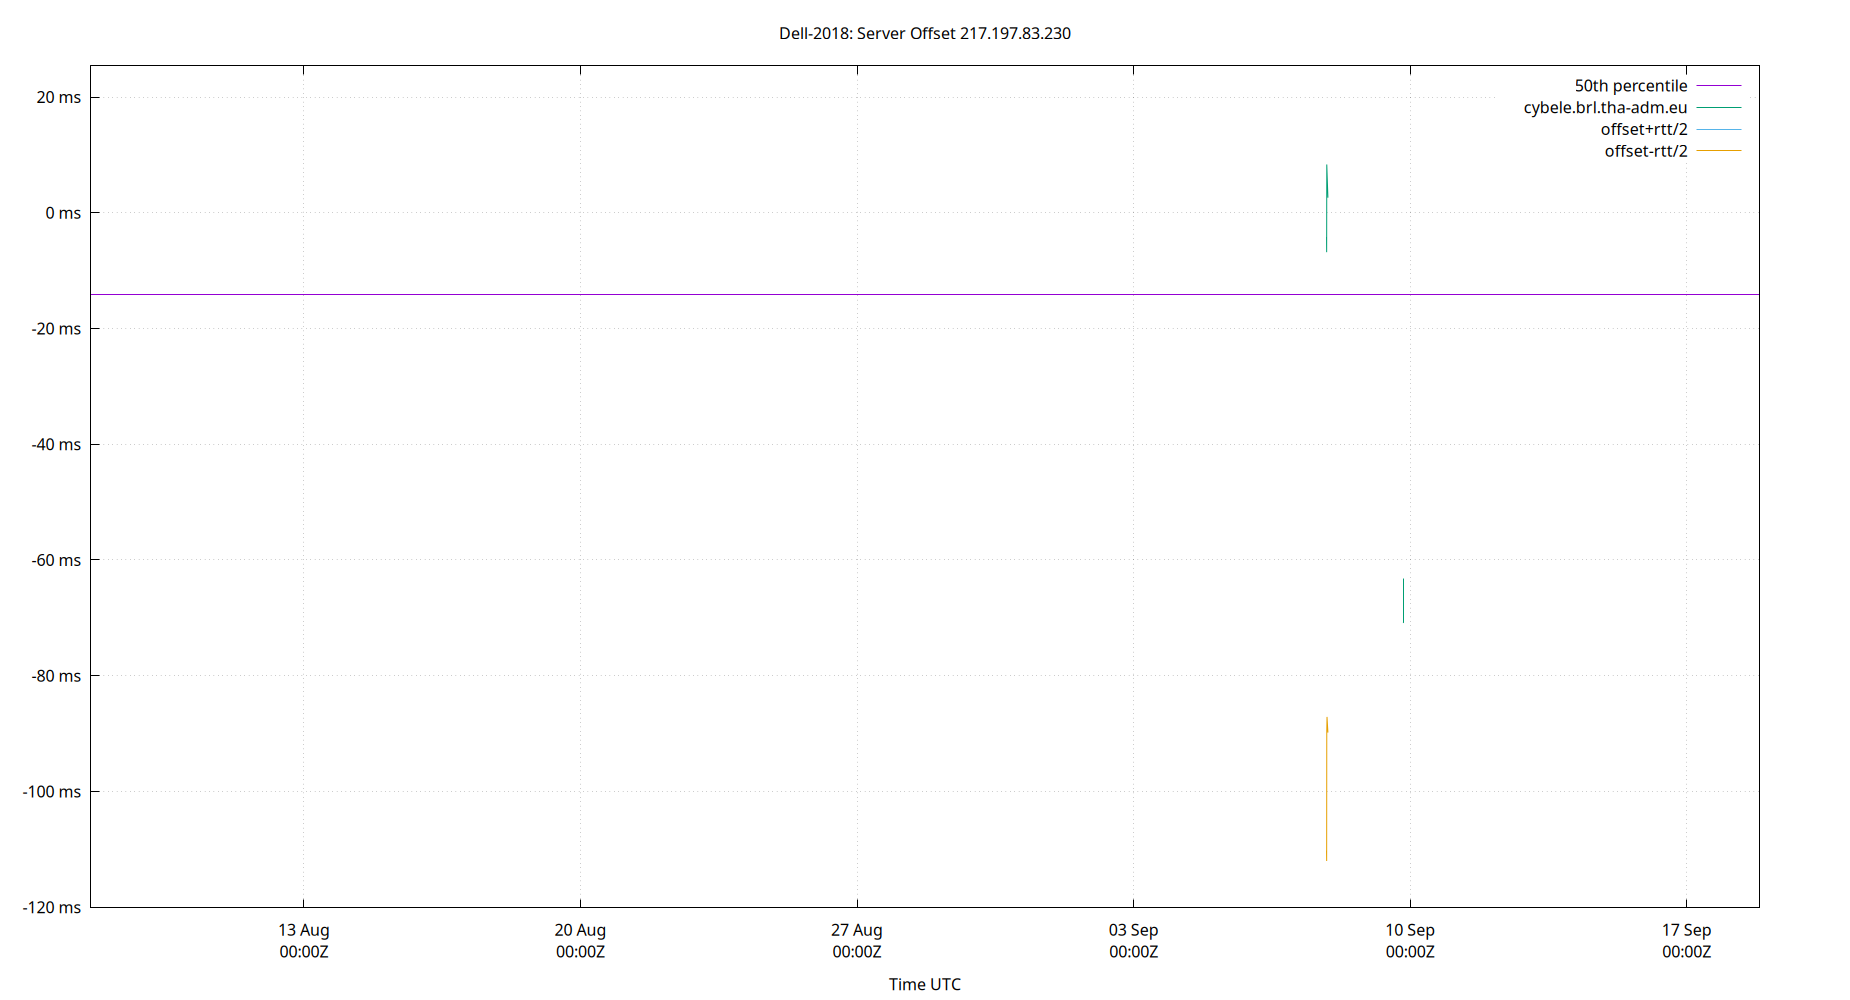
| Percentiles...... | Ranges...... | Skew- | Kurt- | |||||||||||||
| Name | Min | 1% | 5% | 50% | 95% | 99% | Max | 90% | 98% | StdDev | Mean | Units | ness | osis | ||
| Server Offset 217.197.83.230 | -644.978 | -120.144 | -90.030 | -2.361 | 9.869 | 21.281 | 25.380 | 99.899 | 141.425 | 57.356 | -19.975 | ms | -7.154 | 70.61 | ||
The offset of a server in seconds. This is useful to see how the measured offset is behaving.
The chart also plots offset±rtt, where rtt is the round trip time to the server. NTP can not really know the offset of a remote chimer, NTP computes it by subtracting rtt/2 from the offset. Plotting the offset±rtt reverses this calculation to more easily see the effects of rtt changes.
Closer to 0s is better. An ideal system would be a horizontal line at 0s. Typical 90% ranges may be: local LAN server 80µs; 90% ranges for WAN server may be 4ms and much larger.
Clock Offset is field 5 in the peerstats log file. The Round Trip Time (rtt) is field 6 in the peerstats log file.
Server Offset 23.111.186.186

| Percentiles...... | Ranges...... | Skew- | Kurt- | |||||||||||||
| Name | Min | 1% | 5% | 50% | 95% | 99% | Max | 90% | 98% | StdDev | Mean | Units | ness | osis | ||
| Server Offset 23.111.186.186 | 0.800 | 0.800 | 0.800 | 2.292 | 3.617 | 3.617 | 3.617 | 2.817 | 2.817 | 0.849 | 2.280 | ms | -0.2598 | 2.078 | ||
The offset of a server in seconds. This is useful to see how the measured offset is behaving.
The chart also plots offset±rtt, where rtt is the round trip time to the server. NTP can not really know the offset of a remote chimer, NTP computes it by subtracting rtt/2 from the offset. Plotting the offset±rtt reverses this calculation to more easily see the effects of rtt changes.
Closer to 0s is better. An ideal system would be a horizontal line at 0s. Typical 90% ranges may be: local LAN server 80µs; 90% ranges for WAN server may be 4ms and much larger.
Clock Offset is field 5 in the peerstats log file. The Round Trip Time (rtt) is field 6 in the peerstats log file.
Server Offset 23.141.40.123

| Percentiles...... | Ranges...... | Skew- | Kurt- | |||||||||||||
| Name | Min | 1% | 5% | 50% | 95% | 99% | Max | 90% | 98% | StdDev | Mean | Units | ness | osis | ||
| Server Offset 23.141.40.123 | 27.455 | 27.455 | 27.455 | 33.456 | 37.132 | 37.132 | 37.132 | 9.678 | 9.678 | 2.992 | 32.642 | ms | -0.3048 | 2.39 | ||
The offset of a server in seconds. This is useful to see how the measured offset is behaving.
The chart also plots offset±rtt, where rtt is the round trip time to the server. NTP can not really know the offset of a remote chimer, NTP computes it by subtracting rtt/2 from the offset. Plotting the offset±rtt reverses this calculation to more easily see the effects of rtt changes.
Closer to 0s is better. An ideal system would be a horizontal line at 0s. Typical 90% ranges may be: local LAN server 80µs; 90% ranges for WAN server may be 4ms and much larger.
Clock Offset is field 5 in the peerstats log file. The Round Trip Time (rtt) is field 6 in the peerstats log file.
Server Offset 23.142.248.8

| Percentiles...... | Ranges...... | Skew- | Kurt- | |||||||||||||
| Name | Min | 1% | 5% | 50% | 95% | 99% | Max | 90% | 98% | StdDev | Mean | Units | ness | osis | ||
| Server Offset 23.142.248.8 | -3.042 | 1.210 | 6.116 | 10.765 | 12.869 | 13.726 | 15.979 | 6.753 | 12.515 | 2.251 | 10.327 | ms | -1.931 | 8.788 | ||
The offset of a server in seconds. This is useful to see how the measured offset is behaving.
The chart also plots offset±rtt, where rtt is the round trip time to the server. NTP can not really know the offset of a remote chimer, NTP computes it by subtracting rtt/2 from the offset. Plotting the offset±rtt reverses this calculation to more easily see the effects of rtt changes.
Closer to 0s is better. An ideal system would be a horizontal line at 0s. Typical 90% ranges may be: local LAN server 80µs; 90% ranges for WAN server may be 4ms and much larger.
Clock Offset is field 5 in the peerstats log file. The Round Trip Time (rtt) is field 6 in the peerstats log file.
Server Offset 23.142.248.9

| Percentiles...... | Ranges...... | Skew- | Kurt- | |||||||||||||
| Name | Min | 1% | 5% | 50% | 95% | 99% | Max | 90% | 98% | StdDev | Mean | Units | ness | osis | ||
| Server Offset 23.142.248.9 | -263.459 | -263.459 | -261.533 | -1.198 | 167.901 | 168.098 | 168.098 | 429.434 | 431.557 | 92.982 | -6.282 | ms | -0.7409 | 5.495 | ||
The offset of a server in seconds. This is useful to see how the measured offset is behaving.
The chart also plots offset±rtt, where rtt is the round trip time to the server. NTP can not really know the offset of a remote chimer, NTP computes it by subtracting rtt/2 from the offset. Plotting the offset±rtt reverses this calculation to more easily see the effects of rtt changes.
Closer to 0s is better. An ideal system would be a horizontal line at 0s. Typical 90% ranges may be: local LAN server 80µs; 90% ranges for WAN server may be 4ms and much larger.
Clock Offset is field 5 in the peerstats log file. The Round Trip Time (rtt) is field 6 in the peerstats log file.
Server Offset 23.143.196.199

| Percentiles...... | Ranges...... | Skew- | Kurt- | |||||||||||||
| Name | Min | 1% | 5% | 50% | 95% | 99% | Max | 90% | 98% | StdDev | Mean | Units | ness | osis | ||
| Server Offset 23.143.196.199 | 2.248 | 2.248 | 2.248 | 3.906 | 5.387 | 5.387 | 5.387 | 3.139 | 3.139 | 1.032 | 4.058 | ms | -0.2914 | 2.021 | ||
The offset of a server in seconds. This is useful to see how the measured offset is behaving.
The chart also plots offset±rtt, where rtt is the round trip time to the server. NTP can not really know the offset of a remote chimer, NTP computes it by subtracting rtt/2 from the offset. Plotting the offset±rtt reverses this calculation to more easily see the effects of rtt changes.
Closer to 0s is better. An ideal system would be a horizontal line at 0s. Typical 90% ranges may be: local LAN server 80µs; 90% ranges for WAN server may be 4ms and much larger.
Clock Offset is field 5 in the peerstats log file. The Round Trip Time (rtt) is field 6 in the peerstats log file.
Server Offset 23.143.196.201
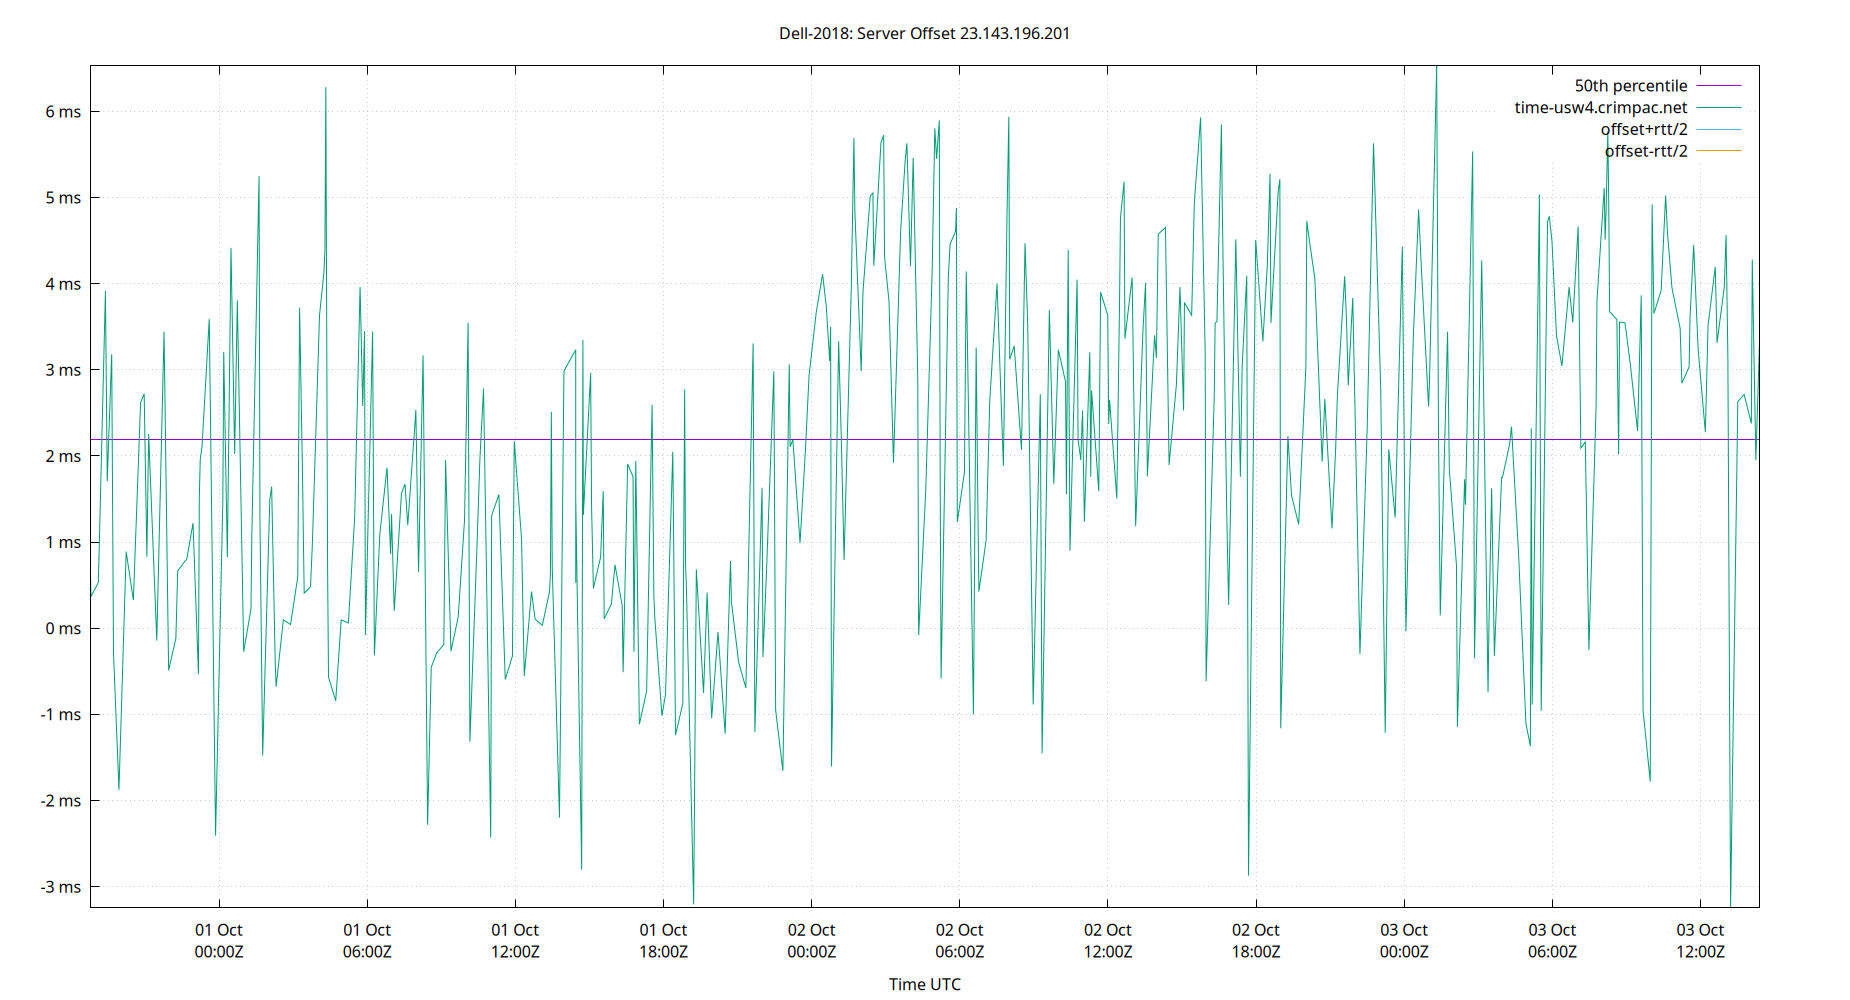
| Percentiles...... | Ranges...... | Skew- | Kurt- | |||||||||||||
| Name | Min | 1% | 5% | 50% | 95% | 99% | Max | 90% | 98% | StdDev | Mean | Units | ness | osis | ||
| Server Offset 23.143.196.201 | -3.248 | -2.432 | -1.161 | 2.192 | 5.184 | 5.896 | 6.528 | 6.345 | 8.328 | 2.016 | 2.129 | ms | -0.2213 | 2.34 | ||
The offset of a server in seconds. This is useful to see how the measured offset is behaving.
The chart also plots offset±rtt, where rtt is the round trip time to the server. NTP can not really know the offset of a remote chimer, NTP computes it by subtracting rtt/2 from the offset. Plotting the offset±rtt reverses this calculation to more easily see the effects of rtt changes.
Closer to 0s is better. An ideal system would be a horizontal line at 0s. Typical 90% ranges may be: local LAN server 80µs; 90% ranges for WAN server may be 4ms and much larger.
Clock Offset is field 5 in the peerstats log file. The Round Trip Time (rtt) is field 6 in the peerstats log file.
Server Offset 23.143.196.204
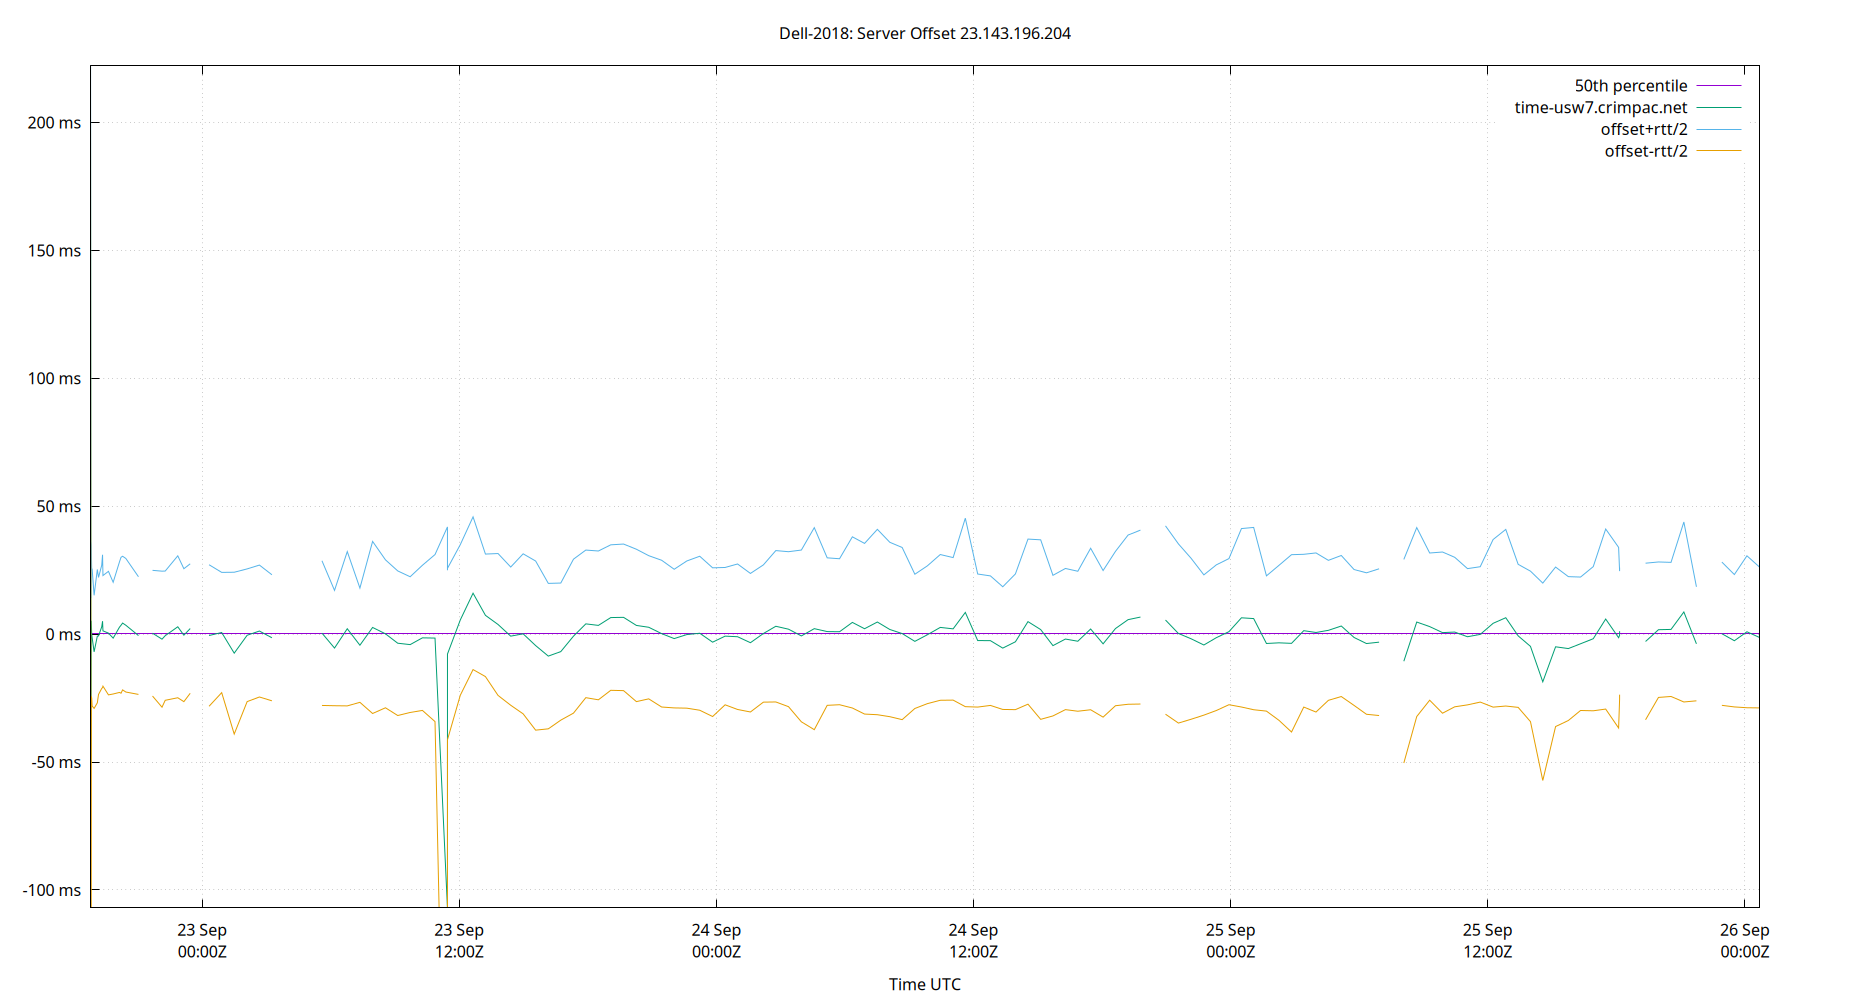
| Percentiles...... | Ranges...... | Skew- | Kurt- | |||||||||||||
| Name | Min | 1% | 5% | 50% | 95% | 99% | Max | 90% | 98% | StdDev | Mean | Units | ness | osis | ||
| Server Offset 23.143.196.204 | -107.049 | -94.828 | -7.774 | 0.136 | 6.684 | 220.984 | 222.164 | 14.458 | 315.812 | 33.455 | 2.740 | ms | 5.036 | 36.93 | ||
The offset of a server in seconds. This is useful to see how the measured offset is behaving.
The chart also plots offset±rtt, where rtt is the round trip time to the server. NTP can not really know the offset of a remote chimer, NTP computes it by subtracting rtt/2 from the offset. Plotting the offset±rtt reverses this calculation to more easily see the effects of rtt changes.
Closer to 0s is better. An ideal system would be a horizontal line at 0s. Typical 90% ranges may be: local LAN server 80µs; 90% ranges for WAN server may be 4ms and much larger.
Clock Offset is field 5 in the peerstats log file. The Round Trip Time (rtt) is field 6 in the peerstats log file.
Server Offset 23.150.40.242

| Percentiles...... | Ranges...... | Skew- | Kurt- | |||||||||||||
| Name | Min | 1% | 5% | 50% | 95% | 99% | Max | 90% | 98% | StdDev | Mean | Units | ness | osis | ||
| Server Offset 23.150.40.242 | -357.926 | -357.926 | -357.926 | 3.502 | 10.525 | 10.525 | 10.525 | 368.451 | 368.451 | 119.758 | -47.624 | ms | -1.976 | 5.174 | ||
The offset of a server in seconds. This is useful to see how the measured offset is behaving.
The chart also plots offset±rtt, where rtt is the round trip time to the server. NTP can not really know the offset of a remote chimer, NTP computes it by subtracting rtt/2 from the offset. Plotting the offset±rtt reverses this calculation to more easily see the effects of rtt changes.
Closer to 0s is better. An ideal system would be a horizontal line at 0s. Typical 90% ranges may be: local LAN server 80µs; 90% ranges for WAN server may be 4ms and much larger.
Clock Offset is field 5 in the peerstats log file. The Round Trip Time (rtt) is field 6 in the peerstats log file.
Server Offset 23.150.41.122

| Percentiles...... | Ranges...... | Skew- | Kurt- | |||||||||||||
| Name | Min | 1% | 5% | 50% | 95% | 99% | Max | 90% | 98% | StdDev | Mean | Units | ness | osis | ||
| Server Offset 23.150.41.122 | -3.912 | -0.906 | 1.567 | 5.532 | 9.044 | 10.304 | 12.219 | 7.477 | 11.210 | 2.174 | 5.373 | ms | -0.477 | 4.713 | ||
The offset of a server in seconds. This is useful to see how the measured offset is behaving.
The chart also plots offset±rtt, where rtt is the round trip time to the server. NTP can not really know the offset of a remote chimer, NTP computes it by subtracting rtt/2 from the offset. Plotting the offset±rtt reverses this calculation to more easily see the effects of rtt changes.
Closer to 0s is better. An ideal system would be a horizontal line at 0s. Typical 90% ranges may be: local LAN server 80µs; 90% ranges for WAN server may be 4ms and much larger.
Clock Offset is field 5 in the peerstats log file. The Round Trip Time (rtt) is field 6 in the peerstats log file.
Server Offset 23.150.41.123

| Percentiles...... | Ranges...... | Skew- | Kurt- | |||||||||||||
| Name | Min | 1% | 5% | 50% | 95% | 99% | Max | 90% | 98% | StdDev | Mean | Units | ness | osis | ||
| Server Offset 23.150.41.123 | -22.902 | -6.030 | -2.730 | 7.633 | 11.334 | 22.936 | 32.724 | 14.064 | 28.966 | 4.915 | 6.544 | ms | -0.1661 | 7.953 | ||
The offset of a server in seconds. This is useful to see how the measured offset is behaving.
The chart also plots offset±rtt, where rtt is the round trip time to the server. NTP can not really know the offset of a remote chimer, NTP computes it by subtracting rtt/2 from the offset. Plotting the offset±rtt reverses this calculation to more easily see the effects of rtt changes.
Closer to 0s is better. An ideal system would be a horizontal line at 0s. Typical 90% ranges may be: local LAN server 80µs; 90% ranges for WAN server may be 4ms and much larger.
Clock Offset is field 5 in the peerstats log file. The Round Trip Time (rtt) is field 6 in the peerstats log file.
Server Offset 23.155.40.38

| Percentiles...... | Ranges...... | Skew- | Kurt- | |||||||||||||
| Name | Min | 1% | 5% | 50% | 95% | 99% | Max | 90% | 98% | StdDev | Mean | Units | ness | osis | ||
| Server Offset 23.155.40.38 | -158.747 | -42.839 | -3.587 | 1.531 | 3.890 | 6.081 | 8.018 | 7.477 | 48.920 | 15.680 | -0.567 | ms | -9.275 | 91.75 | ||
The offset of a server in seconds. This is useful to see how the measured offset is behaving.
The chart also plots offset±rtt, where rtt is the round trip time to the server. NTP can not really know the offset of a remote chimer, NTP computes it by subtracting rtt/2 from the offset. Plotting the offset±rtt reverses this calculation to more easily see the effects of rtt changes.
Closer to 0s is better. An ideal system would be a horizontal line at 0s. Typical 90% ranges may be: local LAN server 80µs; 90% ranges for WAN server may be 4ms and much larger.
Clock Offset is field 5 in the peerstats log file. The Round Trip Time (rtt) is field 6 in the peerstats log file.
Server Offset 23.155.72.147

| Percentiles...... | Ranges...... | Skew- | Kurt- | |||||||||||||
| Name | Min | 1% | 5% | 50% | 95% | 99% | Max | 90% | 98% | StdDev | Mean | Units | ness | osis | ||
| Server Offset 23.155.72.147 | -392.987 | -391.252 | -12.441 | -6.112 | -0.837 | 1.703 | 7.397 | 11.604 | 392.955 | 61.955 | -16.524 | ms | -5.782 | 34.56 | ||
The offset of a server in seconds. This is useful to see how the measured offset is behaving.
The chart also plots offset±rtt, where rtt is the round trip time to the server. NTP can not really know the offset of a remote chimer, NTP computes it by subtracting rtt/2 from the offset. Plotting the offset±rtt reverses this calculation to more easily see the effects of rtt changes.
Closer to 0s is better. An ideal system would be a horizontal line at 0s. Typical 90% ranges may be: local LAN server 80µs; 90% ranges for WAN server may be 4ms and much larger.
Clock Offset is field 5 in the peerstats log file. The Round Trip Time (rtt) is field 6 in the peerstats log file.
Server Offset 23.157.100.123
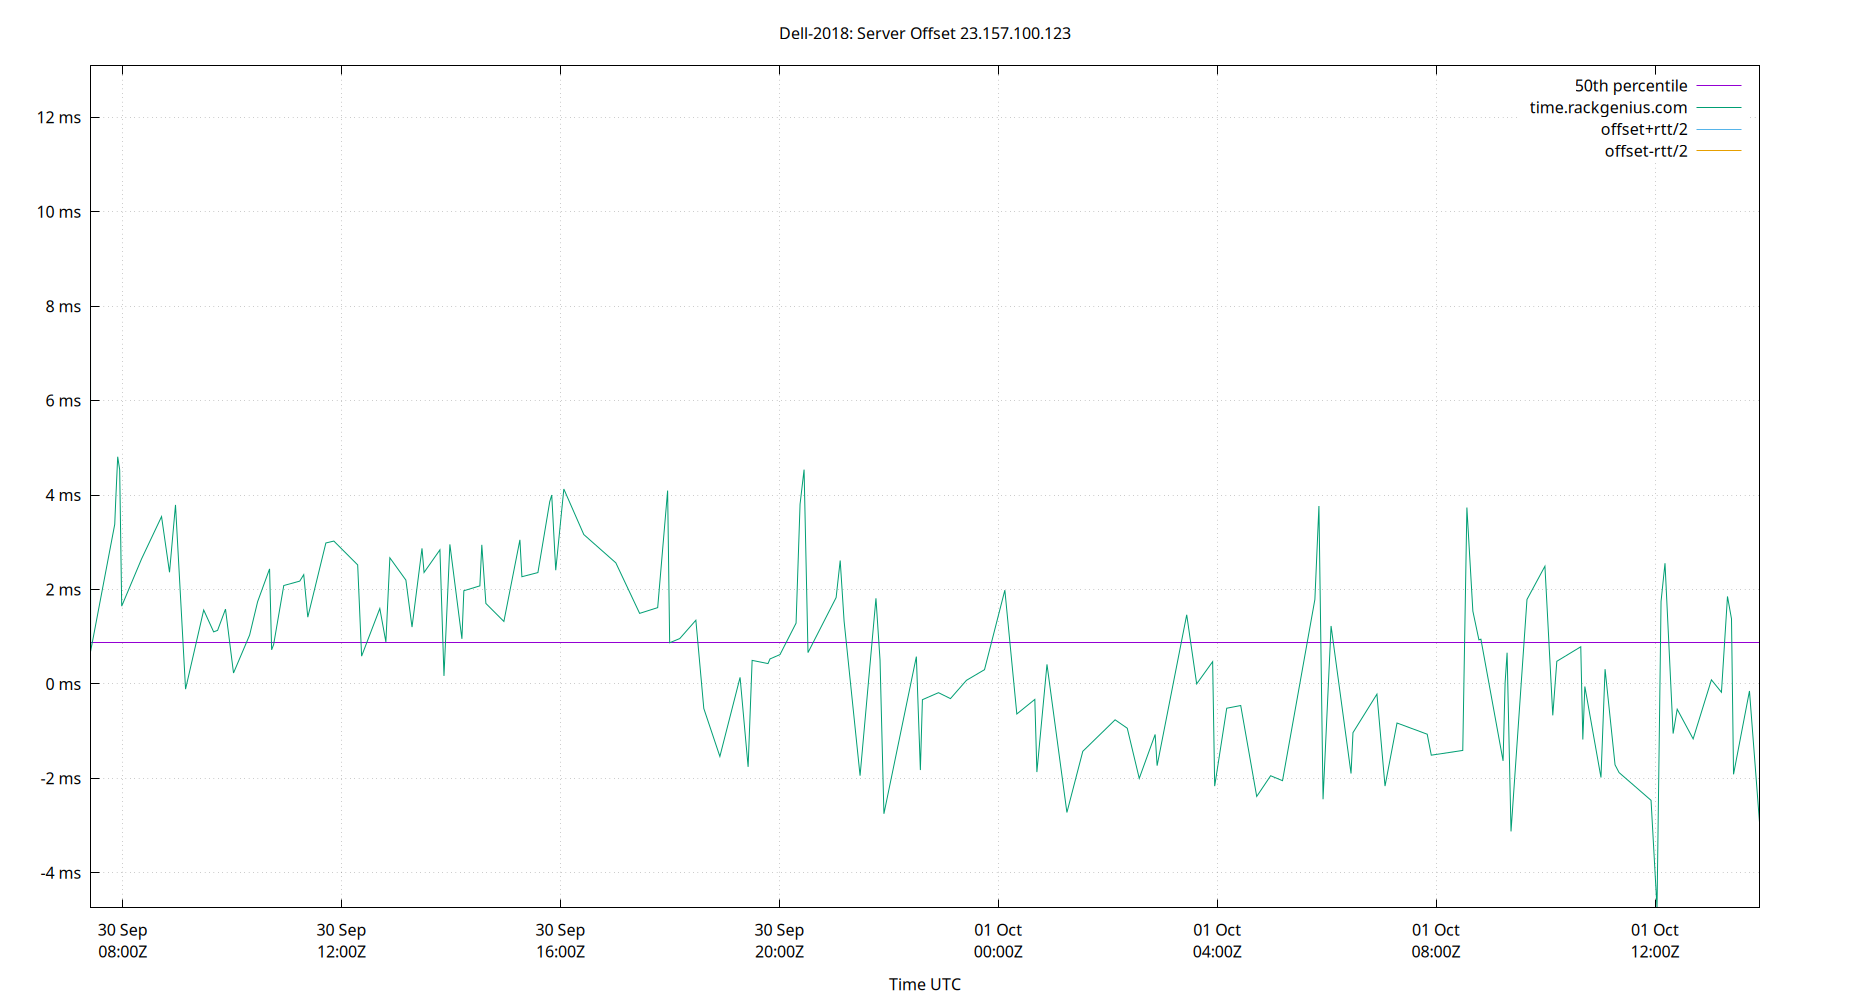
| Percentiles...... | Ranges...... | Skew- | Kurt- | |||||||||||||
| Name | Min | 1% | 5% | 50% | 95% | 99% | Max | 90% | 98% | StdDev | Mean | Units | ness | osis | ||
| Server Offset 23.157.100.123 | -4.745 | -3.123 | -2.383 | 0.872 | 4.094 | 7.697 | 13.088 | 6.477 | 10.821 | 2.230 | 0.872 | ms | 1.057 | 7.789 | ||
The offset of a server in seconds. This is useful to see how the measured offset is behaving.
The chart also plots offset±rtt, where rtt is the round trip time to the server. NTP can not really know the offset of a remote chimer, NTP computes it by subtracting rtt/2 from the offset. Plotting the offset±rtt reverses this calculation to more easily see the effects of rtt changes.
Closer to 0s is better. An ideal system would be a horizontal line at 0s. Typical 90% ranges may be: local LAN server 80µs; 90% ranges for WAN server may be 4ms and much larger.
Clock Offset is field 5 in the peerstats log file. The Round Trip Time (rtt) is field 6 in the peerstats log file.
Server Offset 23.157.160.168

| Percentiles...... | Ranges...... | Skew- | Kurt- | |||||||||||||
| Name | Min | 1% | 5% | 50% | 95% | 99% | Max | 90% | 98% | StdDev | Mean | Units | ness | osis | ||
| Server Offset 23.157.160.168 | -5.068 | -1.215 | 0.086 | 3.583 | 6.081 | 7.468 | 9.623 | 5.995 | 8.683 | 1.775 | 3.402 | ms | -0.5016 | 4.099 | ||
The offset of a server in seconds. This is useful to see how the measured offset is behaving.
The chart also plots offset±rtt, where rtt is the round trip time to the server. NTP can not really know the offset of a remote chimer, NTP computes it by subtracting rtt/2 from the offset. Plotting the offset±rtt reverses this calculation to more easily see the effects of rtt changes.
Closer to 0s is better. An ideal system would be a horizontal line at 0s. Typical 90% ranges may be: local LAN server 80µs; 90% ranges for WAN server may be 4ms and much larger.
Clock Offset is field 5 in the peerstats log file. The Round Trip Time (rtt) is field 6 in the peerstats log file.
Server Offset 23.159.16.194

| Percentiles...... | Ranges...... | Skew- | Kurt- | |||||||||||||
| Name | Min | 1% | 5% | 50% | 95% | 99% | Max | 90% | 98% | StdDev | Mean | Units | ness | osis | ||
| Server Offset 23.159.16.194 | -332.773 | -2.949 | 1.895 | 12.336 | 15.900 | 21.536 | 27.238 | 14.005 | 24.484 | 25.353 | 9.220 | ms | -12.89 | 173.5 | ||
The offset of a server in seconds. This is useful to see how the measured offset is behaving.
The chart also plots offset±rtt, where rtt is the round trip time to the server. NTP can not really know the offset of a remote chimer, NTP computes it by subtracting rtt/2 from the offset. Plotting the offset±rtt reverses this calculation to more easily see the effects of rtt changes.
Closer to 0s is better. An ideal system would be a horizontal line at 0s. Typical 90% ranges may be: local LAN server 80µs; 90% ranges for WAN server may be 4ms and much larger.
Clock Offset is field 5 in the peerstats log file. The Round Trip Time (rtt) is field 6 in the peerstats log file.
Server Offset 23.161.104.133

| Percentiles...... | Ranges...... | Skew- | Kurt- | |||||||||||||
| Name | Min | 1% | 5% | 50% | 95% | 99% | Max | 90% | 98% | StdDev | Mean | Units | ness | osis | ||
| Server Offset 23.161.104.133 | -2,049.972 | -101.074 | -80.336 | -9.695 | 8.763 | 15.686 | 36.039 | 89.098 | 116.761 | 72.603 | -20.023 | ms | -24.13 | 673.1 | ||
The offset of a server in seconds. This is useful to see how the measured offset is behaving.
The chart also plots offset±rtt, where rtt is the round trip time to the server. NTP can not really know the offset of a remote chimer, NTP computes it by subtracting rtt/2 from the offset. Plotting the offset±rtt reverses this calculation to more easily see the effects of rtt changes.
Closer to 0s is better. An ideal system would be a horizontal line at 0s. Typical 90% ranges may be: local LAN server 80µs; 90% ranges for WAN server may be 4ms and much larger.
Clock Offset is field 5 in the peerstats log file. The Round Trip Time (rtt) is field 6 in the peerstats log file.
Server Offset 23.168.24.210

| Percentiles...... | Ranges...... | Skew- | Kurt- | |||||||||||||
| Name | Min | 1% | 5% | 50% | 95% | 99% | Max | 90% | 98% | StdDev | Mean | Units | ness | osis | ||
| Server Offset 23.168.24.210 | -30.994 | -9.946 | -0.456 | 4.953 | 9.479 | 14.370 | 15.899 | 9.935 | 24.316 | 3.912 | 4.627 | ms | -3.016 | 28.6 | ||
The offset of a server in seconds. This is useful to see how the measured offset is behaving.
The chart also plots offset±rtt, where rtt is the round trip time to the server. NTP can not really know the offset of a remote chimer, NTP computes it by subtracting rtt/2 from the offset. Plotting the offset±rtt reverses this calculation to more easily see the effects of rtt changes.
Closer to 0s is better. An ideal system would be a horizontal line at 0s. Typical 90% ranges may be: local LAN server 80µs; 90% ranges for WAN server may be 4ms and much larger.
Clock Offset is field 5 in the peerstats log file. The Round Trip Time (rtt) is field 6 in the peerstats log file.
Server Offset 23.172.120.58
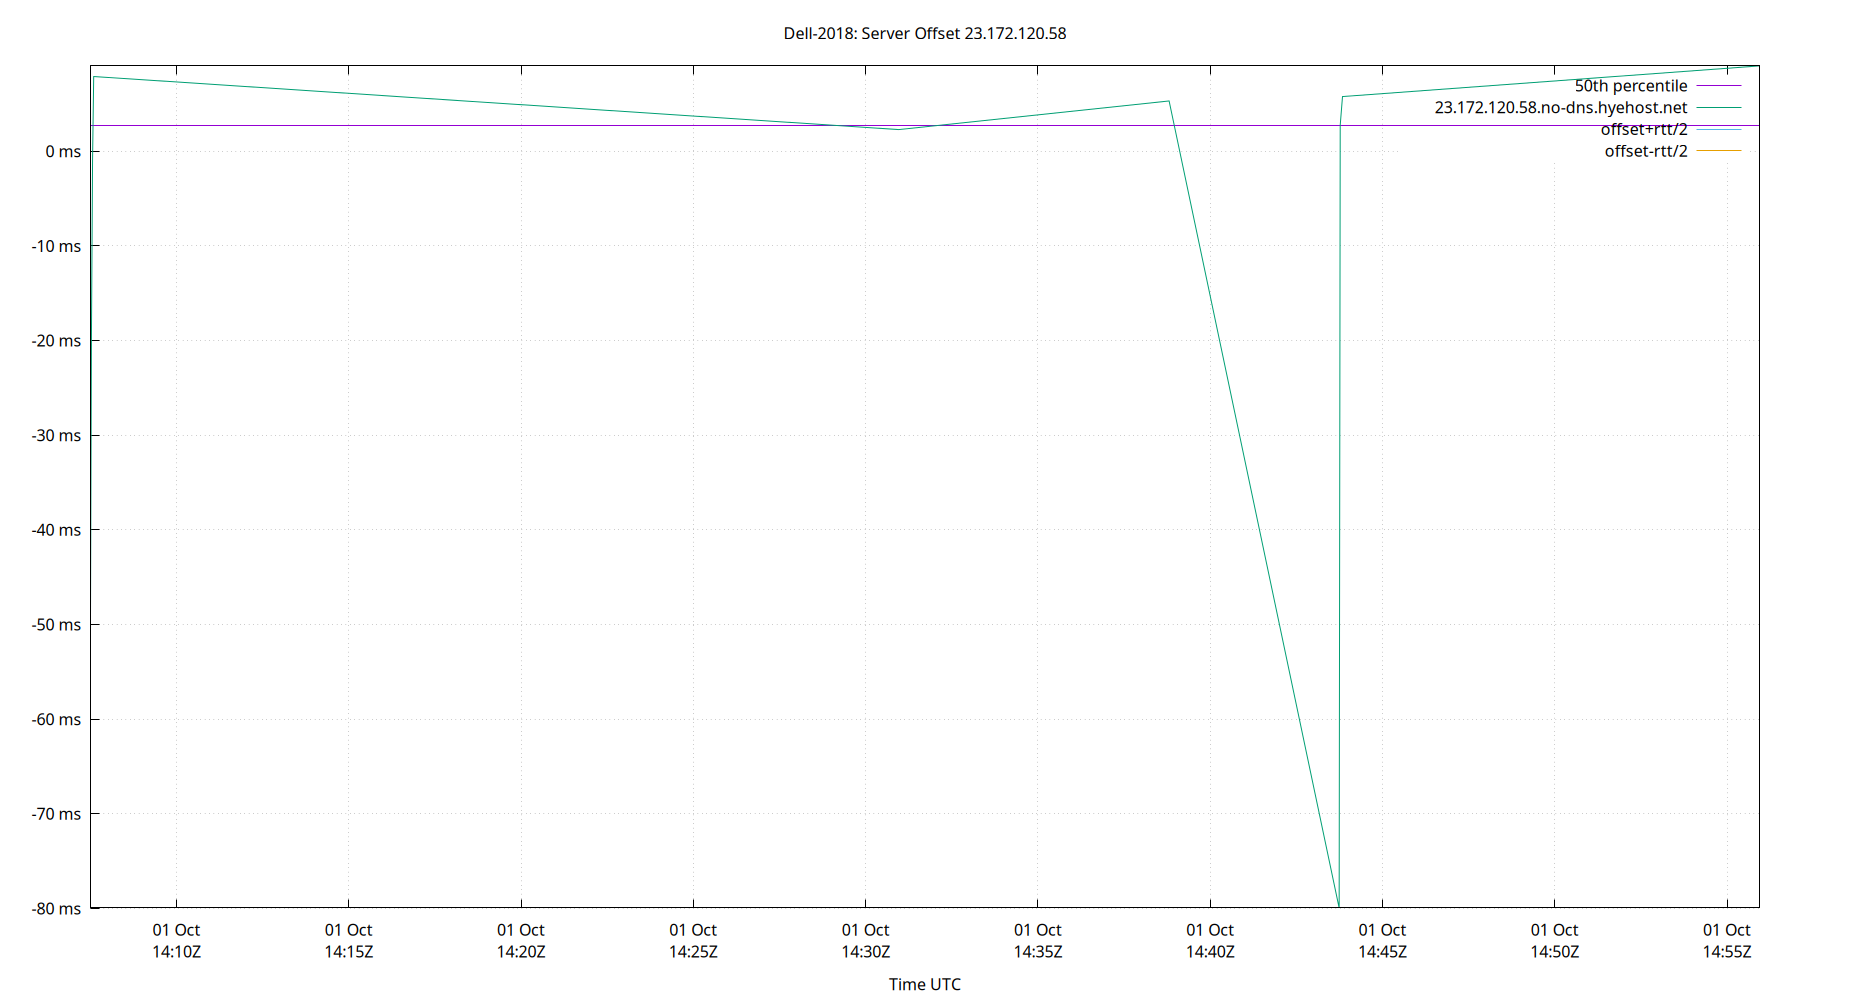
| Percentiles...... | Ranges...... | Skew- | Kurt- | |||||||||||||
| Name | Min | 1% | 5% | 50% | 95% | 99% | Max | 90% | 98% | StdDev | Mean | Units | ness | osis | ||
| Server Offset 23.172.120.58 | -79.949 | -79.949 | -79.949 | 2.744 | 9.020 | 9.020 | 9.020 | 88.969 | 88.969 | 28.367 | -11.643 | ms | -1.482 | 3.759 | ||
The offset of a server in seconds. This is useful to see how the measured offset is behaving.
The chart also plots offset±rtt, where rtt is the round trip time to the server. NTP can not really know the offset of a remote chimer, NTP computes it by subtracting rtt/2 from the offset. Plotting the offset±rtt reverses this calculation to more easily see the effects of rtt changes.
Closer to 0s is better. An ideal system would be a horizontal line at 0s. Typical 90% ranges may be: local LAN server 80µs; 90% ranges for WAN server may be 4ms and much larger.
Clock Offset is field 5 in the peerstats log file. The Round Trip Time (rtt) is field 6 in the peerstats log file.
Server Offset 23.186.168.123

| Percentiles...... | Ranges...... | Skew- | Kurt- | |||||||||||||
| Name | Min | 1% | 5% | 50% | 95% | 99% | Max | 90% | 98% | StdDev | Mean | Units | ness | osis | ||
| Server Offset 23.186.168.123 | -18.265 | -7.473 | -3.660 | 1.767 | 4.077 | 5.137 | 24.970 | 7.737 | 12.610 | 2.589 | 1.198 | ms | -1.386 | 9.449 | ||
The offset of a server in seconds. This is useful to see how the measured offset is behaving.
The chart also plots offset±rtt, where rtt is the round trip time to the server. NTP can not really know the offset of a remote chimer, NTP computes it by subtracting rtt/2 from the offset. Plotting the offset±rtt reverses this calculation to more easily see the effects of rtt changes.
Closer to 0s is better. An ideal system would be a horizontal line at 0s. Typical 90% ranges may be: local LAN server 80µs; 90% ranges for WAN server may be 4ms and much larger.
Clock Offset is field 5 in the peerstats log file. The Round Trip Time (rtt) is field 6 in the peerstats log file.
Server Offset 23.186.168.124

| Percentiles...... | Ranges...... | Skew- | Kurt- | |||||||||||||
| Name | Min | 1% | 5% | 50% | 95% | 99% | Max | 90% | 98% | StdDev | Mean | Units | ness | osis | ||
| Server Offset 23.186.168.124 | -7.176 | -6.031 | -5.380 | -1.281 | 2.774 | 3.857 | 4.744 | 8.154 | 9.888 | 2.555 | -1.268 | ms | 0.008223 | 2.264 | ||
The offset of a server in seconds. This is useful to see how the measured offset is behaving.
The chart also plots offset±rtt, where rtt is the round trip time to the server. NTP can not really know the offset of a remote chimer, NTP computes it by subtracting rtt/2 from the offset. Plotting the offset±rtt reverses this calculation to more easily see the effects of rtt changes.
Closer to 0s is better. An ideal system would be a horizontal line at 0s. Typical 90% ranges may be: local LAN server 80µs; 90% ranges for WAN server may be 4ms and much larger.
Clock Offset is field 5 in the peerstats log file. The Round Trip Time (rtt) is field 6 in the peerstats log file.
Server Offset 23.186.168.125

| Percentiles...... | Ranges...... | Skew- | Kurt- | |||||||||||||
| Name | Min | 1% | 5% | 50% | 95% | 99% | Max | 90% | 98% | StdDev | Mean | Units | ness | osis | ||
| Server Offset 23.186.168.125 | -336.573 | -5.459 | -2.373 | 1.898 | 4.226 | 5.955 | 897.143 | 6.599 | 11.414 | 22.668 | 1.625 | ms | 27.25 | 1248 | ||
The offset of a server in seconds. This is useful to see how the measured offset is behaving.
The chart also plots offset±rtt, where rtt is the round trip time to the server. NTP can not really know the offset of a remote chimer, NTP computes it by subtracting rtt/2 from the offset. Plotting the offset±rtt reverses this calculation to more easily see the effects of rtt changes.
Closer to 0s is better. An ideal system would be a horizontal line at 0s. Typical 90% ranges may be: local LAN server 80µs; 90% ranges for WAN server may be 4ms and much larger.
Clock Offset is field 5 in the peerstats log file. The Round Trip Time (rtt) is field 6 in the peerstats log file.
Server Offset 23.186.168.126

| Percentiles...... | Ranges...... | Skew- | Kurt- | |||||||||||||
| Name | Min | 1% | 5% | 50% | 95% | 99% | Max | 90% | 98% | StdDev | Mean | Units | ness | osis | ||
| Server Offset 23.186.168.126 | -114.793 | -5.494 | -2.029 | 1.669 | 3.740 | 5.283 | 10.039 | 5.769 | 10.777 | 10.165 | 0.545 | ms | -10.67 | 118.6 | ||
The offset of a server in seconds. This is useful to see how the measured offset is behaving.
The chart also plots offset±rtt, where rtt is the round trip time to the server. NTP can not really know the offset of a remote chimer, NTP computes it by subtracting rtt/2 from the offset. Plotting the offset±rtt reverses this calculation to more easily see the effects of rtt changes.
Closer to 0s is better. An ideal system would be a horizontal line at 0s. Typical 90% ranges may be: local LAN server 80µs; 90% ranges for WAN server may be 4ms and much larger.
Clock Offset is field 5 in the peerstats log file. The Round Trip Time (rtt) is field 6 in the peerstats log file.
Server Offset 23.186.168.127

| Percentiles...... | Ranges...... | Skew- | Kurt- | |||||||||||||
| Name | Min | 1% | 5% | 50% | 95% | 99% | Max | 90% | 98% | StdDev | Mean | Units | ness | osis | ||
| Server Offset 23.186.168.127 | -58.630 | -25.454 | -3.967 | -0.269 | 2.056 | 2.794 | 17.173 | 6.023 | 28.248 | 5.716 | -1.006 | ms | -8.057 | 76.54 | ||
The offset of a server in seconds. This is useful to see how the measured offset is behaving.
The chart also plots offset±rtt, where rtt is the round trip time to the server. NTP can not really know the offset of a remote chimer, NTP computes it by subtracting rtt/2 from the offset. Plotting the offset±rtt reverses this calculation to more easily see the effects of rtt changes.
Closer to 0s is better. An ideal system would be a horizontal line at 0s. Typical 90% ranges may be: local LAN server 80µs; 90% ranges for WAN server may be 4ms and much larger.
Clock Offset is field 5 in the peerstats log file. The Round Trip Time (rtt) is field 6 in the peerstats log file.
Server Offset 23.186.168.128

| Percentiles...... | Ranges...... | Skew- | Kurt- | |||||||||||||
| Name | Min | 1% | 5% | 50% | 95% | 99% | Max | 90% | 98% | StdDev | Mean | Units | ness | osis | ||
| Server Offset 23.186.168.128 | -7.831 | -6.730 | -4.726 | 1.455 | 4.924 | 6.120 | 63.422 | 9.650 | 12.850 | 4.415 | 1.087 | ms | 7.553 | 110.7 | ||
The offset of a server in seconds. This is useful to see how the measured offset is behaving.
The chart also plots offset±rtt, where rtt is the round trip time to the server. NTP can not really know the offset of a remote chimer, NTP computes it by subtracting rtt/2 from the offset. Plotting the offset±rtt reverses this calculation to more easily see the effects of rtt changes.
Closer to 0s is better. An ideal system would be a horizontal line at 0s. Typical 90% ranges may be: local LAN server 80µs; 90% ranges for WAN server may be 4ms and much larger.
Clock Offset is field 5 in the peerstats log file. The Round Trip Time (rtt) is field 6 in the peerstats log file.
Server Offset 23.186.168.129

| Percentiles...... | Ranges...... | Skew- | Kurt- | |||||||||||||
| Name | Min | 1% | 5% | 50% | 95% | 99% | Max | 90% | 98% | StdDev | Mean | Units | ness | osis | ||
| Server Offset 23.186.168.129 | -100.937 | -8.499 | -4.716 | 2.006 | 5.778 | 10.678 | 903.521 | 10.494 | 19.177 | 32.186 | 2.505 | ms | 23.73 | 641.5 | ||
The offset of a server in seconds. This is useful to see how the measured offset is behaving.
The chart also plots offset±rtt, where rtt is the round trip time to the server. NTP can not really know the offset of a remote chimer, NTP computes it by subtracting rtt/2 from the offset. Plotting the offset±rtt reverses this calculation to more easily see the effects of rtt changes.
Closer to 0s is better. An ideal system would be a horizontal line at 0s. Typical 90% ranges may be: local LAN server 80µs; 90% ranges for WAN server may be 4ms and much larger.
Clock Offset is field 5 in the peerstats log file. The Round Trip Time (rtt) is field 6 in the peerstats log file.
Server Offset 23.186.168.130

| Percentiles...... | Ranges...... | Skew- | Kurt- | |||||||||||||
| Name | Min | 1% | 5% | 50% | 95% | 99% | Max | 90% | 98% | StdDev | Mean | Units | ness | osis | ||
| Server Offset 23.186.168.130 | -55.890 | -48.645 | -2.696 | 1.561 | 4.167 | 5.438 | 18.506 | 6.863 | 54.083 | 6.377 | 0.637 | ms | -7.029 | 58.13 | ||
The offset of a server in seconds. This is useful to see how the measured offset is behaving.
The chart also plots offset±rtt, where rtt is the round trip time to the server. NTP can not really know the offset of a remote chimer, NTP computes it by subtracting rtt/2 from the offset. Plotting the offset±rtt reverses this calculation to more easily see the effects of rtt changes.
Closer to 0s is better. An ideal system would be a horizontal line at 0s. Typical 90% ranges may be: local LAN server 80µs; 90% ranges for WAN server may be 4ms and much larger.
Clock Offset is field 5 in the peerstats log file. The Round Trip Time (rtt) is field 6 in the peerstats log file.
Server Offset 23.186.168.131

| Percentiles...... | Ranges...... | Skew- | Kurt- | |||||||||||||
| Name | Min | 1% | 5% | 50% | 95% | 99% | Max | 90% | 98% | StdDev | Mean | Units | ness | osis | ||
| Server Offset 23.186.168.131 | -101.224 | -14.992 | -10.507 | -2.050 | 4.758 | 216.109 | 218.513 | 15.265 | 231.100 | 24.800 | -0.328 | ms | 7.25 | 68.58 | ||
The offset of a server in seconds. This is useful to see how the measured offset is behaving.
The chart also plots offset±rtt, where rtt is the round trip time to the server. NTP can not really know the offset of a remote chimer, NTP computes it by subtracting rtt/2 from the offset. Plotting the offset±rtt reverses this calculation to more easily see the effects of rtt changes.
Closer to 0s is better. An ideal system would be a horizontal line at 0s. Typical 90% ranges may be: local LAN server 80µs; 90% ranges for WAN server may be 4ms and much larger.
Clock Offset is field 5 in the peerstats log file. The Round Trip Time (rtt) is field 6 in the peerstats log file.
Server Offset 23.186.168.132

| Percentiles...... | Ranges...... | Skew- | Kurt- | |||||||||||||
| Name | Min | 1% | 5% | 50% | 95% | 99% | Max | 90% | 98% | StdDev | Mean | Units | ness | osis | ||
| Server Offset 23.186.168.132 | -9.048 | -8.170 | -7.030 | -3.318 | -1.756 | -0.801 | -0.358 | 5.274 | 7.370 | 1.536 | -3.601 | ms | -1.052 | 4.19 | ||
The offset of a server in seconds. This is useful to see how the measured offset is behaving.
The chart also plots offset±rtt, where rtt is the round trip time to the server. NTP can not really know the offset of a remote chimer, NTP computes it by subtracting rtt/2 from the offset. Plotting the offset±rtt reverses this calculation to more easily see the effects of rtt changes.
Closer to 0s is better. An ideal system would be a horizontal line at 0s. Typical 90% ranges may be: local LAN server 80µs; 90% ranges for WAN server may be 4ms and much larger.
Clock Offset is field 5 in the peerstats log file. The Round Trip Time (rtt) is field 6 in the peerstats log file.
Server Offset 23.186.168.133

| Percentiles...... | Ranges...... | Skew- | Kurt- | |||||||||||||
| Name | Min | 1% | 5% | 50% | 95% | 99% | Max | 90% | 98% | StdDev | Mean | Units | ness | osis | ||
| Server Offset 23.186.168.133 | -7.844 | -6.607 | -5.595 | -2.001 | 2.119 | 2.715 | 3.271 | 7.713 | 9.323 | 2.577 | -1.805 | ms | 0.003423 | 2.023 | ||
The offset of a server in seconds. This is useful to see how the measured offset is behaving.
The chart also plots offset±rtt, where rtt is the round trip time to the server. NTP can not really know the offset of a remote chimer, NTP computes it by subtracting rtt/2 from the offset. Plotting the offset±rtt reverses this calculation to more easily see the effects of rtt changes.
Closer to 0s is better. An ideal system would be a horizontal line at 0s. Typical 90% ranges may be: local LAN server 80µs; 90% ranges for WAN server may be 4ms and much larger.
Clock Offset is field 5 in the peerstats log file. The Round Trip Time (rtt) is field 6 in the peerstats log file.
Server Offset 23.93.251.54
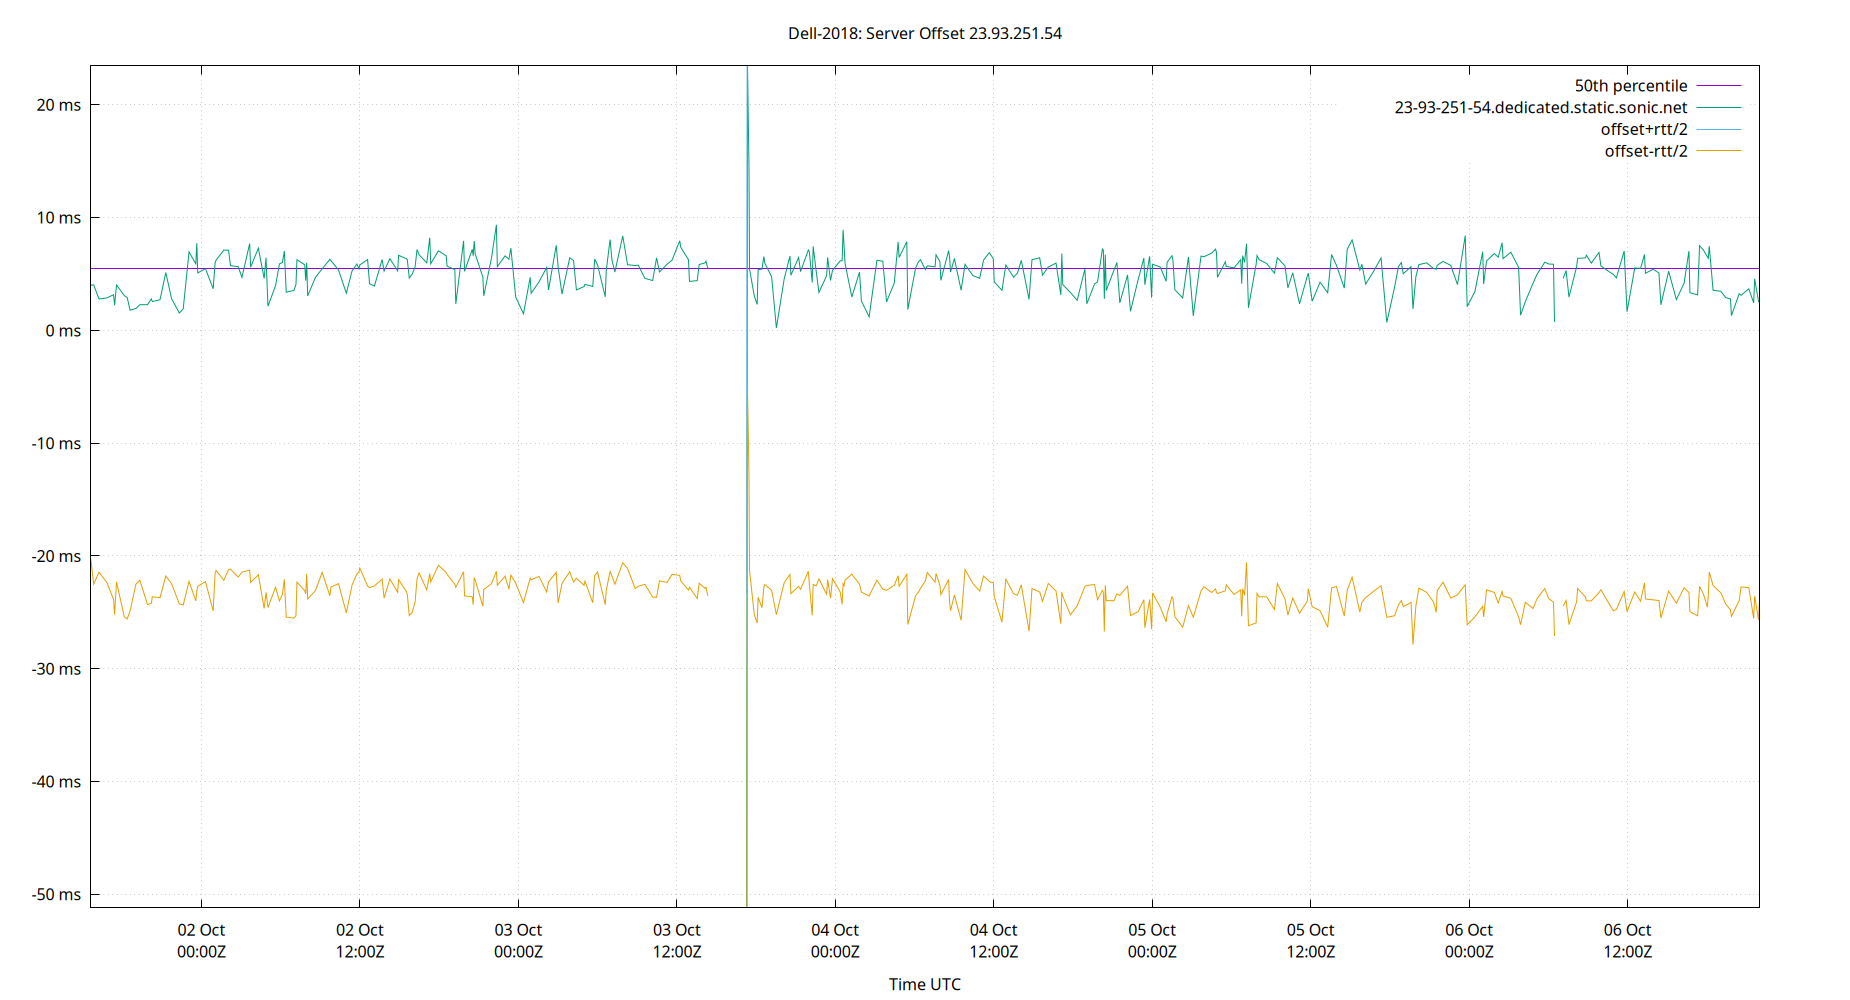
| Percentiles...... | Ranges...... | Skew- | Kurt- | |||||||||||||
| Name | Min | 1% | 5% | 50% | 95% | 99% | Max | 90% | 98% | StdDev | Mean | Units | ness | osis | ||
| Server Offset 23.93.251.54 | -51.217 | -48.316 | 1.849 | 5.492 | 7.678 | 9.363 | 23.453 | 5.829 | 57.678 | 7.050 | 4.320 | ms | -6.582 | 49.67 | ||
The offset of a server in seconds. This is useful to see how the measured offset is behaving.
The chart also plots offset±rtt, where rtt is the round trip time to the server. NTP can not really know the offset of a remote chimer, NTP computes it by subtracting rtt/2 from the offset. Plotting the offset±rtt reverses this calculation to more easily see the effects of rtt changes.
Closer to 0s is better. An ideal system would be a horizontal line at 0s. Typical 90% ranges may be: local LAN server 80µs; 90% ranges for WAN server may be 4ms and much larger.
Clock Offset is field 5 in the peerstats log file. The Round Trip Time (rtt) is field 6 in the peerstats log file.
Server Offset 23.95.35.34

| Percentiles...... | Ranges...... | Skew- | Kurt- | |||||||||||||
| Name | Min | 1% | 5% | 50% | 95% | 99% | Max | 90% | 98% | StdDev | Mean | Units | ness | osis | ||
| Server Offset 23.95.35.34 | -27.613 | -4.807 | -3.147 | 0.347 | 4.555 | 6.819 | 20.501 | 7.701 | 11.627 | 2.606 | 0.524 | ms | -0.5651 | 20.3 | ||
The offset of a server in seconds. This is useful to see how the measured offset is behaving.
The chart also plots offset±rtt, where rtt is the round trip time to the server. NTP can not really know the offset of a remote chimer, NTP computes it by subtracting rtt/2 from the offset. Plotting the offset±rtt reverses this calculation to more easily see the effects of rtt changes.
Closer to 0s is better. An ideal system would be a horizontal line at 0s. Typical 90% ranges may be: local LAN server 80µs; 90% ranges for WAN server may be 4ms and much larger.
Clock Offset is field 5 in the peerstats log file. The Round Trip Time (rtt) is field 6 in the peerstats log file.
Server Offset 23.95.49.216

| Percentiles...... | Ranges...... | Skew- | Kurt- | |||||||||||||
| Name | Min | 1% | 5% | 50% | 95% | 99% | Max | 90% | 98% | StdDev | Mean | Units | ness | osis | ||
| Server Offset 23.95.49.216 | 2.004 | 2.004 | 2.004 | 5.904 | 7.369 | 7.369 | 7.369 | 5.365 | 5.365 | 1.531 | 5.662 | ms | -0.973 | 3.221 | ||
The offset of a server in seconds. This is useful to see how the measured offset is behaving.
The chart also plots offset±rtt, where rtt is the round trip time to the server. NTP can not really know the offset of a remote chimer, NTP computes it by subtracting rtt/2 from the offset. Plotting the offset±rtt reverses this calculation to more easily see the effects of rtt changes.
Closer to 0s is better. An ideal system would be a horizontal line at 0s. Typical 90% ranges may be: local LAN server 80µs; 90% ranges for WAN server may be 4ms and much larger.
Clock Offset is field 5 in the peerstats log file. The Round Trip Time (rtt) is field 6 in the peerstats log file.
Server Offset 2401:c080:3000:2945:5400:4ff:fe69:f923 (ntpd-rs.sidnlabs.nl)

| Percentiles...... | Ranges...... | Skew- | Kurt- | |||||||||||||
| Name | Min | 1% | 5% | 50% | 95% | 99% | Max | 90% | 98% | StdDev | Mean | Units | ness | osis | ||
| Server Offset 2401:c080:3000:2945:5400:4ff:fe69:f923 (ntpd-rs.sidnlabs.nl) | -78.463 | -36.395 | -20.979 | -11.546 | -3.410 | 27.956 | 685.845 | 17.569 | 64.351 | 13.179 | -11.475 | ms | 30.75 | 1614 | ||
The offset of a server in seconds. This is useful to see how the measured offset is behaving.
The chart also plots offset±rtt, where rtt is the round trip time to the server. NTP can not really know the offset of a remote chimer, NTP computes it by subtracting rtt/2 from the offset. Plotting the offset±rtt reverses this calculation to more easily see the effects of rtt changes.
Closer to 0s is better. An ideal system would be a horizontal line at 0s. Typical 90% ranges may be: local LAN server 80µs; 90% ranges for WAN server may be 4ms and much larger.
Clock Offset is field 5 in the peerstats log file. The Round Trip Time (rtt) is field 6 in the peerstats log file.
Server Offset 2402:1f00:8101:d6::1

| Percentiles...... | Ranges...... | Skew- | Kurt- | |||||||||||||
| Name | Min | 1% | 5% | 50% | 95% | 99% | Max | 90% | 98% | StdDev | Mean | Units | ness | osis | ||
| Server Offset 2402:1f00:8101:d6::1 | -36.205 | -6.436 | 12.070 | 35.428 | 47.477 | 49.168 | 69.786 | 35.407 | 55.604 | 12.669 | 33.985 | ms | -1.139 | 5.04 | ||
The offset of a server in seconds. This is useful to see how the measured offset is behaving.
The chart also plots offset±rtt, where rtt is the round trip time to the server. NTP can not really know the offset of a remote chimer, NTP computes it by subtracting rtt/2 from the offset. Plotting the offset±rtt reverses this calculation to more easily see the effects of rtt changes.
Closer to 0s is better. An ideal system would be a horizontal line at 0s. Typical 90% ranges may be: local LAN server 80µs; 90% ranges for WAN server may be 4ms and much larger.
Clock Offset is field 5 in the peerstats log file. The Round Trip Time (rtt) is field 6 in the peerstats log file.
Server Offset 240b:4004:108:200:8314:1a08:4cee:26d8

| Percentiles...... | Ranges...... | Skew- | Kurt- | |||||||||||||
| Name | Min | 1% | 5% | 50% | 95% | 99% | Max | 90% | 98% | StdDev | Mean | Units | ness | osis | ||
| Server Offset 240b:4004:108:200:8314:1a08:4cee:26d8 | -10.660 | -10.660 | -1.669 | 2.211 | 424.412 | 425.724 | 425.724 | 426.080 | 436.384 | 113.328 | 48.896 | ms | 2.876 | 9.733 | ||
The offset of a server in seconds. This is useful to see how the measured offset is behaving.
The chart also plots offset±rtt, where rtt is the round trip time to the server. NTP can not really know the offset of a remote chimer, NTP computes it by subtracting rtt/2 from the offset. Plotting the offset±rtt reverses this calculation to more easily see the effects of rtt changes.
Closer to 0s is better. An ideal system would be a horizontal line at 0s. Typical 90% ranges may be: local LAN server 80µs; 90% ranges for WAN server may be 4ms and much larger.
Clock Offset is field 5 in the peerstats log file. The Round Trip Time (rtt) is field 6 in the peerstats log file.
Server Offset 240b:4004:108:200:8314:1a08:4cee:26d9

| Percentiles...... | Ranges...... | Skew- | Kurt- | |||||||||||||
| Name | Min | 1% | 5% | 50% | 95% | 99% | Max | 90% | 98% | StdDev | Mean | Units | ness | osis | ||
| Server Offset 240b:4004:108:200:8314:1a08:4cee:26d9 | 3.332 | 3.332 | 3.332 | 5.399 | 14.354 | 14.354 | 14.354 | 11.022 | 11.022 | 4.410 | 6.823 | ms | 1.061 | 2.259 | ||
The offset of a server in seconds. This is useful to see how the measured offset is behaving.
The chart also plots offset±rtt, where rtt is the round trip time to the server. NTP can not really know the offset of a remote chimer, NTP computes it by subtracting rtt/2 from the offset. Plotting the offset±rtt reverses this calculation to more easily see the effects of rtt changes.
Closer to 0s is better. An ideal system would be a horizontal line at 0s. Typical 90% ranges may be: local LAN server 80µs; 90% ranges for WAN server may be 4ms and much larger.
Clock Offset is field 5 in the peerstats log file. The Round Trip Time (rtt) is field 6 in the peerstats log file.
Server Offset 240b:4004:108:200:8314:1a08:4cee:2acf

| Percentiles...... | Ranges...... | Skew- | Kurt- | |||||||||||||
| Name | Min | 1% | 5% | 50% | 95% | 99% | Max | 90% | 98% | StdDev | Mean | Units | ness | osis | ||
| Server Offset 240b:4004:108:200:8314:1a08:4cee:2acf | -55.272 | -55.272 | -55.272 | 0.474 | 2.640 | 2.640 | 2.640 | 57.912 | 57.912 | 17.808 | -5.000 | ms | -2.456 | 7.073 | ||
The offset of a server in seconds. This is useful to see how the measured offset is behaving.
The chart also plots offset±rtt, where rtt is the round trip time to the server. NTP can not really know the offset of a remote chimer, NTP computes it by subtracting rtt/2 from the offset. Plotting the offset±rtt reverses this calculation to more easily see the effects of rtt changes.
Closer to 0s is better. An ideal system would be a horizontal line at 0s. Typical 90% ranges may be: local LAN server 80µs; 90% ranges for WAN server may be 4ms and much larger.
Clock Offset is field 5 in the peerstats log file. The Round Trip Time (rtt) is field 6 in the peerstats log file.
Server Offset 2600:1702:80c0:9a80:1ee4:b0a2:44bc:c606

| Percentiles...... | Ranges...... | Skew- | Kurt- | |||||||||||||
| Name | Min | 1% | 5% | 50% | 95% | 99% | Max | 90% | 98% | StdDev | Mean | Units | ness | osis | ||
| Server Offset 2600:1702:80c0:9a80:1ee4:b0a2:44bc:c606 | 7.543 | 7.543 | 7.543 | 43.369 | 48.456 | 48.456 | 48.456 | 40.913 | 40.913 | 18.767 | 27.247 | ms | 0.02285 | 1.042 | ||
The offset of a server in seconds. This is useful to see how the measured offset is behaving.
The chart also plots offset±rtt, where rtt is the round trip time to the server. NTP can not really know the offset of a remote chimer, NTP computes it by subtracting rtt/2 from the offset. Plotting the offset±rtt reverses this calculation to more easily see the effects of rtt changes.
Closer to 0s is better. An ideal system would be a horizontal line at 0s. Typical 90% ranges may be: local LAN server 80µs; 90% ranges for WAN server may be 4ms and much larger.
Clock Offset is field 5 in the peerstats log file. The Round Trip Time (rtt) is field 6 in the peerstats log file.
Server Offset 2600:1900:4060:2e7:: (0.0.0.0.0.0.0.0.0.0.0.0.0.0.0.0.7.e.2.0.0.6.0.4.0.0.9.1.0.0.6.2.bc.googleusercontent.com)

| Percentiles...... | Ranges...... | Skew- | Kurt- | |||||||||||||
| Name | Min | 1% | 5% | 50% | 95% | 99% | Max | 90% | 98% | StdDev | Mean | Units | ness | osis | ||
| Server Offset 2600:1900:4060:2e7:: (0.0.0.0.0.0.0.0.0.0.0.0.0.0.0.0.7.e.2.0.0.6.0.4.0.0.9.1.0.0.6.2.bc.googleusercontent.com) | -90.591 | -30.497 | -16.610 | 2.198 | 7.128 | 11.479 | 312.713 | 23.738 | 41.976 | 8.531 | 0.406 | ms | 1.915 | 169.9 | ||
The offset of a server in seconds. This is useful to see how the measured offset is behaving.
The chart also plots offset±rtt, where rtt is the round trip time to the server. NTP can not really know the offset of a remote chimer, NTP computes it by subtracting rtt/2 from the offset. Plotting the offset±rtt reverses this calculation to more easily see the effects of rtt changes.
Closer to 0s is better. An ideal system would be a horizontal line at 0s. Typical 90% ranges may be: local LAN server 80µs; 90% ranges for WAN server may be 4ms and much larger.
Clock Offset is field 5 in the peerstats log file. The Round Trip Time (rtt) is field 6 in the peerstats log file.
Server Offset 2600:1f13:2c1:2e00::be00:5

| Percentiles...... | Ranges...... | Skew- | Kurt- | |||||||||||||
| Name | Min | 1% | 5% | 50% | 95% | 99% | Max | 90% | 98% | StdDev | Mean | Units | ness | osis | ||
| Server Offset 2600:1f13:2c1:2e00::be00:5 | 1.672 | 1.672 | 1.672 | 5.591 | 19.969 | 19.969 | 19.969 | 18.297 | 18.297 | 5.131 | 6.284 | ms | 1.945 | 5.754 | ||
The offset of a server in seconds. This is useful to see how the measured offset is behaving.
The chart also plots offset±rtt, where rtt is the round trip time to the server. NTP can not really know the offset of a remote chimer, NTP computes it by subtracting rtt/2 from the offset. Plotting the offset±rtt reverses this calculation to more easily see the effects of rtt changes.
Closer to 0s is better. An ideal system would be a horizontal line at 0s. Typical 90% ranges may be: local LAN server 80µs; 90% ranges for WAN server may be 4ms and much larger.
Clock Offset is field 5 in the peerstats log file. The Round Trip Time (rtt) is field 6 in the peerstats log file.
Server Offset 2600:1f13:eda:9800:bcd8:839c:9b40:25b2 (oregon.time.system76.com)

| Percentiles...... | Ranges...... | Skew- | Kurt- | |||||||||||||
| Name | Min | 1% | 5% | 50% | 95% | 99% | Max | 90% | 98% | StdDev | Mean | Units | ness | osis | ||
| Server Offset 2600:1f13:eda:9800:bcd8:839c:9b40:25b2 (oregon.time.system76.com) | -155.691 | -7.428 | -5.748 | 3.095 | 6.249 | 8.012 | 110.743 | 11.997 | 15.440 | 4.982 | 1.630 | ms | -2.631 | 231.8 | ||
The offset of a server in seconds. This is useful to see how the measured offset is behaving.
The chart also plots offset±rtt, where rtt is the round trip time to the server. NTP can not really know the offset of a remote chimer, NTP computes it by subtracting rtt/2 from the offset. Plotting the offset±rtt reverses this calculation to more easily see the effects of rtt changes.
Closer to 0s is better. An ideal system would be a horizontal line at 0s. Typical 90% ranges may be: local LAN server 80µs; 90% ranges for WAN server may be 4ms and much larger.
Clock Offset is field 5 in the peerstats log file. The Round Trip Time (rtt) is field 6 in the peerstats log file.
Server Offset 2600:1f16:42a:1d00:2169:fe07:2acc:6002 (ohio.time.system76.com)

| Percentiles...... | Ranges...... | Skew- | Kurt- | |||||||||||||
| Name | Min | 1% | 5% | 50% | 95% | 99% | Max | 90% | 98% | StdDev | Mean | Units | ness | osis | ||
| Server Offset 2600:1f16:42a:1d00:2169:fe07:2acc:6002 (ohio.time.system76.com) | -159.116 | -7.011 | -3.874 | 3.436 | 6.636 | 8.466 | 422.200 | 10.510 | 15.477 | 6.435 | 2.487 | ms | 19.37 | 1687 | ||
The offset of a server in seconds. This is useful to see how the measured offset is behaving.
The chart also plots offset±rtt, where rtt is the round trip time to the server. NTP can not really know the offset of a remote chimer, NTP computes it by subtracting rtt/2 from the offset. Plotting the offset±rtt reverses this calculation to more easily see the effects of rtt changes.
Closer to 0s is better. An ideal system would be a horizontal line at 0s. Typical 90% ranges may be: local LAN server 80µs; 90% ranges for WAN server may be 4ms and much larger.
Clock Offset is field 5 in the peerstats log file. The Round Trip Time (rtt) is field 6 in the peerstats log file.
Server Offset 2600:1f18:4c51:e200:e142:210a:306d:4872 (virginia.time.system76.com)

| Percentiles...... | Ranges...... | Skew- | Kurt- | |||||||||||||
| Name | Min | 1% | 5% | 50% | 95% | 99% | Max | 90% | 98% | StdDev | Mean | Units | ness | osis | ||
| Server Offset 2600:1f18:4c51:e200:e142:210a:306d:4872 (virginia.time.system76.com) | -158.177 | -23.589 | -6.049 | 3.796 | 7.392 | 10.039 | 415.823 | 13.440 | 33.628 | 7.751 | 2.204 | ms | 10.06 | 762.3 | ||
The offset of a server in seconds. This is useful to see how the measured offset is behaving.
The chart also plots offset±rtt, where rtt is the round trip time to the server. NTP can not really know the offset of a remote chimer, NTP computes it by subtracting rtt/2 from the offset. Plotting the offset±rtt reverses this calculation to more easily see the effects of rtt changes.
Closer to 0s is better. An ideal system would be a horizontal line at 0s. Typical 90% ranges may be: local LAN server 80µs; 90% ranges for WAN server may be 4ms and much larger.
Clock Offset is field 5 in the peerstats log file. The Round Trip Time (rtt) is field 6 in the peerstats log file.
Server Offset 2600:1f18:7927:8b00:123::

| Percentiles...... | Ranges...... | Skew- | Kurt- | |||||||||||||
| Name | Min | 1% | 5% | 50% | 95% | 99% | Max | 90% | 98% | StdDev | Mean | Units | ness | osis | ||
| Server Offset 2600:1f18:7927:8b00:123:: | 4.710 | 4.710 | 4.710 | 6.720 | 8.399 | 8.399 | 8.399 | 3.689 | 3.689 | 1.160 | 6.461 | ms | 0.06963 | 2.058 | ||
The offset of a server in seconds. This is useful to see how the measured offset is behaving.
The chart also plots offset±rtt, where rtt is the round trip time to the server. NTP can not really know the offset of a remote chimer, NTP computes it by subtracting rtt/2 from the offset. Plotting the offset±rtt reverses this calculation to more easily see the effects of rtt changes.
Closer to 0s is better. An ideal system would be a horizontal line at 0s. Typical 90% ranges may be: local LAN server 80µs; 90% ranges for WAN server may be 4ms and much larger.
Clock Offset is field 5 in the peerstats log file. The Round Trip Time (rtt) is field 6 in the peerstats log file.
Server Offset 2600:3c00:e000:318::1 (jane.qotw.net)

| Percentiles...... | Ranges...... | Skew- | Kurt- | |||||||||||||
| Name | Min | 1% | 5% | 50% | 95% | 99% | Max | 90% | 98% | StdDev | Mean | Units | ness | osis | ||
| Server Offset 2600:3c00:e000:318::1 (jane.qotw.net) | 0.897 | 0.897 | 0.897 | 7.015 | 9.022 | 9.022 | 9.022 | 8.126 | 8.126 | 2.823 | 5.475 | ms | -0.456 | 1.786 | ||
The offset of a server in seconds. This is useful to see how the measured offset is behaving.
The chart also plots offset±rtt, where rtt is the round trip time to the server. NTP can not really know the offset of a remote chimer, NTP computes it by subtracting rtt/2 from the offset. Plotting the offset±rtt reverses this calculation to more easily see the effects of rtt changes.
Closer to 0s is better. An ideal system would be a horizontal line at 0s. Typical 90% ranges may be: local LAN server 80µs; 90% ranges for WAN server may be 4ms and much larger.
Clock Offset is field 5 in the peerstats log file. The Round Trip Time (rtt) is field 6 in the peerstats log file.
Server Offset 2600:3c01::f03c:93ff:fe5b:8a7d (us-west-1.clearnet.pw)

| Percentiles...... | Ranges...... | Skew- | Kurt- | |||||||||||||
| Name | Min | 1% | 5% | 50% | 95% | 99% | Max | 90% | 98% | StdDev | Mean | Units | ness | osis | ||
| Server Offset 2600:3c01::f03c:93ff:fe5b:8a7d (us-west-1.clearnet.pw) | 2.725 | 2.725 | 2.725 | 5.114 | 14.625 | 14.625 | 14.625 | 11.900 | 11.900 | 4.070 | 5.808 | ms | 1.545 | 3.777 | ||
The offset of a server in seconds. This is useful to see how the measured offset is behaving.
The chart also plots offset±rtt, where rtt is the round trip time to the server. NTP can not really know the offset of a remote chimer, NTP computes it by subtracting rtt/2 from the offset. Plotting the offset±rtt reverses this calculation to more easily see the effects of rtt changes.
Closer to 0s is better. An ideal system would be a horizontal line at 0s. Typical 90% ranges may be: local LAN server 80µs; 90% ranges for WAN server may be 4ms and much larger.
Clock Offset is field 5 in the peerstats log file. The Round Trip Time (rtt) is field 6 in the peerstats log file.
Server Offset 2600:3c01::f03c:93ff:fedd:5a1f (sensei.ruselabs.com)

| Percentiles...... | Ranges...... | Skew- | Kurt- | |||||||||||||
| Name | Min | 1% | 5% | 50% | 95% | 99% | Max | 90% | 98% | StdDev | Mean | Units | ness | osis | ||
| Server Offset 2600:3c01::f03c:93ff:fedd:5a1f (sensei.ruselabs.com) | -16.936 | -16.936 | -5.885 | 2.642 | 423.840 | 424.816 | 424.816 | 429.725 | 441.752 | 116.114 | 50.434 | ms | 2.724 | 8.986 | ||
The offset of a server in seconds. This is useful to see how the measured offset is behaving.
The chart also plots offset±rtt, where rtt is the round trip time to the server. NTP can not really know the offset of a remote chimer, NTP computes it by subtracting rtt/2 from the offset. Plotting the offset±rtt reverses this calculation to more easily see the effects of rtt changes.
Closer to 0s is better. An ideal system would be a horizontal line at 0s. Typical 90% ranges may be: local LAN server 80µs; 90% ranges for WAN server may be 4ms and much larger.
Clock Offset is field 5 in the peerstats log file. The Round Trip Time (rtt) is field 6 in the peerstats log file.
Server Offset 2600:3c01:e000:7e6::123 (time1.sigi.net)

| Percentiles...... | Ranges...... | Skew- | Kurt- | |||||||||||||
| Name | Min | 1% | 5% | 50% | 95% | 99% | Max | 90% | 98% | StdDev | Mean | Units | ness | osis | ||
| Server Offset 2600:3c01:e000:7e6::123 (time1.sigi.net) | -1.578 | -1.578 | -1.405 | 3.186 | 8.862 | 9.541 | 9.541 | 10.268 | 11.119 | 3.175 | 3.561 | ms | 0.1796 | 1.906 | ||
The offset of a server in seconds. This is useful to see how the measured offset is behaving.
The chart also plots offset±rtt, where rtt is the round trip time to the server. NTP can not really know the offset of a remote chimer, NTP computes it by subtracting rtt/2 from the offset. Plotting the offset±rtt reverses this calculation to more easily see the effects of rtt changes.
Closer to 0s is better. An ideal system would be a horizontal line at 0s. Typical 90% ranges may be: local LAN server 80µs; 90% ranges for WAN server may be 4ms and much larger.
Clock Offset is field 5 in the peerstats log file. The Round Trip Time (rtt) is field 6 in the peerstats log file.
Server Offset 2600:3c02::f03c:94ff:fe59:f411

| Percentiles...... | Ranges...... | Skew- | Kurt- | |||||||||||||
| Name | Min | 1% | 5% | 50% | 95% | 99% | Max | 90% | 98% | StdDev | Mean | Units | ness | osis | ||
| Server Offset 2600:3c02::f03c:94ff:fe59:f411 | 3.748 | 3.748 | 3.748 | 6.064 | 12.748 | 12.748 | 12.748 | 9.000 | 9.000 | 3.879 | 7.163 | ms | 0.6006 | 1.484 | ||
The offset of a server in seconds. This is useful to see how the measured offset is behaving.
The chart also plots offset±rtt, where rtt is the round trip time to the server. NTP can not really know the offset of a remote chimer, NTP computes it by subtracting rtt/2 from the offset. Plotting the offset±rtt reverses this calculation to more easily see the effects of rtt changes.
Closer to 0s is better. An ideal system would be a horizontal line at 0s. Typical 90% ranges may be: local LAN server 80µs; 90% ranges for WAN server may be 4ms and much larger.
Clock Offset is field 5 in the peerstats log file. The Round Trip Time (rtt) is field 6 in the peerstats log file.
Server Offset 2600:3c03::f03c:91ff:fedf:1e98 (li1.forfun.net)

| Percentiles...... | Ranges...... | Skew- | Kurt- | |||||||||||||
| Name | Min | 1% | 5% | 50% | 95% | 99% | Max | 90% | 98% | StdDev | Mean | Units | ness | osis | ||
| Server Offset 2600:3c03::f03c:91ff:fedf:1e98 (li1.forfun.net) | -24.915 | -24.915 | -24.915 | 67.309 | 423.497 | 423.497 | 423.497 | 448.412 | 448.412 | 136.652 | 85.591 | ms | 1.84 | 4.92 | ||
The offset of a server in seconds. This is useful to see how the measured offset is behaving.
The chart also plots offset±rtt, where rtt is the round trip time to the server. NTP can not really know the offset of a remote chimer, NTP computes it by subtracting rtt/2 from the offset. Plotting the offset±rtt reverses this calculation to more easily see the effects of rtt changes.
Closer to 0s is better. An ideal system would be a horizontal line at 0s. Typical 90% ranges may be: local LAN server 80µs; 90% ranges for WAN server may be 4ms and much larger.
Clock Offset is field 5 in the peerstats log file. The Round Trip Time (rtt) is field 6 in the peerstats log file.
Server Offset 2600:3c06::f03c:94ff:fee2:9c28

| Percentiles...... | Ranges...... | Skew- | Kurt- | |||||||||||||
| Name | Min | 1% | 5% | 50% | 95% | 99% | Max | 90% | 98% | StdDev | Mean | Units | ness | osis | ||
| Server Offset 2600:3c06::f03c:94ff:fee2:9c28 | 5.742 | 5.742 | 5.742 | 7.946 | 15.389 | 15.389 | 15.389 | 9.646 | 9.646 | 3.904 | 8.785 | ms | 1.004 | 2.198 | ||
The offset of a server in seconds. This is useful to see how the measured offset is behaving.
The chart also plots offset±rtt, where rtt is the round trip time to the server. NTP can not really know the offset of a remote chimer, NTP computes it by subtracting rtt/2 from the offset. Plotting the offset±rtt reverses this calculation to more easily see the effects of rtt changes.
Closer to 0s is better. An ideal system would be a horizontal line at 0s. Typical 90% ranges may be: local LAN server 80µs; 90% ranges for WAN server may be 4ms and much larger.
Clock Offset is field 5 in the peerstats log file. The Round Trip Time (rtt) is field 6 in the peerstats log file.
Server Offset 2600:3c06::f03c:94ff:fee2:c53a

| Percentiles...... | Ranges...... | Skew- | Kurt- | |||||||||||||
| Name | Min | 1% | 5% | 50% | 95% | 99% | Max | 90% | 98% | StdDev | Mean | Units | ness | osis | ||
| Server Offset 2600:3c06::f03c:94ff:fee2:c53a | 7.934 | 7.934 | 7.934 | 10.652 | 34.769 | 34.769 | 34.769 | 26.835 | 26.835 | 12.061 | 17.785 | ms | 0.6803 | 1.5 | ||
The offset of a server in seconds. This is useful to see how the measured offset is behaving.
The chart also plots offset±rtt, where rtt is the round trip time to the server. NTP can not really know the offset of a remote chimer, NTP computes it by subtracting rtt/2 from the offset. Plotting the offset±rtt reverses this calculation to more easily see the effects of rtt changes.
Closer to 0s is better. An ideal system would be a horizontal line at 0s. Typical 90% ranges may be: local LAN server 80µs; 90% ranges for WAN server may be 4ms and much larger.
Clock Offset is field 5 in the peerstats log file. The Round Trip Time (rtt) is field 6 in the peerstats log file.
Server Offset 2602:2b7:d11:f4::122 (s2-b.time.mci1.us.rozint.net)

| Percentiles...... | Ranges...... | Skew- | Kurt- | |||||||||||||
| Name | Min | 1% | 5% | 50% | 95% | 99% | Max | 90% | 98% | StdDev | Mean | Units | ness | osis | ||
| Server Offset 2602:2b7:d11:f4::122 (s2-b.time.mci1.us.rozint.net) | -158.684 | -158.684 | -158.684 | 0.437 | 10.845 | 10.845 | 10.845 | 169.529 | 169.529 | 64.330 | -32.192 | ms | -1.378 | 2.929 | ||
The offset of a server in seconds. This is useful to see how the measured offset is behaving.
The chart also plots offset±rtt, where rtt is the round trip time to the server. NTP can not really know the offset of a remote chimer, NTP computes it by subtracting rtt/2 from the offset. Plotting the offset±rtt reverses this calculation to more easily see the effects of rtt changes.
Closer to 0s is better. An ideal system would be a horizontal line at 0s. Typical 90% ranges may be: local LAN server 80µs; 90% ranges for WAN server may be 4ms and much larger.
Clock Offset is field 5 in the peerstats log file. The Round Trip Time (rtt) is field 6 in the peerstats log file.
Server Offset 2602:80b:5000::36 (time.meme.holdings)

| Percentiles...... | Ranges...... | Skew- | Kurt- | |||||||||||||
| Name | Min | 1% | 5% | 50% | 95% | 99% | Max | 90% | 98% | StdDev | Mean | Units | ness | osis | ||
| Server Offset 2602:80b:5000::36 (time.meme.holdings) | -26.339 | -9.392 | 1.266 | 5.868 | 9.817 | 23.455 | 24.890 | 8.551 | 32.847 | 4.663 | 5.601 | ms | -1.967 | 22.8 | ||
The offset of a server in seconds. This is useful to see how the measured offset is behaving.
The chart also plots offset±rtt, where rtt is the round trip time to the server. NTP can not really know the offset of a remote chimer, NTP computes it by subtracting rtt/2 from the offset. Plotting the offset±rtt reverses this calculation to more easily see the effects of rtt changes.
Closer to 0s is better. An ideal system would be a horizontal line at 0s. Typical 90% ranges may be: local LAN server 80µs; 90% ranges for WAN server may be 4ms and much larger.
Clock Offset is field 5 in the peerstats log file. The Round Trip Time (rtt) is field 6 in the peerstats log file.
Server Offset 2602:81b:9000::c10c (time.sea.ordinaladvisors.com)

| Percentiles...... | Ranges...... | Skew- | Kurt- | |||||||||||||
| Name | Min | 1% | 5% | 50% | 95% | 99% | Max | 90% | 98% | StdDev | Mean | Units | ness | osis | ||
| Server Offset 2602:81b:9000::c10c (time.sea.ordinaladvisors.com) | -2.396 | -2.396 | -2.396 | 0.748 | 11.083 | 11.083 | 11.083 | 13.479 | 13.479 | 3.735 | 2.173 | ms | 1.096 | 3.17 | ||
The offset of a server in seconds. This is useful to see how the measured offset is behaving.
The chart also plots offset±rtt, where rtt is the round trip time to the server. NTP can not really know the offset of a remote chimer, NTP computes it by subtracting rtt/2 from the offset. Plotting the offset±rtt reverses this calculation to more easily see the effects of rtt changes.
Closer to 0s is better. An ideal system would be a horizontal line at 0s. Typical 90% ranges may be: local LAN server 80µs; 90% ranges for WAN server may be 4ms and much larger.
Clock Offset is field 5 in the peerstats log file. The Round Trip Time (rtt) is field 6 in the peerstats log file.
Server Offset 2602:f590::23:161:104:133 (isere.sd.ysun.co)

| Percentiles...... | Ranges...... | Skew- | Kurt- | |||||||||||||
| Name | Min | 1% | 5% | 50% | 95% | 99% | Max | 90% | 98% | StdDev | Mean | Units | ness | osis | ||
| Server Offset 2602:f590::23:161:104:133 (isere.sd.ysun.co) | -471.581 | -385.176 | -54.827 | -11.476 | 0.126 | 5.242 | 28.182 | 54.953 | 390.419 | 61.385 | -26.183 | ms | -5.774 | 37.6 | ||
The offset of a server in seconds. This is useful to see how the measured offset is behaving.
The chart also plots offset±rtt, where rtt is the round trip time to the server. NTP can not really know the offset of a remote chimer, NTP computes it by subtracting rtt/2 from the offset. Plotting the offset±rtt reverses this calculation to more easily see the effects of rtt changes.
Closer to 0s is better. An ideal system would be a horizontal line at 0s. Typical 90% ranges may be: local LAN server 80µs; 90% ranges for WAN server may be 4ms and much larger.
Clock Offset is field 5 in the peerstats log file. The Round Trip Time (rtt) is field 6 in the peerstats log file.
Server Offset 2602:f9ba:69::210 (as393746.mci.trtnw.net)

| Percentiles...... | Ranges...... | Skew- | Kurt- | |||||||||||||
| Name | Min | 1% | 5% | 50% | 95% | 99% | Max | 90% | 98% | StdDev | Mean | Units | ness | osis | ||
| Server Offset 2602:f9ba:69::210 (as393746.mci.trtnw.net) | -12.175 | -1.360 | 4.707 | 9.530 | 16.745 | 20.179 | 20.349 | 12.038 | 21.539 | 4.125 | 9.733 | ms | -0.5412 | 8.171 | ||
The offset of a server in seconds. This is useful to see how the measured offset is behaving.
The chart also plots offset±rtt, where rtt is the round trip time to the server. NTP can not really know the offset of a remote chimer, NTP computes it by subtracting rtt/2 from the offset. Plotting the offset±rtt reverses this calculation to more easily see the effects of rtt changes.
Closer to 0s is better. An ideal system would be a horizontal line at 0s. Typical 90% ranges may be: local LAN server 80µs; 90% ranges for WAN server may be 4ms and much larger.
Clock Offset is field 5 in the peerstats log file. The Round Trip Time (rtt) is field 6 in the peerstats log file.
Server Offset 2602:fb95:16::123 (time5.sigi.net)

| Percentiles...... | Ranges...... | Skew- | Kurt- | |||||||||||||
| Name | Min | 1% | 5% | 50% | 95% | 99% | Max | 90% | 98% | StdDev | Mean | Units | ness | osis | ||
| Server Offset 2602:fb95:16::123 (time5.sigi.net) | -3.415 | -3.415 | -3.415 | 2.197 | 8.657 | 8.657 | 8.657 | 12.072 | 12.072 | 3.322 | 1.725 | ms | 0.2884 | 2.931 | ||
The offset of a server in seconds. This is useful to see how the measured offset is behaving.
The chart also plots offset±rtt, where rtt is the round trip time to the server. NTP can not really know the offset of a remote chimer, NTP computes it by subtracting rtt/2 from the offset. Plotting the offset±rtt reverses this calculation to more easily see the effects of rtt changes.
Closer to 0s is better. An ideal system would be a horizontal line at 0s. Typical 90% ranges may be: local LAN server 80µs; 90% ranges for WAN server may be 4ms and much larger.
Clock Offset is field 5 in the peerstats log file. The Round Trip Time (rtt) is field 6 in the peerstats log file.
Server Offset 2602:fd50:100:108:3491:d3b2:eef8:f324 (ntp.netlinkify.com)

| Percentiles...... | Ranges...... | Skew- | Kurt- | |||||||||||||
| Name | Min | 1% | 5% | 50% | 95% | 99% | Max | 90% | 98% | StdDev | Mean | Units | ness | osis | ||
| Server Offset 2602:fd50:100:108:3491:d3b2:eef8:f324 (ntp.netlinkify.com) | -2.937 | -2.937 | -1.379 | 2.434 | 7.512 | 9.493 | 9.493 | 8.892 | 12.430 | 2.905 | 2.389 | ms | 0.4696 | 3.021 | ||
The offset of a server in seconds. This is useful to see how the measured offset is behaving.
The chart also plots offset±rtt, where rtt is the round trip time to the server. NTP can not really know the offset of a remote chimer, NTP computes it by subtracting rtt/2 from the offset. Plotting the offset±rtt reverses this calculation to more easily see the effects of rtt changes.
Closer to 0s is better. An ideal system would be a horizontal line at 0s. Typical 90% ranges may be: local LAN server 80µs; 90% ranges for WAN server may be 4ms and much larger.
Clock Offset is field 5 in the peerstats log file. The Round Trip Time (rtt) is field 6 in the peerstats log file.
Server Offset 2602:fe2e:3:d:f9:c7ff:fef5:379c (ntp.ny1.neptunenetworks.net)

| Percentiles...... | Ranges...... | Skew- | Kurt- | |||||||||||||
| Name | Min | 1% | 5% | 50% | 95% | 99% | Max | 90% | 98% | StdDev | Mean | Units | ness | osis | ||
| Server Offset 2602:fe2e:3:d:f9:c7ff:fef5:379c (ntp.ny1.neptunenetworks.net) | 3.035 | 3.035 | 3.035 | 6.211 | 8.657 | 8.657 | 8.657 | 5.622 | 5.622 | 1.762 | 5.927 | ms | -0.1747 | 2.107 | ||
The offset of a server in seconds. This is useful to see how the measured offset is behaving.
The chart also plots offset±rtt, where rtt is the round trip time to the server. NTP can not really know the offset of a remote chimer, NTP computes it by subtracting rtt/2 from the offset. Plotting the offset±rtt reverses this calculation to more easily see the effects of rtt changes.
Closer to 0s is better. An ideal system would be a horizontal line at 0s. Typical 90% ranges may be: local LAN server 80µs; 90% ranges for WAN server may be 4ms and much larger.
Clock Offset is field 5 in the peerstats log file. The Round Trip Time (rtt) is field 6 in the peerstats log file.
Server Offset 2603:c020:0:8369:1111:1111:1111:1112

| Percentiles...... | Ranges...... | Skew- | Kurt- | |||||||||||||
| Name | Min | 1% | 5% | 50% | 95% | 99% | Max | 90% | 98% | StdDev | Mean | Units | ness | osis | ||
| Server Offset 2603:c020:0:8369:1111:1111:1111:1112 | -11.664 | -11.664 | -11.664 | -7.858 | 36.147 | 36.147 | 36.147 | 47.810 | 47.810 | 11.106 | -4.696 | ms | 3.087 | 11.48 | ||
The offset of a server in seconds. This is useful to see how the measured offset is behaving.
The chart also plots offset±rtt, where rtt is the round trip time to the server. NTP can not really know the offset of a remote chimer, NTP computes it by subtracting rtt/2 from the offset. Plotting the offset±rtt reverses this calculation to more easily see the effects of rtt changes.
Closer to 0s is better. An ideal system would be a horizontal line at 0s. Typical 90% ranges may be: local LAN server 80µs; 90% ranges for WAN server may be 4ms and much larger.
Clock Offset is field 5 in the peerstats log file. The Round Trip Time (rtt) is field 6 in the peerstats log file.
Server Offset 2603:c020:0:8369::bad:beef

| Percentiles...... | Ranges...... | Skew- | Kurt- | |||||||||||||
| Name | Min | 1% | 5% | 50% | 95% | 99% | Max | 90% | 98% | StdDev | Mean | Units | ness | osis | ||
| Server Offset 2603:c020:0:8369::bad:beef | -6.830 | -6.830 | -6.830 | -3.090 | -2.867 | -2.867 | -2.867 | 3.963 | 3.963 | 1.885 | -4.862 | ms | 0.002145 | 1.011 | ||
The offset of a server in seconds. This is useful to see how the measured offset is behaving.
The chart also plots offset±rtt, where rtt is the round trip time to the server. NTP can not really know the offset of a remote chimer, NTP computes it by subtracting rtt/2 from the offset. Plotting the offset±rtt reverses this calculation to more easily see the effects of rtt changes.
Closer to 0s is better. An ideal system would be a horizontal line at 0s. Typical 90% ranges may be: local LAN server 80µs; 90% ranges for WAN server may be 4ms and much larger.
Clock Offset is field 5 in the peerstats log file. The Round Trip Time (rtt) is field 6 in the peerstats log file.
Server Offset 2603:c020:0:8369:feed:feed:feed:feed

| Percentiles...... | Ranges...... | Skew- | Kurt- | |||||||||||||
| Name | Min | 1% | 5% | 50% | 95% | 99% | Max | 90% | 98% | StdDev | Mean | Units | ness | osis | ||
| Server Offset 2603:c020:0:8369:feed:feed:feed:feed | -18.686 | -18.686 | -18.686 | -5.954 | -5.363 | -5.363 | -5.363 | 13.323 | 13.323 | 6.146 | -10.001 | ms | -0.7022 | 1.5 | ||
The offset of a server in seconds. This is useful to see how the measured offset is behaving.
The chart also plots offset±rtt, where rtt is the round trip time to the server. NTP can not really know the offset of a remote chimer, NTP computes it by subtracting rtt/2 from the offset. Plotting the offset±rtt reverses this calculation to more easily see the effects of rtt changes.
Closer to 0s is better. An ideal system would be a horizontal line at 0s. Typical 90% ranges may be: local LAN server 80µs; 90% ranges for WAN server may be 4ms and much larger.
Clock Offset is field 5 in the peerstats log file. The Round Trip Time (rtt) is field 6 in the peerstats log file.
Server Offset 2603:c024:c005:a600:efb6:d213:cad8:251d

| Percentiles...... | Ranges...... | Skew- | Kurt- | |||||||||||||
| Name | Min | 1% | 5% | 50% | 95% | 99% | Max | 90% | 98% | StdDev | Mean | Units | ness | osis | ||
| Server Offset 2603:c024:c005:a600:efb6:d213:cad8:251d | 1.713 | 1.713 | 1.713 | 11.865 | 68.213 | 68.213 | 68.213 | 66.499 | 66.499 | 21.793 | 19.547 | ms | 1.448 | 3.682 | ||
The offset of a server in seconds. This is useful to see how the measured offset is behaving.
The chart also plots offset±rtt, where rtt is the round trip time to the server. NTP can not really know the offset of a remote chimer, NTP computes it by subtracting rtt/2 from the offset. Plotting the offset±rtt reverses this calculation to more easily see the effects of rtt changes.
Closer to 0s is better. An ideal system would be a horizontal line at 0s. Typical 90% ranges may be: local LAN server 80µs; 90% ranges for WAN server may be 4ms and much larger.
Clock Offset is field 5 in the peerstats log file. The Round Trip Time (rtt) is field 6 in the peerstats log file.
Server Offset 2604:8800:52:81:38:229:52:9 (ntp08.cymru.com)

| Percentiles...... | Ranges...... | Skew- | Kurt- | |||||||||||||
| Name | Min | 1% | 5% | 50% | 95% | 99% | Max | 90% | 98% | StdDev | Mean | Units | ness | osis | ||
| Server Offset 2604:8800:52:81:38:229:52:9 (ntp08.cymru.com) | 4.759 | 4.759 | 4.759 | 5.795 | 36.164 | 36.164 | 36.164 | 31.405 | 31.405 | 14.567 | 15.573 | ms | 0.7044 | 1.5 | ||
The offset of a server in seconds. This is useful to see how the measured offset is behaving.
The chart also plots offset±rtt, where rtt is the round trip time to the server. NTP can not really know the offset of a remote chimer, NTP computes it by subtracting rtt/2 from the offset. Plotting the offset±rtt reverses this calculation to more easily see the effects of rtt changes.
Closer to 0s is better. An ideal system would be a horizontal line at 0s. Typical 90% ranges may be: local LAN server 80µs; 90% ranges for WAN server may be 4ms and much larger.
Clock Offset is field 5 in the peerstats log file. The Round Trip Time (rtt) is field 6 in the peerstats log file.
Server Offset 2604:a880:400:d0::4ed:f001 (unifi.versadns.com)

| Percentiles...... | Ranges...... | Skew- | Kurt- | |||||||||||||
| Name | Min | 1% | 5% | 50% | 95% | 99% | Max | 90% | 98% | StdDev | Mean | Units | ness | osis | ||
| Server Offset 2604:a880:400:d0::4ed:f001 (unifi.versadns.com) | 8.916 | 8.916 | 8.916 | 14.499 | 37.032 | 37.032 | 37.032 | 28.115 | 28.115 | 8.702 | 16.497 | ms | 1.735 | 4.537 | ||
The offset of a server in seconds. This is useful to see how the measured offset is behaving.
The chart also plots offset±rtt, where rtt is the round trip time to the server. NTP can not really know the offset of a remote chimer, NTP computes it by subtracting rtt/2 from the offset. Plotting the offset±rtt reverses this calculation to more easily see the effects of rtt changes.
Closer to 0s is better. An ideal system would be a horizontal line at 0s. Typical 90% ranges may be: local LAN server 80µs; 90% ranges for WAN server may be 4ms and much larger.
Clock Offset is field 5 in the peerstats log file. The Round Trip Time (rtt) is field 6 in the peerstats log file.
Server Offset 2604:a880:800:10::70f:b001 (ellone.fdisk.io)

| Percentiles...... | Ranges...... | Skew- | Kurt- | |||||||||||||
| Name | Min | 1% | 5% | 50% | 95% | 99% | Max | 90% | 98% | StdDev | Mean | Units | ness | osis | ||
| Server Offset 2604:a880:800:10::70f:b001 (ellone.fdisk.io) | 3.373 | 3.373 | 3.373 | 8.241 | 9.581 | 9.581 | 9.581 | 6.208 | 6.208 | 1.791 | 7.376 | ms | -0.8255 | 2.41 | ||
The offset of a server in seconds. This is useful to see how the measured offset is behaving.
The chart also plots offset±rtt, where rtt is the round trip time to the server. NTP can not really know the offset of a remote chimer, NTP computes it by subtracting rtt/2 from the offset. Plotting the offset±rtt reverses this calculation to more easily see the effects of rtt changes.
Closer to 0s is better. An ideal system would be a horizontal line at 0s. Typical 90% ranges may be: local LAN server 80µs; 90% ranges for WAN server may be 4ms and much larger.
Clock Offset is field 5 in the peerstats log file. The Round Trip Time (rtt) is field 6 in the peerstats log file.
Server Offset 2604:a880:800:a1::ec9:5001

| Percentiles...... | Ranges...... | Skew- | Kurt- | |||||||||||||
| Name | Min | 1% | 5% | 50% | 95% | 99% | Max | 90% | 98% | StdDev | Mean | Units | ness | osis | ||
| Server Offset 2604:a880:800:a1::ec9:5001 | -127.479 | -127.479 | -127.479 | 2.162 | 41.342 | 41.342 | 41.342 | 168.821 | 168.821 | 39.256 | 0.196 | ms | -2.482 | 8.766 | ||
The offset of a server in seconds. This is useful to see how the measured offset is behaving.
The chart also plots offset±rtt, where rtt is the round trip time to the server. NTP can not really know the offset of a remote chimer, NTP computes it by subtracting rtt/2 from the offset. Plotting the offset±rtt reverses this calculation to more easily see the effects of rtt changes.
Closer to 0s is better. An ideal system would be a horizontal line at 0s. Typical 90% ranges may be: local LAN server 80µs; 90% ranges for WAN server may be 4ms and much larger.
Clock Offset is field 5 in the peerstats log file. The Round Trip Time (rtt) is field 6 in the peerstats log file.
Server Offset 2604:d200::39 (white.web-ster.com)

| Percentiles...... | Ranges...... | Skew- | Kurt- | |||||||||||||
| Name | Min | 1% | 5% | 50% | 95% | 99% | Max | 90% | 98% | StdDev | Mean | Units | ness | osis | ||
| Server Offset 2604:d200::39 (white.web-ster.com) | -6.544 | -6.544 | -4.662 | -2.901 | 28.557 | 30.956 | 30.956 | 33.219 | 37.499 | 9.313 | 0.132 | ms | 2.757 | 9.021 | ||
The offset of a server in seconds. This is useful to see how the measured offset is behaving.
The chart also plots offset±rtt, where rtt is the round trip time to the server. NTP can not really know the offset of a remote chimer, NTP computes it by subtracting rtt/2 from the offset. Plotting the offset±rtt reverses this calculation to more easily see the effects of rtt changes.
Closer to 0s is better. An ideal system would be a horizontal line at 0s. Typical 90% ranges may be: local LAN server 80µs; 90% ranges for WAN server may be 4ms and much larger.
Clock Offset is field 5 in the peerstats log file. The Round Trip Time (rtt) is field 6 in the peerstats log file.
Server Offset 2605:4840:3:fb19::1 (chi3.us.ntp.li)

| Percentiles...... | Ranges...... | Skew- | Kurt- | |||||||||||||
| Name | Min | 1% | 5% | 50% | 95% | 99% | Max | 90% | 98% | StdDev | Mean | Units | ness | osis | ||
| Server Offset 2605:4840:3:fb19::1 (chi3.us.ntp.li) | -3.852 | -3.852 | -3.852 | -0.420 | 1.987 | 1.987 | 1.987 | 5.839 | 5.839 | 2.396 | -0.762 | ms | -0.2111 | 1.5 | ||
The offset of a server in seconds. This is useful to see how the measured offset is behaving.
The chart also plots offset±rtt, where rtt is the round trip time to the server. NTP can not really know the offset of a remote chimer, NTP computes it by subtracting rtt/2 from the offset. Plotting the offset±rtt reverses this calculation to more easily see the effects of rtt changes.
Closer to 0s is better. An ideal system would be a horizontal line at 0s. Typical 90% ranges may be: local LAN server 80µs; 90% ranges for WAN server may be 4ms and much larger.
Clock Offset is field 5 in the peerstats log file. The Round Trip Time (rtt) is field 6 in the peerstats log file.
Server Offset 2605:6400:488d:2eda:eee9:fe8d:4543:d471

| Percentiles...... | Ranges...... | Skew- | Kurt- | |||||||||||||
| Name | Min | 1% | 5% | 50% | 95% | 99% | Max | 90% | 98% | StdDev | Mean | Units | ness | osis | ||
| Server Offset 2605:6400:488d:2eda:eee9:fe8d:4543:d471 | 6.277 | 6.277 | 6.277 | 6.277 | 6.277 | 6.277 | 6.277 | 0.000 | 0.000 | 0.000 | 6.277 | ms | nan | nan | ||
The offset of a server in seconds. This is useful to see how the measured offset is behaving.
The chart also plots offset±rtt, where rtt is the round trip time to the server. NTP can not really know the offset of a remote chimer, NTP computes it by subtracting rtt/2 from the offset. Plotting the offset±rtt reverses this calculation to more easily see the effects of rtt changes.
Closer to 0s is better. An ideal system would be a horizontal line at 0s. Typical 90% ranges may be: local LAN server 80µs; 90% ranges for WAN server may be 4ms and much larger.
Clock Offset is field 5 in the peerstats log file. The Round Trip Time (rtt) is field 6 in the peerstats log file.
Server Offset 2605:6400:488d:3686:546d:c03c:1689:20c

| Percentiles...... | Ranges...... | Skew- | Kurt- | |||||||||||||
| Name | Min | 1% | 5% | 50% | 95% | 99% | Max | 90% | 98% | StdDev | Mean | Units | ness | osis | ||
| Server Offset 2605:6400:488d:3686:546d:c03c:1689:20c | 10.815 | 10.815 | 10.815 | 10.815 | 10.815 | 10.815 | 10.815 | 0.000 | 0.000 | 0.000 | 10.815 | ms | nan | nan | ||
The offset of a server in seconds. This is useful to see how the measured offset is behaving.
The chart also plots offset±rtt, where rtt is the round trip time to the server. NTP can not really know the offset of a remote chimer, NTP computes it by subtracting rtt/2 from the offset. Plotting the offset±rtt reverses this calculation to more easily see the effects of rtt changes.
Closer to 0s is better. An ideal system would be a horizontal line at 0s. Typical 90% ranges may be: local LAN server 80µs; 90% ranges for WAN server may be 4ms and much larger.
Clock Offset is field 5 in the peerstats log file. The Round Trip Time (rtt) is field 6 in the peerstats log file.
Server Offset 2605:6f01:2000:18::94ee:fcbe (vps-buf1.orleans.ddnss.de)

| Percentiles...... | Ranges...... | Skew- | Kurt- | |||||||||||||
| Name | Min | 1% | 5% | 50% | 95% | 99% | Max | 90% | 98% | StdDev | Mean | Units | ness | osis | ||
| Server Offset 2605:6f01:2000:18::94ee:fcbe (vps-buf1.orleans.ddnss.de) | -1.370 | -1.370 | -1.370 | 3.697 | 9.921 | 9.921 | 9.921 | 11.292 | 11.292 | 2.854 | 4.172 | ms | 0.1428 | 3.178 | ||
The offset of a server in seconds. This is useful to see how the measured offset is behaving.
The chart also plots offset±rtt, where rtt is the round trip time to the server. NTP can not really know the offset of a remote chimer, NTP computes it by subtracting rtt/2 from the offset. Plotting the offset±rtt reverses this calculation to more easily see the effects of rtt changes.
Closer to 0s is better. An ideal system would be a horizontal line at 0s. Typical 90% ranges may be: local LAN server 80µs; 90% ranges for WAN server may be 4ms and much larger.
Clock Offset is field 5 in the peerstats log file. The Round Trip Time (rtt) is field 6 in the peerstats log file.
Server Offset 2606:4700:f1::1 (time.cloudflare.com)

| Percentiles...... | Ranges...... | Skew- | Kurt- | |||||||||||||
| Name | Min | 1% | 5% | 50% | 95% | 99% | Max | 90% | 98% | StdDev | Mean | Units | ness | osis | ||
| Server Offset 2606:4700:f1::1 (time.cloudflare.com) | -19.711 | -6.564 | -4.850 | 4.319 | 8.205 | 9.657 | 51.896 | 13.055 | 16.221 | 4.243 | 3.121 | ms | -0.3371 | 6.374 | ||
The offset of a server in seconds. This is useful to see how the measured offset is behaving.
The chart also plots offset±rtt, where rtt is the round trip time to the server. NTP can not really know the offset of a remote chimer, NTP computes it by subtracting rtt/2 from the offset. Plotting the offset±rtt reverses this calculation to more easily see the effects of rtt changes.
Closer to 0s is better. An ideal system would be a horizontal line at 0s. Typical 90% ranges may be: local LAN server 80µs; 90% ranges for WAN server may be 4ms and much larger.
Clock Offset is field 5 in the peerstats log file. The Round Trip Time (rtt) is field 6 in the peerstats log file.
Server Offset 2606:4700:f1::123 (time.cloudflare.com)

| Percentiles...... | Ranges...... | Skew- | Kurt- | |||||||||||||
| Name | Min | 1% | 5% | 50% | 95% | 99% | Max | 90% | 98% | StdDev | Mean | Units | ness | osis | ||
| Server Offset 2606:4700:f1::123 (time.cloudflare.com) | -68.168 | -4.450 | -2.958 | 4.083 | 8.483 | 10.838 | 429.230 | 11.441 | 15.288 | 11.816 | 3.808 | ms | 30.11 | 1063 | ||
The offset of a server in seconds. This is useful to see how the measured offset is behaving.
The chart also plots offset±rtt, where rtt is the round trip time to the server. NTP can not really know the offset of a remote chimer, NTP computes it by subtracting rtt/2 from the offset. Plotting the offset±rtt reverses this calculation to more easily see the effects of rtt changes.
Closer to 0s is better. An ideal system would be a horizontal line at 0s. Typical 90% ranges may be: local LAN server 80µs; 90% ranges for WAN server may be 4ms and much larger.
Clock Offset is field 5 in the peerstats log file. The Round Trip Time (rtt) is field 6 in the peerstats log file.
Server Offset 2606:82c0:21::e (time1.lshiy.com)

| Percentiles...... | Ranges...... | Skew- | Kurt- | |||||||||||||
| Name | Min | 1% | 5% | 50% | 95% | 99% | Max | 90% | 98% | StdDev | Mean | Units | ness | osis | ||
| Server Offset 2606:82c0:21::e (time1.lshiy.com) | -0.347 | -0.347 | -0.347 | 2.470 | 5.026 | 5.026 | 5.026 | 5.373 | 5.373 | 1.632 | 2.157 | ms | 0.07044 | 2.391 | ||
The offset of a server in seconds. This is useful to see how the measured offset is behaving.
The chart also plots offset±rtt, where rtt is the round trip time to the server. NTP can not really know the offset of a remote chimer, NTP computes it by subtracting rtt/2 from the offset. Plotting the offset±rtt reverses this calculation to more easily see the effects of rtt changes.
Closer to 0s is better. An ideal system would be a horizontal line at 0s. Typical 90% ranges may be: local LAN server 80µs; 90% ranges for WAN server may be 4ms and much larger.
Clock Offset is field 5 in the peerstats log file. The Round Trip Time (rtt) is field 6 in the peerstats log file.
Server Offset 2606:82c0:22::e (time2.lshiy.com)

| Percentiles...... | Ranges...... | Skew- | Kurt- | |||||||||||||
| Name | Min | 1% | 5% | 50% | 95% | 99% | Max | 90% | 98% | StdDev | Mean | Units | ness | osis | ||
| Server Offset 2606:82c0:22::e (time2.lshiy.com) | 2.084 | 2.084 | 2.084 | 5.198 | 6.067 | 6.067 | 6.067 | 3.983 | 3.983 | 1.710 | 4.450 | ms | -0.5727 | 1.5 | ||
The offset of a server in seconds. This is useful to see how the measured offset is behaving.
The chart also plots offset±rtt, where rtt is the round trip time to the server. NTP can not really know the offset of a remote chimer, NTP computes it by subtracting rtt/2 from the offset. Plotting the offset±rtt reverses this calculation to more easily see the effects of rtt changes.
Closer to 0s is better. An ideal system would be a horizontal line at 0s. Typical 90% ranges may be: local LAN server 80µs; 90% ranges for WAN server may be 4ms and much larger.
Clock Offset is field 5 in the peerstats log file. The Round Trip Time (rtt) is field 6 in the peerstats log file.
Server Offset 2606:82c0:23::e (time3.lshiy.com)

| Percentiles...... | Ranges...... | Skew- | Kurt- | |||||||||||||
| Name | Min | 1% | 5% | 50% | 95% | 99% | Max | 90% | 98% | StdDev | Mean | Units | ness | osis | ||
| Server Offset 2606:82c0:23::e (time3.lshiy.com) | 3.326 | 3.326 | 3.326 | 7.253 | 12.695 | 12.695 | 12.695 | 9.369 | 9.369 | 2.739 | 7.383 | ms | 0.4156 | 2.484 | ||
The offset of a server in seconds. This is useful to see how the measured offset is behaving.
The chart also plots offset±rtt, where rtt is the round trip time to the server. NTP can not really know the offset of a remote chimer, NTP computes it by subtracting rtt/2 from the offset. Plotting the offset±rtt reverses this calculation to more easily see the effects of rtt changes.
Closer to 0s is better. An ideal system would be a horizontal line at 0s. Typical 90% ranges may be: local LAN server 80µs; 90% ranges for WAN server may be 4ms and much larger.
Clock Offset is field 5 in the peerstats log file. The Round Trip Time (rtt) is field 6 in the peerstats log file.
Server Offset 2607:7c80:54:3::32

| Percentiles...... | Ranges...... | Skew- | Kurt- | |||||||||||||
| Name | Min | 1% | 5% | 50% | 95% | 99% | Max | 90% | 98% | StdDev | Mean | Units | ness | osis | ||
| Server Offset 2607:7c80:54:3::32 | -2.394 | -2.394 | -2.394 | 3.518 | 11.300 | 11.300 | 11.300 | 13.694 | 13.694 | 4.050 | 4.219 | ms | 0.07606 | 1.632 | ||
The offset of a server in seconds. This is useful to see how the measured offset is behaving.
The chart also plots offset±rtt, where rtt is the round trip time to the server. NTP can not really know the offset of a remote chimer, NTP computes it by subtracting rtt/2 from the offset. Plotting the offset±rtt reverses this calculation to more easily see the effects of rtt changes.
Closer to 0s is better. An ideal system would be a horizontal line at 0s. Typical 90% ranges may be: local LAN server 80µs; 90% ranges for WAN server may be 4ms and much larger.
Clock Offset is field 5 in the peerstats log file. The Round Trip Time (rtt) is field 6 in the peerstats log file.
Server Offset 2607:9000:7000:23:216:3cff:fe25:38d7

| Percentiles...... | Ranges...... | Skew- | Kurt- | |||||||||||||
| Name | Min | 1% | 5% | 50% | 95% | 99% | Max | 90% | 98% | StdDev | Mean | Units | ness | osis | ||
| Server Offset 2607:9000:7000:23:216:3cff:fe25:38d7 | -7.438 | -7.438 | -7.438 | 1.350 | 6.995 | 6.995 | 6.995 | 14.433 | 14.433 | 4.427 | 0.540 | ms | -0.1739 | 2.018 | ||
The offset of a server in seconds. This is useful to see how the measured offset is behaving.
The chart also plots offset±rtt, where rtt is the round trip time to the server. NTP can not really know the offset of a remote chimer, NTP computes it by subtracting rtt/2 from the offset. Plotting the offset±rtt reverses this calculation to more easily see the effects of rtt changes.
Closer to 0s is better. An ideal system would be a horizontal line at 0s. Typical 90% ranges may be: local LAN server 80µs; 90% ranges for WAN server may be 4ms and much larger.
Clock Offset is field 5 in the peerstats log file. The Round Trip Time (rtt) is field 6 in the peerstats log file.
Server Offset 2607:9d00:2000:16::9269:208a (vps-lax1.orleans.ddnss.de)

| Percentiles...... | Ranges...... | Skew- | Kurt- | |||||||||||||
| Name | Min | 1% | 5% | 50% | 95% | 99% | Max | 90% | 98% | StdDev | Mean | Units | ness | osis | ||
| Server Offset 2607:9d00:2000:16::9269:208a (vps-lax1.orleans.ddnss.de) | 0.027 | 0.027 | 0.549 | 5.418 | 11.274 | 17.615 | 17.615 | 10.726 | 17.588 | 3.719 | 5.554 | ms | 1.403 | 5.818 | ||
The offset of a server in seconds. This is useful to see how the measured offset is behaving.
The chart also plots offset±rtt, where rtt is the round trip time to the server. NTP can not really know the offset of a remote chimer, NTP computes it by subtracting rtt/2 from the offset. Plotting the offset±rtt reverses this calculation to more easily see the effects of rtt changes.
Closer to 0s is better. An ideal system would be a horizontal line at 0s. Typical 90% ranges may be: local LAN server 80µs; 90% ranges for WAN server may be 4ms and much larger.
Clock Offset is field 5 in the peerstats log file. The Round Trip Time (rtt) is field 6 in the peerstats log file.
Server Offset 2607:f1c0:f06b:5000::1 (ntp11.kernfusion.at)

| Percentiles...... | Ranges...... | Skew- | Kurt- | |||||||||||||
| Name | Min | 1% | 5% | 50% | 95% | 99% | Max | 90% | 98% | StdDev | Mean | Units | ness | osis | ||
| Server Offset 2607:f1c0:f06b:5000::1 (ntp11.kernfusion.at) | 2.778 | 2.778 | 2.778 | 7.554 | 7.962 | 7.962 | 7.962 | 5.184 | 5.184 | 1.862 | 6.389 | ms | -1.034 | 2.559 | ||
The offset of a server in seconds. This is useful to see how the measured offset is behaving.
The chart also plots offset±rtt, where rtt is the round trip time to the server. NTP can not really know the offset of a remote chimer, NTP computes it by subtracting rtt/2 from the offset. Plotting the offset±rtt reverses this calculation to more easily see the effects of rtt changes.
Closer to 0s is better. An ideal system would be a horizontal line at 0s. Typical 90% ranges may be: local LAN server 80µs; 90% ranges for WAN server may be 4ms and much larger.
Clock Offset is field 5 in the peerstats log file. The Round Trip Time (rtt) is field 6 in the peerstats log file.
Server Offset 2607:f1c0:f06b:5000::3 (ntp11.kernfusion.at)

| Percentiles...... | Ranges...... | Skew- | Kurt- | |||||||||||||
| Name | Min | 1% | 5% | 50% | 95% | 99% | Max | 90% | 98% | StdDev | Mean | Units | ness | osis | ||
| Server Offset 2607:f1c0:f06b:5000::3 (ntp11.kernfusion.at) | 3.424 | 3.424 | 3.424 | 9.764 | 40.761 | 40.761 | 40.761 | 37.337 | 37.337 | 12.353 | 15.555 | ms | 1.138 | 2.774 | ||
The offset of a server in seconds. This is useful to see how the measured offset is behaving.
The chart also plots offset±rtt, where rtt is the round trip time to the server. NTP can not really know the offset of a remote chimer, NTP computes it by subtracting rtt/2 from the offset. Plotting the offset±rtt reverses this calculation to more easily see the effects of rtt changes.
Closer to 0s is better. An ideal system would be a horizontal line at 0s. Typical 90% ranges may be: local LAN server 80µs; 90% ranges for WAN server may be 4ms and much larger.
Clock Offset is field 5 in the peerstats log file. The Round Trip Time (rtt) is field 6 in the peerstats log file.
Server Offset 2607:f1c0:f06b:5000::4 (ntp11.kernfusion.at)

| Percentiles...... | Ranges...... | Skew- | Kurt- | |||||||||||||
| Name | Min | 1% | 5% | 50% | 95% | 99% | Max | 90% | 98% | StdDev | Mean | Units | ness | osis | ||
| Server Offset 2607:f1c0:f06b:5000::4 (ntp11.kernfusion.at) | -2.373 | -2.373 | -1.407 | 3.297 | 10.246 | 11.084 | 11.084 | 11.653 | 13.458 | 3.531 | 3.807 | ms | 0.3808 | 2.37 | ||
The offset of a server in seconds. This is useful to see how the measured offset is behaving.
The chart also plots offset±rtt, where rtt is the round trip time to the server. NTP can not really know the offset of a remote chimer, NTP computes it by subtracting rtt/2 from the offset. Plotting the offset±rtt reverses this calculation to more easily see the effects of rtt changes.
Closer to 0s is better. An ideal system would be a horizontal line at 0s. Typical 90% ranges may be: local LAN server 80µs; 90% ranges for WAN server may be 4ms and much larger.
Clock Offset is field 5 in the peerstats log file. The Round Trip Time (rtt) is field 6 in the peerstats log file.
Server Offset 2607:f1c0:f075:9900::1

| Percentiles...... | Ranges...... | Skew- | Kurt- | |||||||||||||
| Name | Min | 1% | 5% | 50% | 95% | 99% | Max | 90% | 98% | StdDev | Mean | Units | ness | osis | ||
| Server Offset 2607:f1c0:f075:9900::1 | -11.364 | -11.364 | -8.290 | 9.893 | 429.232 | 429.472 | 429.472 | 437.522 | 440.836 | 115.991 | 54.692 | ms | 2.751 | 9.098 | ||
The offset of a server in seconds. This is useful to see how the measured offset is behaving.
The chart also plots offset±rtt, where rtt is the round trip time to the server. NTP can not really know the offset of a remote chimer, NTP computes it by subtracting rtt/2 from the offset. Plotting the offset±rtt reverses this calculation to more easily see the effects of rtt changes.
Closer to 0s is better. An ideal system would be a horizontal line at 0s. Typical 90% ranges may be: local LAN server 80µs; 90% ranges for WAN server may be 4ms and much larger.
Clock Offset is field 5 in the peerstats log file. The Round Trip Time (rtt) is field 6 in the peerstats log file.
Server Offset 2607:f298:5:101d:f816:3eff:fefd:8817

| Percentiles...... | Ranges...... | Skew- | Kurt- | |||||||||||||
| Name | Min | 1% | 5% | 50% | 95% | 99% | Max | 90% | 98% | StdDev | Mean | Units | ness | osis | ||
| Server Offset 2607:f298:5:101d:f816:3eff:fefd:8817 | 1.052 | 1.052 | 1.052 | 3.678 | 8.611 | 8.611 | 8.611 | 7.559 | 7.559 | 2.139 | 4.559 | ms | 0.3897 | 2.465 | ||
The offset of a server in seconds. This is useful to see how the measured offset is behaving.
The chart also plots offset±rtt, where rtt is the round trip time to the server. NTP can not really know the offset of a remote chimer, NTP computes it by subtracting rtt/2 from the offset. Plotting the offset±rtt reverses this calculation to more easily see the effects of rtt changes.
Closer to 0s is better. An ideal system would be a horizontal line at 0s. Typical 90% ranges may be: local LAN server 80µs; 90% ranges for WAN server may be 4ms and much larger.
Clock Offset is field 5 in the peerstats log file. The Round Trip Time (rtt) is field 6 in the peerstats log file.
Server Offset 2607:f5b7:1:44::123 (ntp.wdc2.us.leaseweb.net)

| Percentiles...... | Ranges...... | Skew- | Kurt- | |||||||||||||
| Name | Min | 1% | 5% | 50% | 95% | 99% | Max | 90% | 98% | StdDev | Mean | Units | ness | osis | ||
| Server Offset 2607:f5b7:1:44::123 (ntp.wdc2.us.leaseweb.net) | -21.133 | -21.133 | -21.133 | 2.691 | 6.166 | 6.166 | 6.166 | 27.299 | 27.299 | 10.518 | -3.824 | ms | -0.8405 | 2.074 | ||
The offset of a server in seconds. This is useful to see how the measured offset is behaving.
The chart also plots offset±rtt, where rtt is the round trip time to the server. NTP can not really know the offset of a remote chimer, NTP computes it by subtracting rtt/2 from the offset. Plotting the offset±rtt reverses this calculation to more easily see the effects of rtt changes.
Closer to 0s is better. An ideal system would be a horizontal line at 0s. Typical 90% ranges may be: local LAN server 80µs; 90% ranges for WAN server may be 4ms and much larger.
Clock Offset is field 5 in the peerstats log file. The Round Trip Time (rtt) is field 6 in the peerstats log file.
Server Offset 2607:f710:35::29c:0:5

| Percentiles...... | Ranges...... | Skew- | Kurt- | |||||||||||||
| Name | Min | 1% | 5% | 50% | 95% | 99% | Max | 90% | 98% | StdDev | Mean | Units | ness | osis | ||
| Server Offset 2607:f710:35::29c:0:5 | 1.230 | 1.230 | 1.230 | 6.637 | 13.998 | 13.998 | 13.998 | 12.768 | 12.768 | 3.502 | 7.121 | ms | 0.34 | 2.688 | ||
The offset of a server in seconds. This is useful to see how the measured offset is behaving.
The chart also plots offset±rtt, where rtt is the round trip time to the server. NTP can not really know the offset of a remote chimer, NTP computes it by subtracting rtt/2 from the offset. Plotting the offset±rtt reverses this calculation to more easily see the effects of rtt changes.
Closer to 0s is better. An ideal system would be a horizontal line at 0s. Typical 90% ranges may be: local LAN server 80µs; 90% ranges for WAN server may be 4ms and much larger.
Clock Offset is field 5 in the peerstats log file. The Round Trip Time (rtt) is field 6 in the peerstats log file.
Server Offset 2607:ff50:0:1a::10 (ntpool0.603.newcontinuum.net)

| Percentiles...... | Ranges...... | Skew- | Kurt- | |||||||||||||
| Name | Min | 1% | 5% | 50% | 95% | 99% | Max | 90% | 98% | StdDev | Mean | Units | ness | osis | ||
| Server Offset 2607:ff50:0:1a::10 (ntpool0.603.newcontinuum.net) | -158.123 | -158.123 | -158.123 | 3.807 | 12.552 | 12.552 | 12.552 | 170.675 | 170.675 | 66.662 | -31.139 | ms | -1.273 | 2.639 | ||
The offset of a server in seconds. This is useful to see how the measured offset is behaving.
The chart also plots offset±rtt, where rtt is the round trip time to the server. NTP can not really know the offset of a remote chimer, NTP computes it by subtracting rtt/2 from the offset. Plotting the offset±rtt reverses this calculation to more easily see the effects of rtt changes.
Closer to 0s is better. An ideal system would be a horizontal line at 0s. Typical 90% ranges may be: local LAN server 80µs; 90% ranges for WAN server may be 4ms and much larger.
Clock Offset is field 5 in the peerstats log file. The Round Trip Time (rtt) is field 6 in the peerstats log file.
Server Offset 2620:8d:c000::f (blotch.image1tech.net)

| Percentiles...... | Ranges...... | Skew- | Kurt- | |||||||||||||
| Name | Min | 1% | 5% | 50% | 95% | 99% | Max | 90% | 98% | StdDev | Mean | Units | ness | osis | ||
| Server Offset 2620:8d:c000::f (blotch.image1tech.net) | -12.501 | -12.501 | -12.501 | 0.670 | 15.127 | 15.127 | 15.127 | 27.628 | 27.628 | 9.564 | -0.984 | ms | 0.2932 | 2 | ||
The offset of a server in seconds. This is useful to see how the measured offset is behaving.
The chart also plots offset±rtt, where rtt is the round trip time to the server. NTP can not really know the offset of a remote chimer, NTP computes it by subtracting rtt/2 from the offset. Plotting the offset±rtt reverses this calculation to more easily see the effects of rtt changes.
Closer to 0s is better. An ideal system would be a horizontal line at 0s. Typical 90% ranges may be: local LAN server 80µs; 90% ranges for WAN server may be 4ms and much larger.
Clock Offset is field 5 in the peerstats log file. The Round Trip Time (rtt) is field 6 in the peerstats log file.
Server Offset 2620:b0:2000:102::2:123 (time-he.den.codehof.net)

| Percentiles...... | Ranges...... | Skew- | Kurt- | |||||||||||||
| Name | Min | 1% | 5% | 50% | 95% | 99% | Max | 90% | 98% | StdDev | Mean | Units | ness | osis | ||
| Server Offset 2620:b0:2000:102::2:123 (time-he.den.codehof.net) | -44.889 | -44.889 | -44.889 | 22.240 | 34.334 | 34.334 | 34.334 | 79.222 | 79.222 | 22.949 | 14.406 | ms | -2.048 | 5.652 | ||
The offset of a server in seconds. This is useful to see how the measured offset is behaving.
The chart also plots offset±rtt, where rtt is the round trip time to the server. NTP can not really know the offset of a remote chimer, NTP computes it by subtracting rtt/2 from the offset. Plotting the offset±rtt reverses this calculation to more easily see the effects of rtt changes.
Closer to 0s is better. An ideal system would be a horizontal line at 0s. Typical 90% ranges may be: local LAN server 80µs; 90% ranges for WAN server may be 4ms and much larger.
Clock Offset is field 5 in the peerstats log file. The Round Trip Time (rtt) is field 6 in the peerstats log file.
Server Offset 2a00:d78:0:712:94:198:159:11 (nts1.time.nl)

| Percentiles...... | Ranges...... | Skew- | Kurt- | |||||||||||||
| Name | Min | 1% | 5% | 50% | 95% | 99% | Max | 90% | 98% | StdDev | Mean | Units | ness | osis | ||
| Server Offset 2a00:d78:0:712:94:198:159:11 (nts1.time.nl) | -573.994 | -18.134 | -6.806 | 2.327 | 5.873 | 12.780 | 70.769 | 12.679 | 30.914 | 9.821 | 1.171 | ms | -30.68 | 1529 | ||
The offset of a server in seconds. This is useful to see how the measured offset is behaving.
The chart also plots offset±rtt, where rtt is the round trip time to the server. NTP can not really know the offset of a remote chimer, NTP computes it by subtracting rtt/2 from the offset. Plotting the offset±rtt reverses this calculation to more easily see the effects of rtt changes.
Closer to 0s is better. An ideal system would be a horizontal line at 0s. Typical 90% ranges may be: local LAN server 80µs; 90% ranges for WAN server may be 4ms and much larger.
Clock Offset is field 5 in the peerstats log file. The Round Trip Time (rtt) is field 6 in the peerstats log file.
Server Offset 2a01:3f7:2:44::8 (sth1-ts.nts.netnod.se)

| Percentiles...... | Ranges...... | Skew- | Kurt- | |||||||||||||
| Name | Min | 1% | 5% | 50% | 95% | 99% | Max | 90% | 98% | StdDev | Mean | Units | ness | osis | ||
| Server Offset 2a01:3f7:2:44::8 (sth1-ts.nts.netnod.se) | -267.863 | -40.093 | -15.266 | 1.591 | 6.744 | 10.371 | 425.774 | 22.011 | 50.463 | 12.041 | -0.620 | ms | 9.969 | 500.8 | ||
The offset of a server in seconds. This is useful to see how the measured offset is behaving.
The chart also plots offset±rtt, where rtt is the round trip time to the server. NTP can not really know the offset of a remote chimer, NTP computes it by subtracting rtt/2 from the offset. Plotting the offset±rtt reverses this calculation to more easily see the effects of rtt changes.
Closer to 0s is better. An ideal system would be a horizontal line at 0s. Typical 90% ranges may be: local LAN server 80µs; 90% ranges for WAN server may be 4ms and much larger.
Clock Offset is field 5 in the peerstats log file. The Round Trip Time (rtt) is field 6 in the peerstats log file.
Server Offset 2a01:3f7:2:44::9 (sth2-ts.nts.netnod.se)

| Percentiles...... | Ranges...... | Skew- | Kurt- | |||||||||||||
| Name | Min | 1% | 5% | 50% | 95% | 99% | Max | 90% | 98% | StdDev | Mean | Units | ness | osis | ||
| Server Offset 2a01:3f7:2:44::9 (sth2-ts.nts.netnod.se) | -158.599 | -33.916 | -12.160 | 0.310 | 6.172 | 11.064 | 106.144 | 18.332 | 44.980 | 8.614 | -0.951 | ms | -4.982 | 70.51 | ||
The offset of a server in seconds. This is useful to see how the measured offset is behaving.
The chart also plots offset±rtt, where rtt is the round trip time to the server. NTP can not really know the offset of a remote chimer, NTP computes it by subtracting rtt/2 from the offset. Plotting the offset±rtt reverses this calculation to more easily see the effects of rtt changes.
Closer to 0s is better. An ideal system would be a horizontal line at 0s. Typical 90% ranges may be: local LAN server 80µs; 90% ranges for WAN server may be 4ms and much larger.
Clock Offset is field 5 in the peerstats log file. The Round Trip Time (rtt) is field 6 in the peerstats log file.
Server Offset 2a01:4f8:c012:1afb:123:123:123:123

| Percentiles...... | Ranges...... | Skew- | Kurt- | |||||||||||||
| Name | Min | 1% | 5% | 50% | 95% | 99% | Max | 90% | 98% | StdDev | Mean | Units | ness | osis | ||
| Server Offset 2a01:4f8:c012:1afb:123:123:123:123 | -662.197 | -43.394 | -29.960 | -14.733 | -7.976 | -0.161 | 153.523 | 21.984 | 43.233 | 17.808 | -15.749 | ms | -19.9 | 818.3 | ||
The offset of a server in seconds. This is useful to see how the measured offset is behaving.
The chart also plots offset±rtt, where rtt is the round trip time to the server. NTP can not really know the offset of a remote chimer, NTP computes it by subtracting rtt/2 from the offset. Plotting the offset±rtt reverses this calculation to more easily see the effects of rtt changes.
Closer to 0s is better. An ideal system would be a horizontal line at 0s. Typical 90% ranges may be: local LAN server 80µs; 90% ranges for WAN server may be 4ms and much larger.
Clock Offset is field 5 in the peerstats log file. The Round Trip Time (rtt) is field 6 in the peerstats log file.
Server Offset 2a01:4f9:c013:fa27:123:123:123:123

| Percentiles...... | Ranges...... | Skew- | Kurt- | |||||||||||||
| Name | Min | 1% | 5% | 50% | 95% | 99% | Max | 90% | 98% | StdDev | Mean | Units | ness | osis | ||
| Server Offset 2a01:4f9:c013:fa27:123:123:123:123 | -74.656 | -29.575 | -9.456 | 1.270 | 5.487 | 10.806 | 152.944 | 14.943 | 40.381 | 9.896 | 0.343 | ms | 5.416 | 117.1 | ||
The offset of a server in seconds. This is useful to see how the measured offset is behaving.
The chart also plots offset±rtt, where rtt is the round trip time to the server. NTP can not really know the offset of a remote chimer, NTP computes it by subtracting rtt/2 from the offset. Plotting the offset±rtt reverses this calculation to more easily see the effects of rtt changes.
Closer to 0s is better. An ideal system would be a horizontal line at 0s. Typical 90% ranges may be: local LAN server 80µs; 90% ranges for WAN server may be 4ms and much larger.
Clock Offset is field 5 in the peerstats log file. The Round Trip Time (rtt) is field 6 in the peerstats log file.
Server Offset 2a01:4ff:f0:7300:123:123:123:123

| Percentiles...... | Ranges...... | Skew- | Kurt- | |||||||||||||
| Name | Min | 1% | 5% | 50% | 95% | 99% | Max | 90% | 98% | StdDev | Mean | Units | ness | osis | ||
| Server Offset 2a01:4ff:f0:7300:123:123:123:123 | -118.920 | -12.890 | -6.246 | -2.163 | 1.265 | 5.208 | 288.663 | 7.511 | 18.098 | 9.301 | -2.445 | ms | 12.21 | 561.8 | ||
The offset of a server in seconds. This is useful to see how the measured offset is behaving.
The chart also plots offset±rtt, where rtt is the round trip time to the server. NTP can not really know the offset of a remote chimer, NTP computes it by subtracting rtt/2 from the offset. Plotting the offset±rtt reverses this calculation to more easily see the effects of rtt changes.
Closer to 0s is better. An ideal system would be a horizontal line at 0s. Typical 90% ranges may be: local LAN server 80µs; 90% ranges for WAN server may be 4ms and much larger.
Clock Offset is field 5 in the peerstats log file. The Round Trip Time (rtt) is field 6 in the peerstats log file.
Server Offset 2a01:4ff:f0:ebce::1

| Percentiles...... | Ranges...... | Skew- | Kurt- | |||||||||||||
| Name | Min | 1% | 5% | 50% | 95% | 99% | Max | 90% | 98% | StdDev | Mean | Units | ness | osis | ||
| Server Offset 2a01:4ff:f0:ebce::1 | 8.384 | 8.384 | 8.384 | 34.231 | 34.231 | 34.231 | 34.231 | 25.847 | 25.847 | 12.924 | 21.307 | ms | 1.962e-16 | 1 | ||
The offset of a server in seconds. This is useful to see how the measured offset is behaving.
The chart also plots offset±rtt, where rtt is the round trip time to the server. NTP can not really know the offset of a remote chimer, NTP computes it by subtracting rtt/2 from the offset. Plotting the offset±rtt reverses this calculation to more easily see the effects of rtt changes.
Closer to 0s is better. An ideal system would be a horizontal line at 0s. Typical 90% ranges may be: local LAN server 80µs; 90% ranges for WAN server may be 4ms and much larger.
Clock Offset is field 5 in the peerstats log file. The Round Trip Time (rtt) is field 6 in the peerstats log file.
Server Offset 2a01:7e03::f03c:95ff:fef8:ac8c (sushi.ruselabs.com)

| Percentiles...... | Ranges...... | Skew- | Kurt- | |||||||||||||
| Name | Min | 1% | 5% | 50% | 95% | 99% | Max | 90% | 98% | StdDev | Mean | Units | ness | osis | ||
| Server Offset 2a01:7e03::f03c:95ff:fef8:ac8c (sushi.ruselabs.com) | -51.215 | -51.215 | -51.215 | 6.741 | 19.073 | 19.073 | 19.073 | 70.288 | 70.288 | 23.048 | -2.114 | ms | -1.242 | 3.142 | ||
The offset of a server in seconds. This is useful to see how the measured offset is behaving.
The chart also plots offset±rtt, where rtt is the round trip time to the server. NTP can not really know the offset of a remote chimer, NTP computes it by subtracting rtt/2 from the offset. Plotting the offset±rtt reverses this calculation to more easily see the effects of rtt changes.
Closer to 0s is better. An ideal system would be a horizontal line at 0s. Typical 90% ranges may be: local LAN server 80µs; 90% ranges for WAN server may be 4ms and much larger.
Clock Offset is field 5 in the peerstats log file. The Round Trip Time (rtt) is field 6 in the peerstats log file.
Server Offset 2a01:7e04::f03c:94ff:fee2:cba5

| Percentiles...... | Ranges...... | Skew- | Kurt- | |||||||||||||
| Name | Min | 1% | 5% | 50% | 95% | 99% | Max | 90% | 98% | StdDev | Mean | Units | ness | osis | ||
| Server Offset 2a01:7e04::f03c:94ff:fee2:cba5 | -26.406 | -26.406 | -26.406 | 2.333 | 5.249 | 5.249 | 5.249 | 31.655 | 31.655 | 7.170 | 0.454 | ms | -3.228 | 12.34 | ||
The offset of a server in seconds. This is useful to see how the measured offset is behaving.
The chart also plots offset±rtt, where rtt is the round trip time to the server. NTP can not really know the offset of a remote chimer, NTP computes it by subtracting rtt/2 from the offset. Plotting the offset±rtt reverses this calculation to more easily see the effects of rtt changes.
Closer to 0s is better. An ideal system would be a horizontal line at 0s. Typical 90% ranges may be: local LAN server 80µs; 90% ranges for WAN server may be 4ms and much larger.
Clock Offset is field 5 in the peerstats log file. The Round Trip Time (rtt) is field 6 in the peerstats log file.
Server Offset 2a0a:e5c0:2:2:0:c8ff:fe68:beb7 (42-2a0a-e5c0-2-2-0-c8ff-fe68-beb7.loves.ipv6.at.ungleich.ch)

| Percentiles...... | Ranges...... | Skew- | Kurt- | |||||||||||||
| Name | Min | 1% | 5% | 50% | 95% | 99% | Max | 90% | 98% | StdDev | Mean | Units | ness | osis | ||
| Server Offset 2a0a:e5c0:2:2:0:c8ff:fe68:beb7 (42-2a0a-e5c0-2-2-0-c8ff-fe68-beb7.loves.ipv6.at.ungleich.ch) | -15.575 | -4.284 | -0.922 | 1.204 | 3.169 | 4.150 | 7.004 | 4.091 | 8.434 | 1.710 | 1.146 | ms | -3.21 | 29.58 | ||
The offset of a server in seconds. This is useful to see how the measured offset is behaving.
The chart also plots offset±rtt, where rtt is the round trip time to the server. NTP can not really know the offset of a remote chimer, NTP computes it by subtracting rtt/2 from the offset. Plotting the offset±rtt reverses this calculation to more easily see the effects of rtt changes.
Closer to 0s is better. An ideal system would be a horizontal line at 0s. Typical 90% ranges may be: local LAN server 80µs; 90% ranges for WAN server may be 4ms and much larger.
Clock Offset is field 5 in the peerstats log file. The Round Trip Time (rtt) is field 6 in the peerstats log file.
Server Offset 34.147.28.4

| Percentiles...... | Ranges...... | Skew- | Kurt- | |||||||||||||
| Name | Min | 1% | 5% | 50% | 95% | 99% | Max | 90% | 98% | StdDev | Mean | Units | ness | osis | ||
| Server Offset 34.147.28.4 | -2,001.428 | -75.028 | -27.118 | -1.929 | 1.997 | 5.796 | 13.648 | 29.116 | 80.824 | 42.361 | -5.949 | ms | -42.83 | 2012 | ||
The offset of a server in seconds. This is useful to see how the measured offset is behaving.
The chart also plots offset±rtt, where rtt is the round trip time to the server. NTP can not really know the offset of a remote chimer, NTP computes it by subtracting rtt/2 from the offset. Plotting the offset±rtt reverses this calculation to more easily see the effects of rtt changes.
Closer to 0s is better. An ideal system would be a horizontal line at 0s. Typical 90% ranges may be: local LAN server 80µs; 90% ranges for WAN server may be 4ms and much larger.
Clock Offset is field 5 in the peerstats log file. The Round Trip Time (rtt) is field 6 in the peerstats log file.
Server Offset 37.27.11.4

| Percentiles...... | Ranges...... | Skew- | Kurt- | |||||||||||||
| Name | Min | 1% | 5% | 50% | 95% | 99% | Max | 90% | 98% | StdDev | Mean | Units | ness | osis | ||
| Server Offset 37.27.11.4 | -51.314 | -10.261 | -2.384 | 0.947 | 3.098 | 4.523 | 4.544 | 5.482 | 14.784 | 4.805 | 0.292 | ms | -9.244 | 98.81 | ||
The offset of a server in seconds. This is useful to see how the measured offset is behaving.
The chart also plots offset±rtt, where rtt is the round trip time to the server. NTP can not really know the offset of a remote chimer, NTP computes it by subtracting rtt/2 from the offset. Plotting the offset±rtt reverses this calculation to more easily see the effects of rtt changes.
Closer to 0s is better. An ideal system would be a horizontal line at 0s. Typical 90% ranges may be: local LAN server 80µs; 90% ranges for WAN server may be 4ms and much larger.
Clock Offset is field 5 in the peerstats log file. The Round Trip Time (rtt) is field 6 in the peerstats log file.
Server Offset 38.45.64.130

| Percentiles...... | Ranges...... | Skew- | Kurt- | |||||||||||||
| Name | Min | 1% | 5% | 50% | 95% | 99% | Max | 90% | 98% | StdDev | Mean | Units | ness | osis | ||
| Server Offset 38.45.64.130 | -257.312 | -73.003 | -9.597 | 5.725 | 9.142 | 13.153 | 177.823 | 18.739 | 86.156 | 24.534 | 3.845 | ms | -3.142 | 73.78 | ||
The offset of a server in seconds. This is useful to see how the measured offset is behaving.
The chart also plots offset±rtt, where rtt is the round trip time to the server. NTP can not really know the offset of a remote chimer, NTP computes it by subtracting rtt/2 from the offset. Plotting the offset±rtt reverses this calculation to more easily see the effects of rtt changes.
Closer to 0s is better. An ideal system would be a horizontal line at 0s. Typical 90% ranges may be: local LAN server 80µs; 90% ranges for WAN server may be 4ms and much larger.
Clock Offset is field 5 in the peerstats log file. The Round Trip Time (rtt) is field 6 in the peerstats log file.
Server Offset 40.160.28.79

| Percentiles...... | Ranges...... | Skew- | Kurt- | |||||||||||||
| Name | Min | 1% | 5% | 50% | 95% | 99% | Max | 90% | 98% | StdDev | Mean | Units | ness | osis | ||
| Server Offset 40.160.28.79 | -52.835 | -52.513 | -34.382 | -5.004 | 1.626 | 5.643 | 7.374 | 36.008 | 58.156 | 10.906 | -8.229 | ms | -2.157 | 7.89 | ||
The offset of a server in seconds. This is useful to see how the measured offset is behaving.
The chart also plots offset±rtt, where rtt is the round trip time to the server. NTP can not really know the offset of a remote chimer, NTP computes it by subtracting rtt/2 from the offset. Plotting the offset±rtt reverses this calculation to more easily see the effects of rtt changes.
Closer to 0s is better. An ideal system would be a horizontal line at 0s. Typical 90% ranges may be: local LAN server 80µs; 90% ranges for WAN server may be 4ms and much larger.
Clock Offset is field 5 in the peerstats log file. The Round Trip Time (rtt) is field 6 in the peerstats log file.
Server Offset 44.190.5.123

| Percentiles...... | Ranges...... | Skew- | Kurt- | |||||||||||||
| Name | Min | 1% | 5% | 50% | 95% | 99% | Max | 90% | 98% | StdDev | Mean | Units | ness | osis | ||
| Server Offset 44.190.5.123 | -629.428 | -3.102 | -0.196 | 4.642 | 6.720 | 7.503 | 12.530 | 6.916 | 10.605 | 12.461 | 3.885 | ms | -49.22 | 2501 | ||
The offset of a server in seconds. This is useful to see how the measured offset is behaving.
The chart also plots offset±rtt, where rtt is the round trip time to the server. NTP can not really know the offset of a remote chimer, NTP computes it by subtracting rtt/2 from the offset. Plotting the offset±rtt reverses this calculation to more easily see the effects of rtt changes.
Closer to 0s is better. An ideal system would be a horizontal line at 0s. Typical 90% ranges may be: local LAN server 80µs; 90% ranges for WAN server may be 4ms and much larger.
Clock Offset is field 5 in the peerstats log file. The Round Trip Time (rtt) is field 6 in the peerstats log file.
Server Offset 45.33.53.84

| Percentiles...... | Ranges...... | Skew- | Kurt- | |||||||||||||
| Name | Min | 1% | 5% | 50% | 95% | 99% | Max | 90% | 98% | StdDev | Mean | Units | ness | osis | ||
| Server Offset 45.33.53.84 | -46.045 | -1.169 | 1.112 | 4.939 | 7.280 | 7.847 | 8.597 | 6.167 | 9.016 | 2.868 | 4.557 | ms | -9.347 | 157.9 | ||
The offset of a server in seconds. This is useful to see how the measured offset is behaving.
The chart also plots offset±rtt, where rtt is the round trip time to the server. NTP can not really know the offset of a remote chimer, NTP computes it by subtracting rtt/2 from the offset. Plotting the offset±rtt reverses this calculation to more easily see the effects of rtt changes.
Closer to 0s is better. An ideal system would be a horizontal line at 0s. Typical 90% ranges may be: local LAN server 80µs; 90% ranges for WAN server may be 4ms and much larger.
Clock Offset is field 5 in the peerstats log file. The Round Trip Time (rtt) is field 6 in the peerstats log file.
Server Offset 45.45.184.14

| Percentiles...... | Ranges...... | Skew- | Kurt- | |||||||||||||
| Name | Min | 1% | 5% | 50% | 95% | 99% | Max | 90% | 98% | StdDev | Mean | Units | ness | osis | ||
| Server Offset 45.45.184.14 | -3.583 | -3.583 | -2.213 | 2.314 | 5.861 | 8.196 | 8.196 | 8.074 | 11.779 | 2.497 | 2.295 | ms | -0.1048 | 2.439 | ||
The offset of a server in seconds. This is useful to see how the measured offset is behaving.
The chart also plots offset±rtt, where rtt is the round trip time to the server. NTP can not really know the offset of a remote chimer, NTP computes it by subtracting rtt/2 from the offset. Plotting the offset±rtt reverses this calculation to more easily see the effects of rtt changes.
Closer to 0s is better. An ideal system would be a horizontal line at 0s. Typical 90% ranges may be: local LAN server 80µs; 90% ranges for WAN server may be 4ms and much larger.
Clock Offset is field 5 in the peerstats log file. The Round Trip Time (rtt) is field 6 in the peerstats log file.
Server Offset 45.55.58.103

| Percentiles...... | Ranges...... | Skew- | Kurt- | |||||||||||||
| Name | Min | 1% | 5% | 50% | 95% | 99% | Max | 90% | 98% | StdDev | Mean | Units | ness | osis | ||
| Server Offset 45.55.58.103 | -110.343 | -110.343 | -110.343 | 0.562 | 3.360 | 3.360 | 3.360 | 113.703 | 113.703 | 54.930 | -52.554 | ms | -0.005973 | 1.01 | ||
The offset of a server in seconds. This is useful to see how the measured offset is behaving.
The chart also plots offset±rtt, where rtt is the round trip time to the server. NTP can not really know the offset of a remote chimer, NTP computes it by subtracting rtt/2 from the offset. Plotting the offset±rtt reverses this calculation to more easily see the effects of rtt changes.
Closer to 0s is better. An ideal system would be a horizontal line at 0s. Typical 90% ranges may be: local LAN server 80µs; 90% ranges for WAN server may be 4ms and much larger.
Clock Offset is field 5 in the peerstats log file. The Round Trip Time (rtt) is field 6 in the peerstats log file.
Server Offset 45.63.54.13

| Percentiles...... | Ranges...... | Skew- | Kurt- | |||||||||||||
| Name | Min | 1% | 5% | 50% | 95% | 99% | Max | 90% | 98% | StdDev | Mean | Units | ness | osis | ||
| Server Offset 45.63.54.13 | -5.411 | -1.371 | 1.271 | 5.500 | 7.544 | 8.410 | 9.171 | 6.272 | 9.781 | 1.966 | 5.094 | ms | -1.358 | 6.142 | ||
The offset of a server in seconds. This is useful to see how the measured offset is behaving.
The chart also plots offset±rtt, where rtt is the round trip time to the server. NTP can not really know the offset of a remote chimer, NTP computes it by subtracting rtt/2 from the offset. Plotting the offset±rtt reverses this calculation to more easily see the effects of rtt changes.
Closer to 0s is better. An ideal system would be a horizontal line at 0s. Typical 90% ranges may be: local LAN server 80µs; 90% ranges for WAN server may be 4ms and much larger.
Clock Offset is field 5 in the peerstats log file. The Round Trip Time (rtt) is field 6 in the peerstats log file.
Server Offset 45.77.126.122

| Percentiles...... | Ranges...... | Skew- | Kurt- | |||||||||||||
| Name | Min | 1% | 5% | 50% | 95% | 99% | Max | 90% | 98% | StdDev | Mean | Units | ness | osis | ||
| Server Offset 45.77.126.122 | 0.280 | 0.280 | 1.370 | 4.514 | 10.132 | 10.132 | 10.132 | 8.762 | 9.852 | 2.436 | 4.532 | ms | 0.629 | 3.175 | ||
The offset of a server in seconds. This is useful to see how the measured offset is behaving.
The chart also plots offset±rtt, where rtt is the round trip time to the server. NTP can not really know the offset of a remote chimer, NTP computes it by subtracting rtt/2 from the offset. Plotting the offset±rtt reverses this calculation to more easily see the effects of rtt changes.
Closer to 0s is better. An ideal system would be a horizontal line at 0s. Typical 90% ranges may be: local LAN server 80µs; 90% ranges for WAN server may be 4ms and much larger.
Clock Offset is field 5 in the peerstats log file. The Round Trip Time (rtt) is field 6 in the peerstats log file.
Server Offset 45.79.111.167
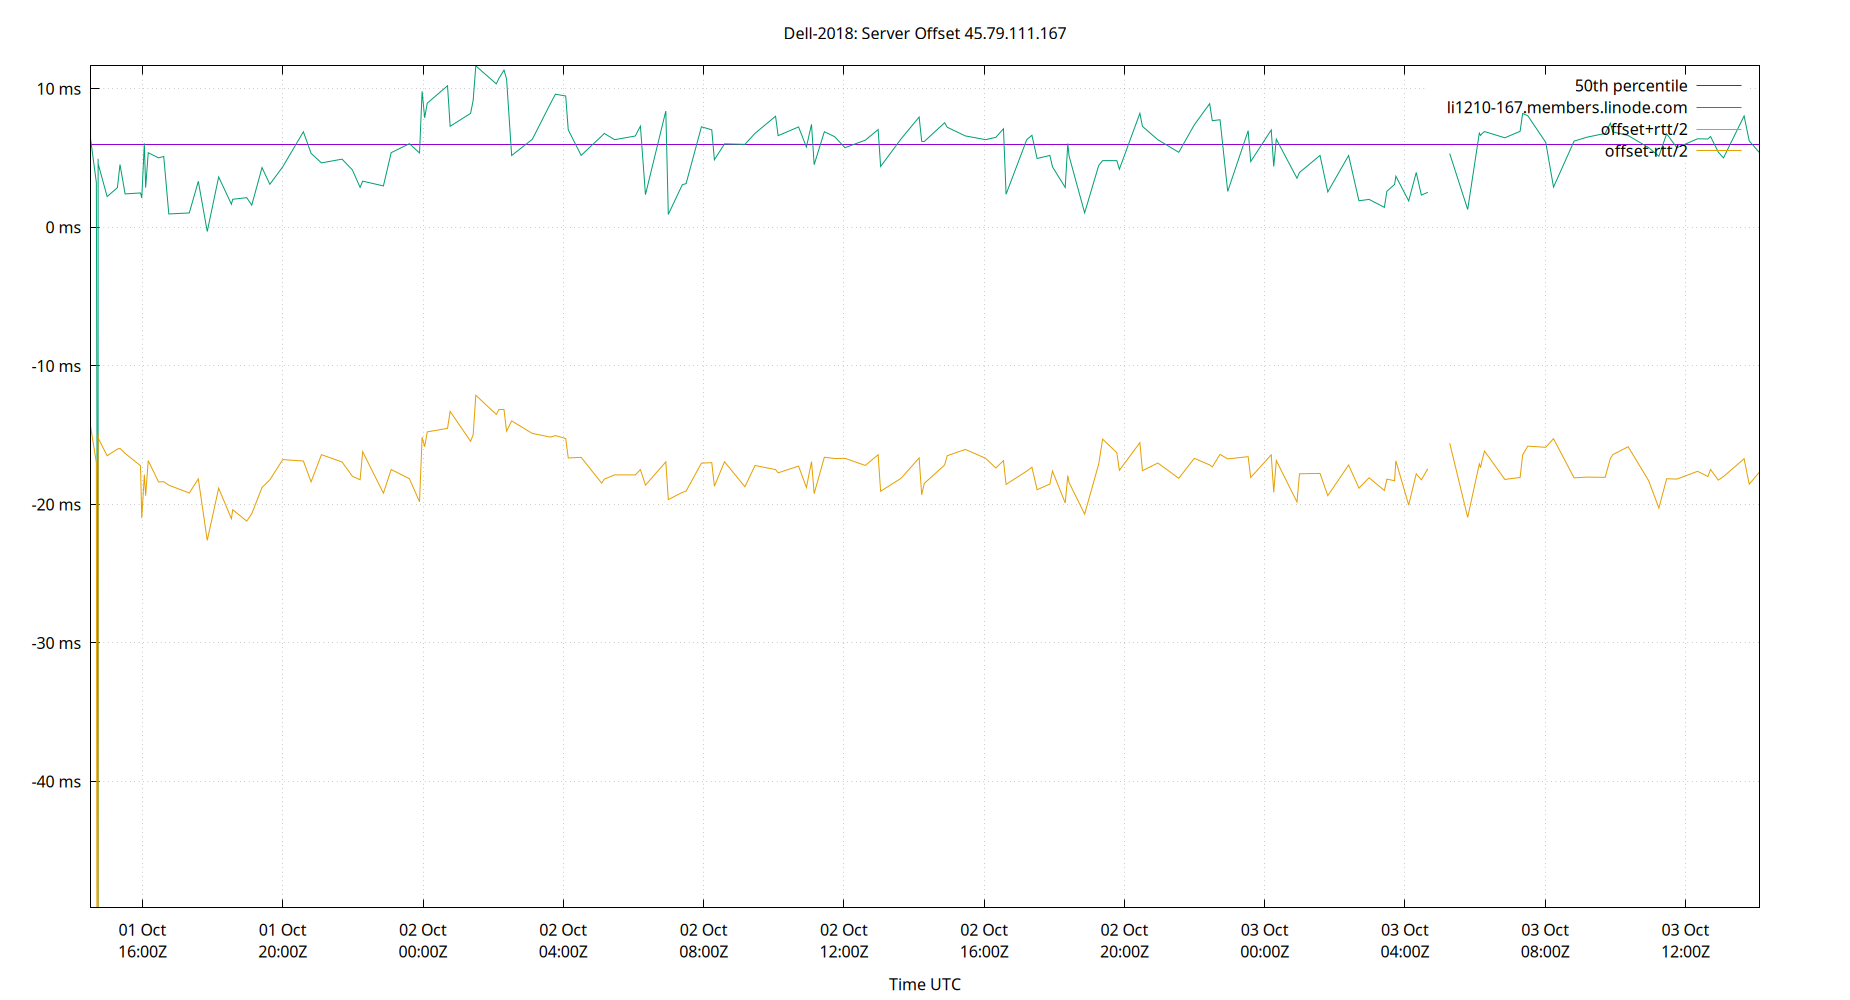
| Percentiles...... | Ranges...... | Skew- | Kurt- | |||||||||||||
| Name | Min | 1% | 5% | 50% | 95% | 99% | Max | 90% | 98% | StdDev | Mean | Units | ness | osis | ||
| Server Offset 45.79.111.167 | -49.125 | -40.782 | 1.444 | 5.990 | 9.608 | 11.350 | 11.654 | 8.165 | 52.133 | 5.897 | 5.000 | ms | -7.129 | 62.11 | ||
The offset of a server in seconds. This is useful to see how the measured offset is behaving.
The chart also plots offset±rtt, where rtt is the round trip time to the server. NTP can not really know the offset of a remote chimer, NTP computes it by subtracting rtt/2 from the offset. Plotting the offset±rtt reverses this calculation to more easily see the effects of rtt changes.
Closer to 0s is better. An ideal system would be a horizontal line at 0s. Typical 90% ranges may be: local LAN server 80µs; 90% ranges for WAN server may be 4ms and much larger.
Clock Offset is field 5 in the peerstats log file. The Round Trip Time (rtt) is field 6 in the peerstats log file.
Server Offset 45.79.13.35
| Percentiles...... | Ranges...... | Skew- | Kurt- | |||||||||||||
| Name | Min | 1% | 5% | 50% | 95% | 99% | Max | 90% | 98% | StdDev | Mean | Units | ness | osis | ||
| Server Offset 45.79.13.35 | 1.657 | 1.657 | 1.657 | 2.347 | 2.347 | 2.347 | 2.347 | 0.691 | 0.691 | 0.345 | 2.002 | ms | 1.884e-15 | 1 | ||
The offset of a server in seconds. This is useful to see how the measured offset is behaving.
The chart also plots offset±rtt, where rtt is the round trip time to the server. NTP can not really know the offset of a remote chimer, NTP computes it by subtracting rtt/2 from the offset. Plotting the offset±rtt reverses this calculation to more easily see the effects of rtt changes.
Closer to 0s is better. An ideal system would be a horizontal line at 0s. Typical 90% ranges may be: local LAN server 80µs; 90% ranges for WAN server may be 4ms and much larger.
Clock Offset is field 5 in the peerstats log file. The Round Trip Time (rtt) is field 6 in the peerstats log file.
Server Offset 45.79.227.165
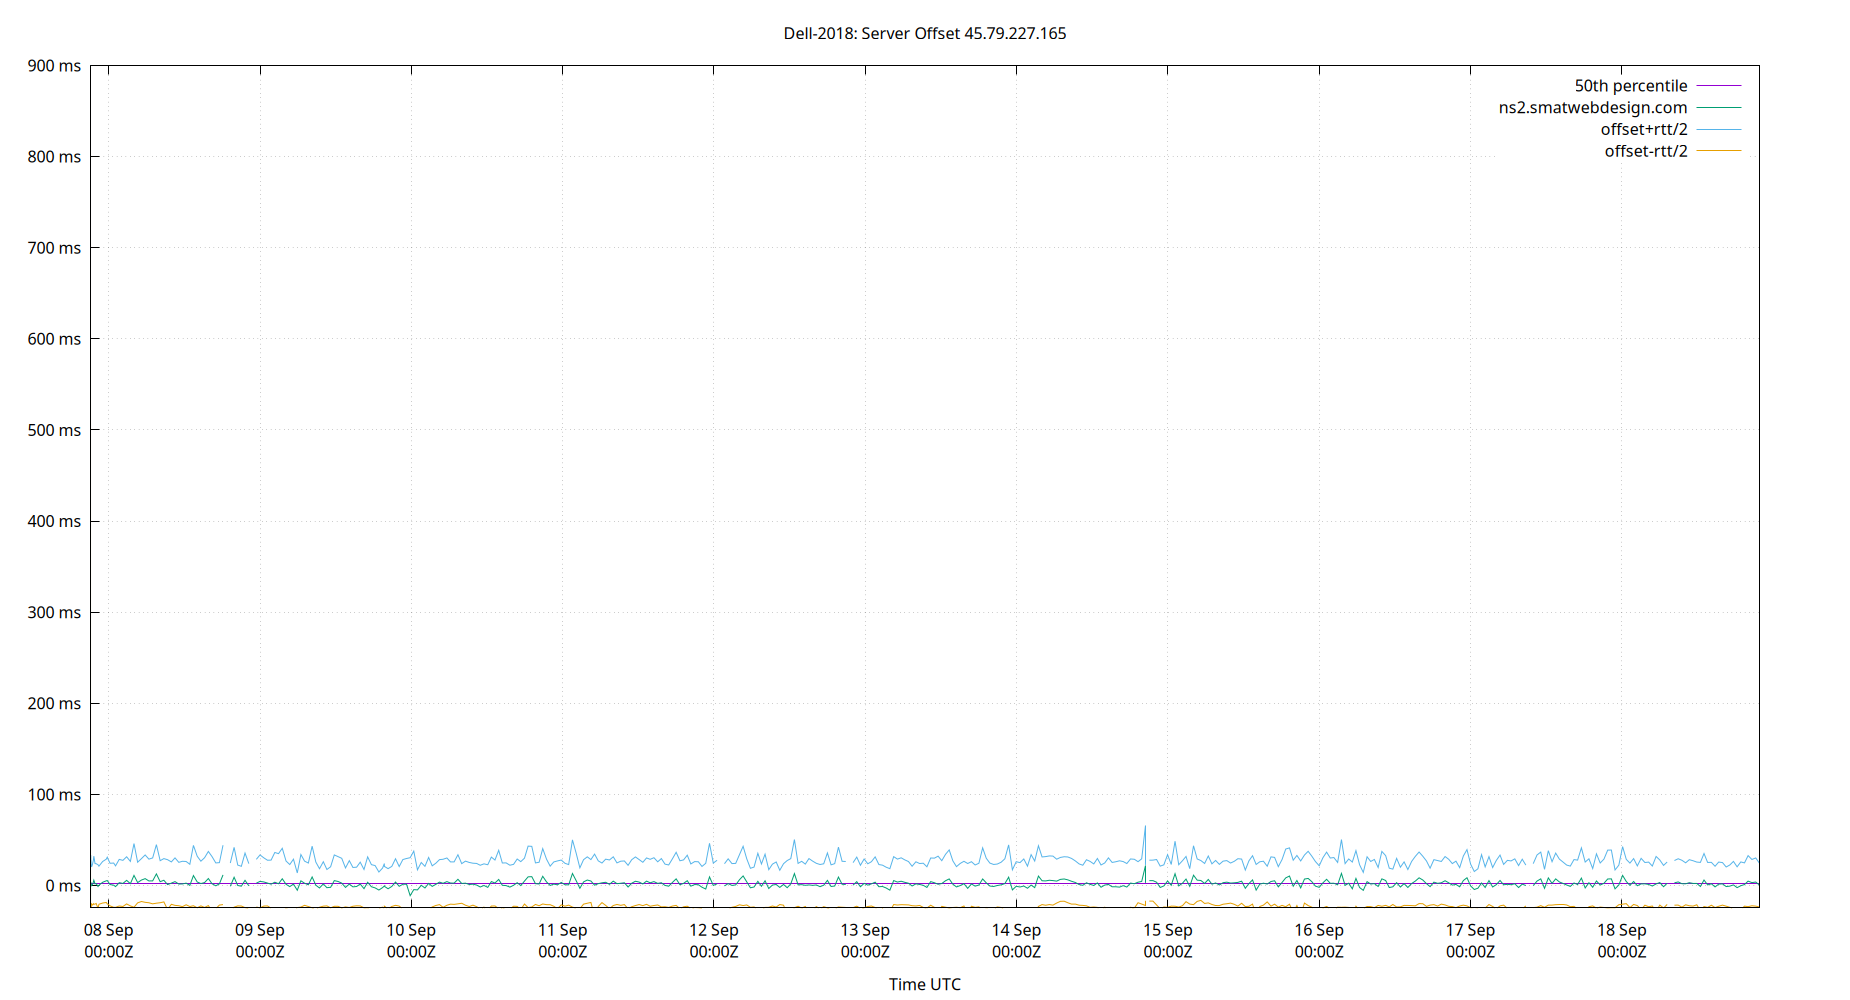
| Percentiles...... | Ranges...... | Skew- | Kurt- | |||||||||||||
| Name | Min | 1% | 5% | 50% | 95% | 99% | Max | 90% | 98% | StdDev | Mean | Units | ness | osis | ||
| Server Offset 45.79.227.165 | -24.668 | -5.318 | -2.707 | 1.911 | 9.063 | 13.270 | 899.559 | 11.770 | 18.588 | 52.876 | 5.216 | ms | 16.75 | 283 | ||
The offset of a server in seconds. This is useful to see how the measured offset is behaving.
The chart also plots offset±rtt, where rtt is the round trip time to the server. NTP can not really know the offset of a remote chimer, NTP computes it by subtracting rtt/2 from the offset. Plotting the offset±rtt reverses this calculation to more easily see the effects of rtt changes.
Closer to 0s is better. An ideal system would be a horizontal line at 0s. Typical 90% ranges may be: local LAN server 80µs; 90% ranges for WAN server may be 4ms and much larger.
Clock Offset is field 5 in the peerstats log file. The Round Trip Time (rtt) is field 6 in the peerstats log file.
Server Offset 45.79.82.45
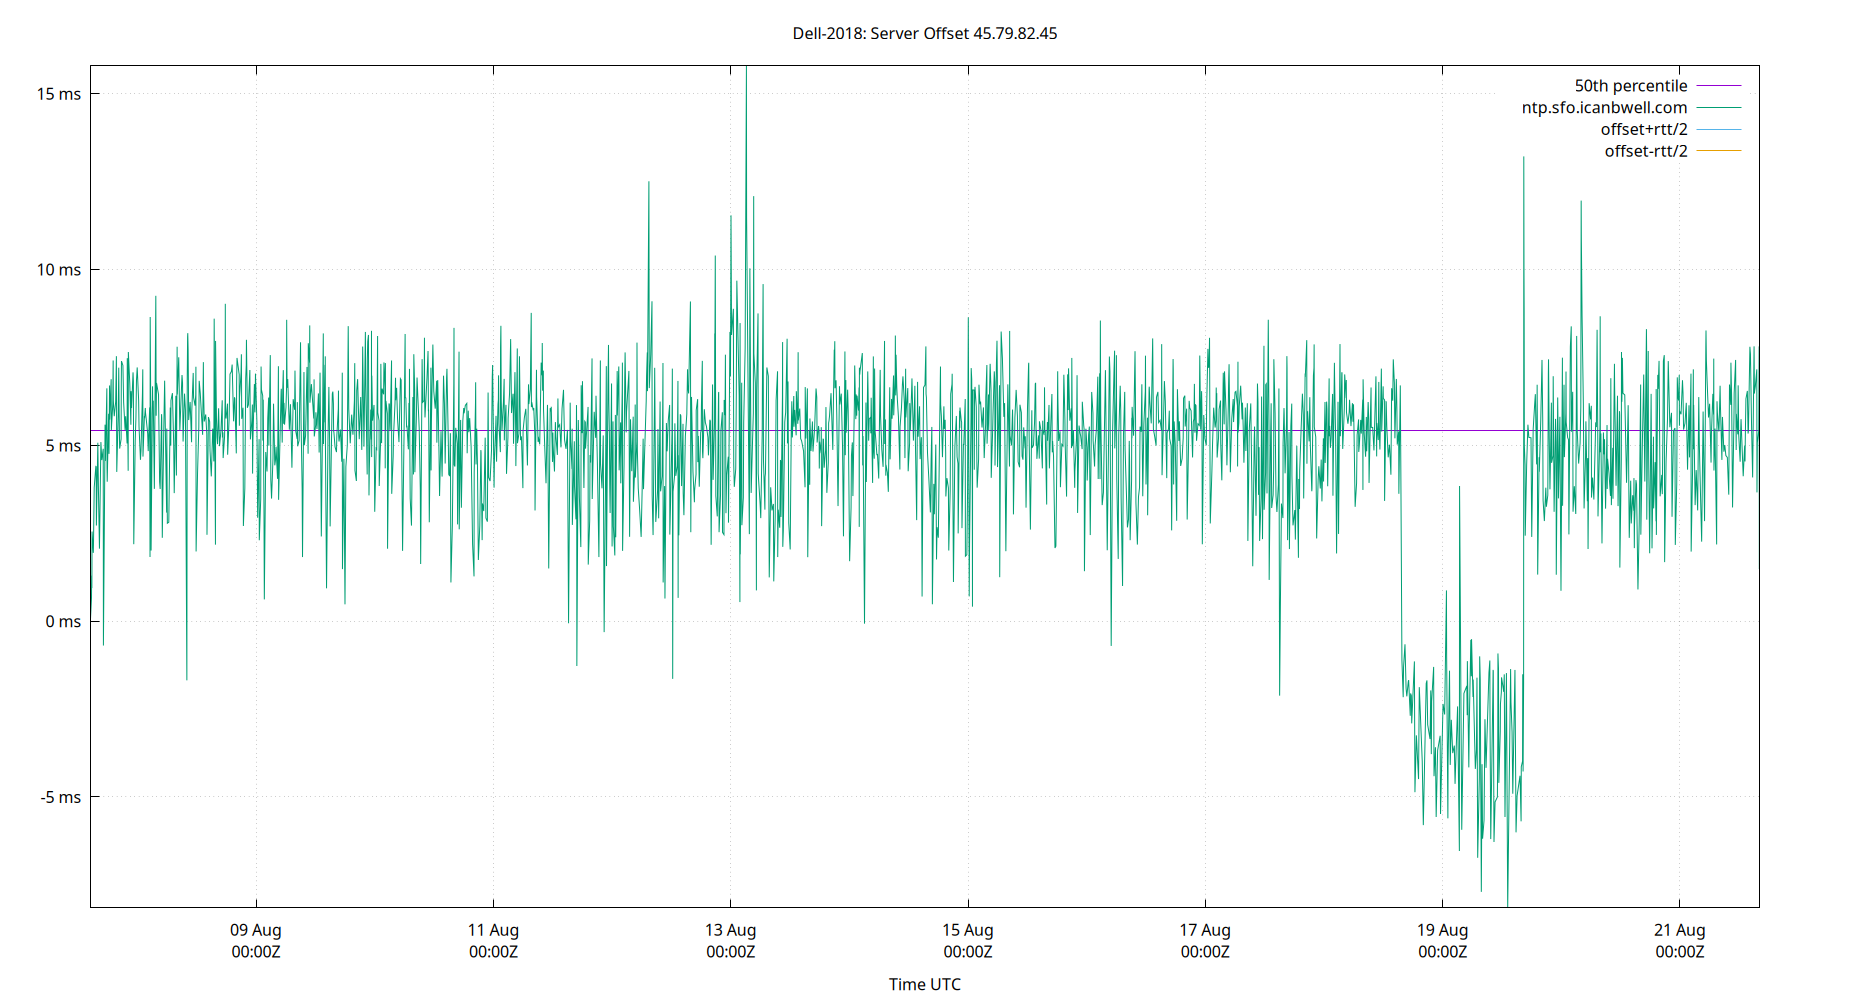
| Percentiles...... | Ranges...... | Skew- | Kurt- | |||||||||||||
| Name | Min | 1% | 5% | 50% | 95% | 99% | Max | 90% | 98% | StdDev | Mean | Units | ness | osis | ||
| Server Offset 45.79.82.45 | -8.160 | -4.866 | -1.302 | 5.432 | 7.656 | 8.754 | 15.796 | 8.958 | 13.620 | 2.573 | 4.888 | ms | -1.751 | 7.666 | ||
The offset of a server in seconds. This is useful to see how the measured offset is behaving.
The chart also plots offset±rtt, where rtt is the round trip time to the server. NTP can not really know the offset of a remote chimer, NTP computes it by subtracting rtt/2 from the offset. Plotting the offset±rtt reverses this calculation to more easily see the effects of rtt changes.
Closer to 0s is better. An ideal system would be a horizontal line at 0s. Typical 90% ranges may be: local LAN server 80µs; 90% ranges for WAN server may be 4ms and much larger.
Clock Offset is field 5 in the peerstats log file. The Round Trip Time (rtt) is field 6 in the peerstats log file.
Server Offset 45.83.234.123

| Percentiles...... | Ranges...... | Skew- | Kurt- | |||||||||||||
| Name | Min | 1% | 5% | 50% | 95% | 99% | Max | 90% | 98% | StdDev | Mean | Units | ness | osis | ||
| Server Offset 45.83.234.123 | -92.017 | -33.072 | -11.827 | 2.648 | 8.385 | 11.688 | 37.116 | 20.213 | 44.760 | 8.331 | 1.141 | ms | -3.437 | 28.02 | ||
The offset of a server in seconds. This is useful to see how the measured offset is behaving.
The chart also plots offset±rtt, where rtt is the round trip time to the server. NTP can not really know the offset of a remote chimer, NTP computes it by subtracting rtt/2 from the offset. Plotting the offset±rtt reverses this calculation to more easily see the effects of rtt changes.
Closer to 0s is better. An ideal system would be a horizontal line at 0s. Typical 90% ranges may be: local LAN server 80µs; 90% ranges for WAN server may be 4ms and much larger.
Clock Offset is field 5 in the peerstats log file. The Round Trip Time (rtt) is field 6 in the peerstats log file.
Server Offset 47.85.203.40

| Percentiles...... | Ranges...... | Skew- | Kurt- | |||||||||||||
| Name | Min | 1% | 5% | 50% | 95% | 99% | Max | 90% | 98% | StdDev | Mean | Units | ness | osis | ||
| Server Offset 47.85.203.40 | -11.482 | -4.542 | -0.158 | 5.077 | 10.458 | 14.417 | 15.104 | 10.616 | 18.959 | 3.390 | 5.170 | ms | -0.3312 | 5.456 | ||
The offset of a server in seconds. This is useful to see how the measured offset is behaving.
The chart also plots offset±rtt, where rtt is the round trip time to the server. NTP can not really know the offset of a remote chimer, NTP computes it by subtracting rtt/2 from the offset. Plotting the offset±rtt reverses this calculation to more easily see the effects of rtt changes.
Closer to 0s is better. An ideal system would be a horizontal line at 0s. Typical 90% ranges may be: local LAN server 80µs; 90% ranges for WAN server may be 4ms and much larger.
Clock Offset is field 5 in the peerstats log file. The Round Trip Time (rtt) is field 6 in the peerstats log file.
Server Offset 49.12.103.123

| Percentiles...... | Ranges...... | Skew- | Kurt- | |||||||||||||
| Name | Min | 1% | 5% | 50% | 95% | 99% | Max | 90% | 98% | StdDev | Mean | Units | ness | osis | ||
| Server Offset 49.12.103.123 | -104.453 | -96.809 | -69.563 | -6.510 | 5.027 | 15.191 | 21.860 | 74.590 | 112.001 | 23.412 | -14.909 | ms | -1.735 | 5.73 | ||
The offset of a server in seconds. This is useful to see how the measured offset is behaving.
The chart also plots offset±rtt, where rtt is the round trip time to the server. NTP can not really know the offset of a remote chimer, NTP computes it by subtracting rtt/2 from the offset. Plotting the offset±rtt reverses this calculation to more easily see the effects of rtt changes.
Closer to 0s is better. An ideal system would be a horizontal line at 0s. Typical 90% ranges may be: local LAN server 80µs; 90% ranges for WAN server may be 4ms and much larger.
Clock Offset is field 5 in the peerstats log file. The Round Trip Time (rtt) is field 6 in the peerstats log file.
Server Offset 5.161.111.190

| Percentiles...... | Ranges...... | Skew- | Kurt- | |||||||||||||
| Name | Min | 1% | 5% | 50% | 95% | 99% | Max | 90% | 98% | StdDev | Mean | Units | ness | osis | ||
| Server Offset 5.161.111.190 | -18.177 | -13.919 | -7.797 | -3.175 | 1.189 | 3.412 | 7.582 | 8.985 | 17.330 | 3.150 | -3.351 | ms | -0.7991 | 5.935 | ||
The offset of a server in seconds. This is useful to see how the measured offset is behaving.
The chart also plots offset±rtt, where rtt is the round trip time to the server. NTP can not really know the offset of a remote chimer, NTP computes it by subtracting rtt/2 from the offset. Plotting the offset±rtt reverses this calculation to more easily see the effects of rtt changes.
Closer to 0s is better. An ideal system would be a horizontal line at 0s. Typical 90% ranges may be: local LAN server 80µs; 90% ranges for WAN server may be 4ms and much larger.
Clock Offset is field 5 in the peerstats log file. The Round Trip Time (rtt) is field 6 in the peerstats log file.
Server Offset 5.161.65.34

| Percentiles...... | Ranges...... | Skew- | Kurt- | |||||||||||||
| Name | Min | 1% | 5% | 50% | 95% | 99% | Max | 90% | 98% | StdDev | Mean | Units | ness | osis | ||
| Server Offset 5.161.65.34 | -8.208 | -8.208 | -5.991 | -2.626 | 391.162 | 391.162 | 391.162 | 397.153 | 399.370 | 139.388 | 55.456 | ms | 1.96 | 4.843 | ||
The offset of a server in seconds. This is useful to see how the measured offset is behaving.
The chart also plots offset±rtt, where rtt is the round trip time to the server. NTP can not really know the offset of a remote chimer, NTP computes it by subtracting rtt/2 from the offset. Plotting the offset±rtt reverses this calculation to more easily see the effects of rtt changes.
Closer to 0s is better. An ideal system would be a horizontal line at 0s. Typical 90% ranges may be: local LAN server 80µs; 90% ranges for WAN server may be 4ms and much larger.
Clock Offset is field 5 in the peerstats log file. The Round Trip Time (rtt) is field 6 in the peerstats log file.
Server Offset 5.161.94.12

| Percentiles...... | Ranges...... | Skew- | Kurt- | |||||||||||||
| Name | Min | 1% | 5% | 50% | 95% | 99% | Max | 90% | 98% | StdDev | Mean | Units | ness | osis | ||
| Server Offset 5.161.94.12 | -26.311 | -6.511 | -4.811 | -1.264 | 2.953 | 5.663 | 14.347 | 7.764 | 12.174 | 2.580 | -1.106 | ms | -0.4285 | 13.42 | ||
The offset of a server in seconds. This is useful to see how the measured offset is behaving.
The chart also plots offset±rtt, where rtt is the round trip time to the server. NTP can not really know the offset of a remote chimer, NTP computes it by subtracting rtt/2 from the offset. Plotting the offset±rtt reverses this calculation to more easily see the effects of rtt changes.
Closer to 0s is better. An ideal system would be a horizontal line at 0s. Typical 90% ranges may be: local LAN server 80µs; 90% ranges for WAN server may be 4ms and much larger.
Clock Offset is field 5 in the peerstats log file. The Round Trip Time (rtt) is field 6 in the peerstats log file.
Server Offset 5.57.11.195
| Percentiles...... | Ranges...... | Skew- | Kurt- | |||||||||||||
| Name | Min | 1% | 5% | 50% | 95% | 99% | Max | 90% | 98% | StdDev | Mean | Units | ness | osis | ||
| Server Offset 5.57.11.195 | 7.691 | 7.691 | 7.691 | 9.219 | 9.219 | 9.219 | 9.219 | 1.528 | 1.528 | 0.764 | 8.455 | ms | -3.421e-15 | 1 | ||
The offset of a server in seconds. This is useful to see how the measured offset is behaving.
The chart also plots offset±rtt, where rtt is the round trip time to the server. NTP can not really know the offset of a remote chimer, NTP computes it by subtracting rtt/2 from the offset. Plotting the offset±rtt reverses this calculation to more easily see the effects of rtt changes.
Closer to 0s is better. An ideal system would be a horizontal line at 0s. Typical 90% ranges may be: local LAN server 80µs; 90% ranges for WAN server may be 4ms and much larger.
Clock Offset is field 5 in the peerstats log file. The Round Trip Time (rtt) is field 6 in the peerstats log file.
Server Offset 50.117.3.52

| Percentiles...... | Ranges...... | Skew- | Kurt- | |||||||||||||
| Name | Min | 1% | 5% | 50% | 95% | 99% | Max | 90% | 98% | StdDev | Mean | Units | ness | osis | ||
| Server Offset 50.117.3.52 | -8.085 | -8.085 | -8.085 | -6.204 | -5.368 | -5.368 | -5.368 | 2.717 | 2.717 | 0.914 | -6.560 | ms | -0.319 | 1.928 | ||
The offset of a server in seconds. This is useful to see how the measured offset is behaving.
The chart also plots offset±rtt, where rtt is the round trip time to the server. NTP can not really know the offset of a remote chimer, NTP computes it by subtracting rtt/2 from the offset. Plotting the offset±rtt reverses this calculation to more easily see the effects of rtt changes.
Closer to 0s is better. An ideal system would be a horizontal line at 0s. Typical 90% ranges may be: local LAN server 80µs; 90% ranges for WAN server may be 4ms and much larger.
Clock Offset is field 5 in the peerstats log file. The Round Trip Time (rtt) is field 6 in the peerstats log file.
Server Offset 50.117.3.95

| Percentiles...... | Ranges...... | Skew- | Kurt- | |||||||||||||
| Name | Min | 1% | 5% | 50% | 95% | 99% | Max | 90% | 98% | StdDev | Mean | Units | ness | osis | ||
| Server Offset 50.117.3.95 | -146.276 | -146.219 | -10.118 | -1.240 | 4.708 | 17.495 | 18.465 | 14.826 | 163.714 | 15.817 | -2.959 | ms | -8.266 | 75.32 | ||
The offset of a server in seconds. This is useful to see how the measured offset is behaving.
The chart also plots offset±rtt, where rtt is the round trip time to the server. NTP can not really know the offset of a remote chimer, NTP computes it by subtracting rtt/2 from the offset. Plotting the offset±rtt reverses this calculation to more easily see the effects of rtt changes.
Closer to 0s is better. An ideal system would be a horizontal line at 0s. Typical 90% ranges may be: local LAN server 80µs; 90% ranges for WAN server may be 4ms and much larger.
Clock Offset is field 5 in the peerstats log file. The Round Trip Time (rtt) is field 6 in the peerstats log file.
Server Offset 50.205.57.38

| Percentiles...... | Ranges...... | Skew- | Kurt- | |||||||||||||
| Name | Min | 1% | 5% | 50% | 95% | 99% | Max | 90% | 98% | StdDev | Mean | Units | ness | osis | ||
| Server Offset 50.205.57.38 | -18.950 | -18.950 | -0.288 | 5.249 | 8.633 | 18.417 | 18.417 | 8.921 | 37.367 | 5.890 | 4.328 | ms | -1.998 | 11.57 | ||
The offset of a server in seconds. This is useful to see how the measured offset is behaving.
The chart also plots offset±rtt, where rtt is the round trip time to the server. NTP can not really know the offset of a remote chimer, NTP computes it by subtracting rtt/2 from the offset. Plotting the offset±rtt reverses this calculation to more easily see the effects of rtt changes.
Closer to 0s is better. An ideal system would be a horizontal line at 0s. Typical 90% ranges may be: local LAN server 80µs; 90% ranges for WAN server may be 4ms and much larger.
Clock Offset is field 5 in the peerstats log file. The Round Trip Time (rtt) is field 6 in the peerstats log file.
Server Offset 50.218.103.254

| Percentiles...... | Ranges...... | Skew- | Kurt- | |||||||||||||
| Name | Min | 1% | 5% | 50% | 95% | 99% | Max | 90% | 98% | StdDev | Mean | Units | ness | osis | ||
| Server Offset 50.218.103.254 | -39.877 | -17.266 | -8.068 | 0.913 | 10.777 | 46.263 | 49.954 | 18.845 | 63.530 | 7.541 | 1.212 | ms | 1.76 | 23.37 | ||
The offset of a server in seconds. This is useful to see how the measured offset is behaving.
The chart also plots offset±rtt, where rtt is the round trip time to the server. NTP can not really know the offset of a remote chimer, NTP computes it by subtracting rtt/2 from the offset. Plotting the offset±rtt reverses this calculation to more easily see the effects of rtt changes.
Closer to 0s is better. An ideal system would be a horizontal line at 0s. Typical 90% ranges may be: local LAN server 80µs; 90% ranges for WAN server may be 4ms and much larger.
Clock Offset is field 5 in the peerstats log file. The Round Trip Time (rtt) is field 6 in the peerstats log file.
Server Offset 51.38.58.233

| Percentiles...... | Ranges...... | Skew- | Kurt- | |||||||||||||
| Name | Min | 1% | 5% | 50% | 95% | 99% | Max | 90% | 98% | StdDev | Mean | Units | ness | osis | ||
| Server Offset 51.38.58.233 | -9.884 | -9.426 | -5.732 | 1.681 | 3.951 | 4.658 | 5.143 | 9.683 | 14.084 | 3.080 | 0.771 | ms | -1.604 | 5.182 | ||
The offset of a server in seconds. This is useful to see how the measured offset is behaving.
The chart also plots offset±rtt, where rtt is the round trip time to the server. NTP can not really know the offset of a remote chimer, NTP computes it by subtracting rtt/2 from the offset. Plotting the offset±rtt reverses this calculation to more easily see the effects of rtt changes.
Closer to 0s is better. An ideal system would be a horizontal line at 0s. Typical 90% ranges may be: local LAN server 80µs; 90% ranges for WAN server may be 4ms and much larger.
Clock Offset is field 5 in the peerstats log file. The Round Trip Time (rtt) is field 6 in the peerstats log file.
Server Offset 51.81.226.229

| Percentiles...... | Ranges...... | Skew- | Kurt- | |||||||||||||
| Name | Min | 1% | 5% | 50% | 95% | 99% | Max | 90% | 98% | StdDev | Mean | Units | ness | osis | ||
| Server Offset 51.81.226.229 | -3.807 | -1.522 | 1.150 | 5.163 | 7.612 | 8.830 | 11.602 | 6.462 | 10.352 | 1.992 | 4.930 | ms | -0.7817 | 4.896 | ||
The offset of a server in seconds. This is useful to see how the measured offset is behaving.
The chart also plots offset±rtt, where rtt is the round trip time to the server. NTP can not really know the offset of a remote chimer, NTP computes it by subtracting rtt/2 from the offset. Plotting the offset±rtt reverses this calculation to more easily see the effects of rtt changes.
Closer to 0s is better. An ideal system would be a horizontal line at 0s. Typical 90% ranges may be: local LAN server 80µs; 90% ranges for WAN server may be 4ms and much larger.
Clock Offset is field 5 in the peerstats log file. The Round Trip Time (rtt) is field 6 in the peerstats log file.
Server Offset 64.131.47.178
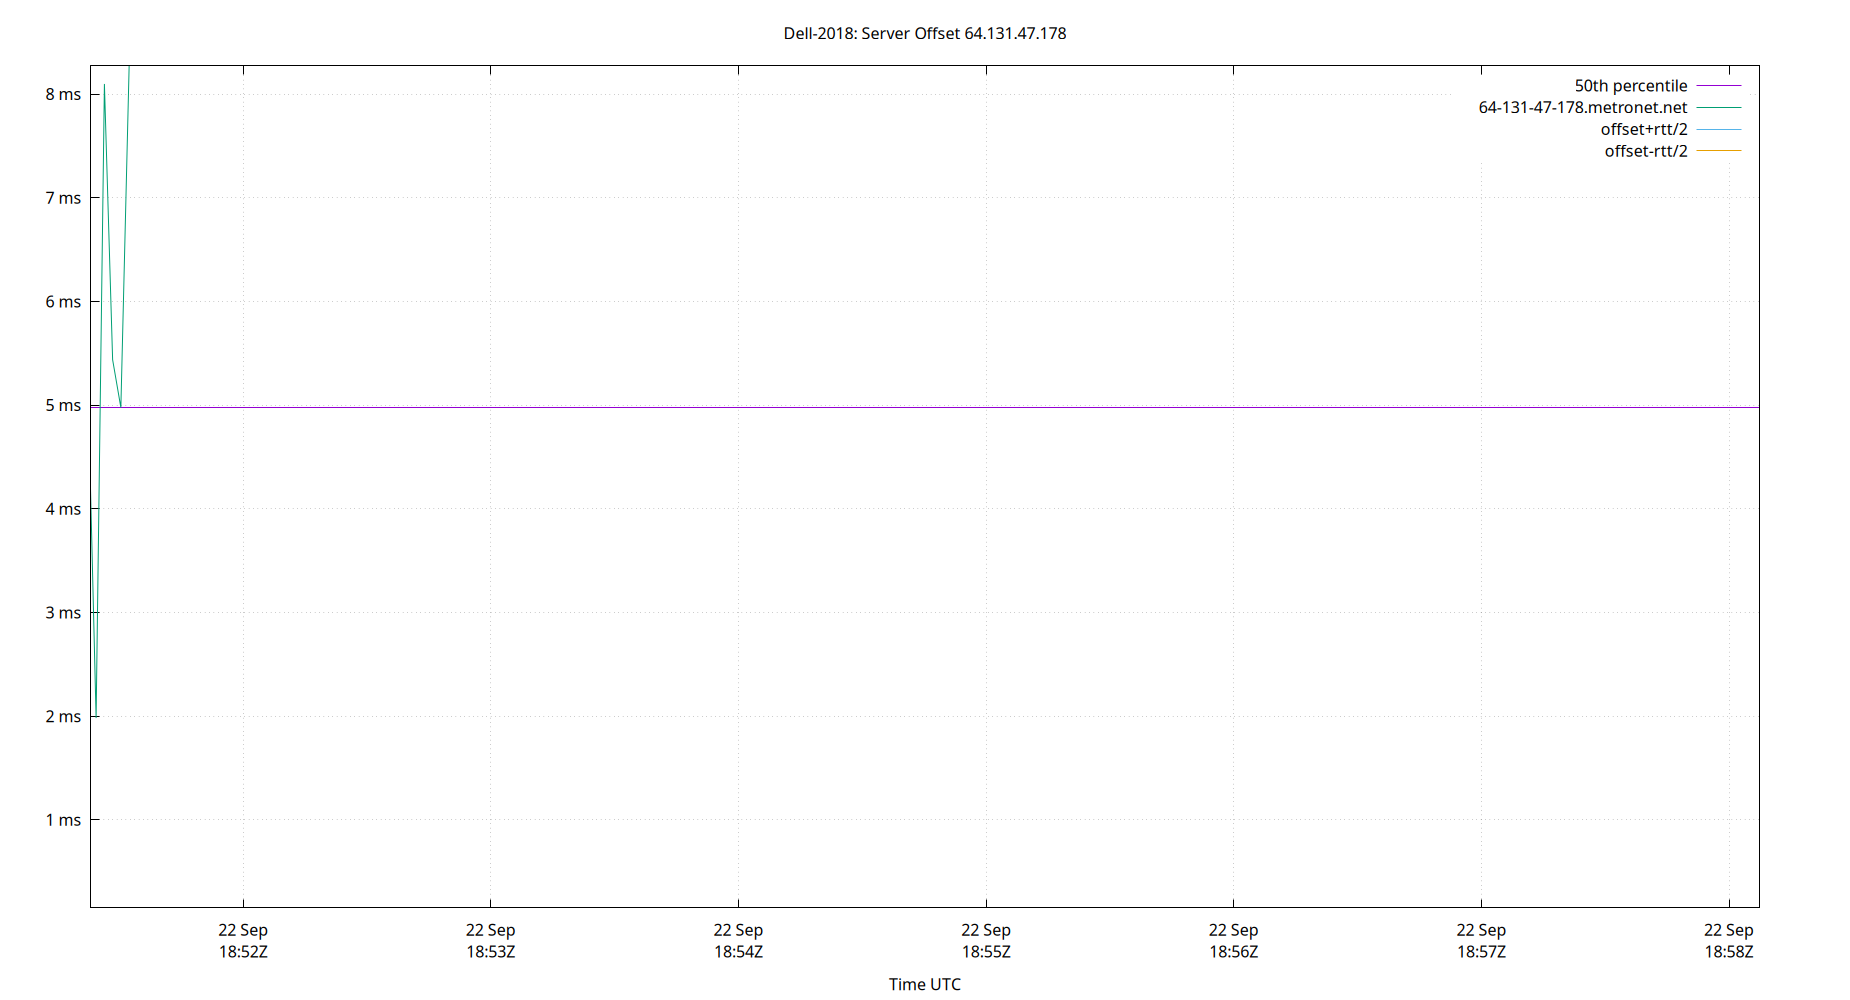
| Percentiles...... | Ranges...... | Skew- | Kurt- | |||||||||||||
| Name | Min | 1% | 5% | 50% | 95% | 99% | Max | 90% | 98% | StdDev | Mean | Units | ness | osis | ||
| Server Offset 64.131.47.178 | 0.150 | 0.150 | 0.150 | 4.977 | 8.272 | 8.272 | 8.272 | 8.122 | 8.122 | 2.758 | 4.730 | ms | -0.2318 | 1.933 | ||
The offset of a server in seconds. This is useful to see how the measured offset is behaving.
The chart also plots offset±rtt, where rtt is the round trip time to the server. NTP can not really know the offset of a remote chimer, NTP computes it by subtracting rtt/2 from the offset. Plotting the offset±rtt reverses this calculation to more easily see the effects of rtt changes.
Closer to 0s is better. An ideal system would be a horizontal line at 0s. Typical 90% ranges may be: local LAN server 80µs; 90% ranges for WAN server may be 4ms and much larger.
Clock Offset is field 5 in the peerstats log file. The Round Trip Time (rtt) is field 6 in the peerstats log file.
Server Offset 64.251.10.152

| Percentiles...... | Ranges...... | Skew- | Kurt- | |||||||||||||
| Name | Min | 1% | 5% | 50% | 95% | 99% | Max | 90% | 98% | StdDev | Mean | Units | ness | osis | ||
| Server Offset 64.251.10.152 | -9.929 | -6.388 | -4.004 | -0.535 | 3.189 | 7.131 | 10.599 | 7.193 | 13.520 | 2.557 | -0.405 | ms | 0.497 | 5.923 | ||
The offset of a server in seconds. This is useful to see how the measured offset is behaving.
The chart also plots offset±rtt, where rtt is the round trip time to the server. NTP can not really know the offset of a remote chimer, NTP computes it by subtracting rtt/2 from the offset. Plotting the offset±rtt reverses this calculation to more easily see the effects of rtt changes.
Closer to 0s is better. An ideal system would be a horizontal line at 0s. Typical 90% ranges may be: local LAN server 80µs; 90% ranges for WAN server may be 4ms and much larger.
Clock Offset is field 5 in the peerstats log file. The Round Trip Time (rtt) is field 6 in the peerstats log file.
Server Offset 64.79.100.197

| Percentiles...... | Ranges...... | Skew- | Kurt- | |||||||||||||
| Name | Min | 1% | 5% | 50% | 95% | 99% | Max | 90% | 98% | StdDev | Mean | Units | ness | osis | ||
| Server Offset 64.79.100.197 | -5.398 | -2.077 | -0.896 | 2.168 | 4.051 | 5.159 | 7.196 | 4.947 | 7.236 | 1.476 | 2.039 | ms | -0.815 | 6.333 | ||
The offset of a server in seconds. This is useful to see how the measured offset is behaving.
The chart also plots offset±rtt, where rtt is the round trip time to the server. NTP can not really know the offset of a remote chimer, NTP computes it by subtracting rtt/2 from the offset. Plotting the offset±rtt reverses this calculation to more easily see the effects of rtt changes.
Closer to 0s is better. An ideal system would be a horizontal line at 0s. Typical 90% ranges may be: local LAN server 80µs; 90% ranges for WAN server may be 4ms and much larger.
Clock Offset is field 5 in the peerstats log file. The Round Trip Time (rtt) is field 6 in the peerstats log file.
Server Offset 65.182.224.39

| Percentiles...... | Ranges...... | Skew- | Kurt- | |||||||||||||
| Name | Min | 1% | 5% | 50% | 95% | 99% | Max | 90% | 98% | StdDev | Mean | Units | ness | osis | ||
| Server Offset 65.182.224.39 | -19.040 | -5.987 | -1.441 | 1.538 | 6.062 | 11.148 | 17.628 | 7.503 | 17.136 | 3.013 | 1.733 | ms | -0.05078 | 18.55 | ||
The offset of a server in seconds. This is useful to see how the measured offset is behaving.
The chart also plots offset±rtt, where rtt is the round trip time to the server. NTP can not really know the offset of a remote chimer, NTP computes it by subtracting rtt/2 from the offset. Plotting the offset±rtt reverses this calculation to more easily see the effects of rtt changes.
Closer to 0s is better. An ideal system would be a horizontal line at 0s. Typical 90% ranges may be: local LAN server 80µs; 90% ranges for WAN server may be 4ms and much larger.
Clock Offset is field 5 in the peerstats log file. The Round Trip Time (rtt) is field 6 in the peerstats log file.
Server Offset 65.182.224.60

| Percentiles...... | Ranges...... | Skew- | Kurt- | |||||||||||||
| Name | Min | 1% | 5% | 50% | 95% | 99% | Max | 90% | 98% | StdDev | Mean | Units | ness | osis | ||
| Server Offset 65.182.224.60 | -4.897 | -4.897 | -2.203 | 1.449 | 6.846 | 10.883 | 10.883 | 9.048 | 15.780 | 2.958 | 1.749 | ms | 0.4925 | 3.551 | ||
The offset of a server in seconds. This is useful to see how the measured offset is behaving.
The chart also plots offset±rtt, where rtt is the round trip time to the server. NTP can not really know the offset of a remote chimer, NTP computes it by subtracting rtt/2 from the offset. Plotting the offset±rtt reverses this calculation to more easily see the effects of rtt changes.
Closer to 0s is better. An ideal system would be a horizontal line at 0s. Typical 90% ranges may be: local LAN server 80µs; 90% ranges for WAN server may be 4ms and much larger.
Clock Offset is field 5 in the peerstats log file. The Round Trip Time (rtt) is field 6 in the peerstats log file.
Server Offset 66.118.228.14

| Percentiles...... | Ranges...... | Skew- | Kurt- | |||||||||||||
| Name | Min | 1% | 5% | 50% | 95% | 99% | Max | 90% | 98% | StdDev | Mean | Units | ness | osis | ||
| Server Offset 66.118.228.14 | -333.165 | -10.163 | -2.631 | 4.084 | 8.349 | 9.848 | 12.691 | 10.980 | 20.011 | 25.449 | 1.791 | ms | -12.74 | 167.1 | ||
The offset of a server in seconds. This is useful to see how the measured offset is behaving.
The chart also plots offset±rtt, where rtt is the round trip time to the server. NTP can not really know the offset of a remote chimer, NTP computes it by subtracting rtt/2 from the offset. Plotting the offset±rtt reverses this calculation to more easily see the effects of rtt changes.
Closer to 0s is better. An ideal system would be a horizontal line at 0s. Typical 90% ranges may be: local LAN server 80µs; 90% ranges for WAN server may be 4ms and much larger.
Clock Offset is field 5 in the peerstats log file. The Round Trip Time (rtt) is field 6 in the peerstats log file.
Server Offset 66.118.229.14

| Percentiles...... | Ranges...... | Skew- | Kurt- | |||||||||||||
| Name | Min | 1% | 5% | 50% | 95% | 99% | Max | 90% | 98% | StdDev | Mean | Units | ness | osis | ||
| Server Offset 66.118.229.14 | -46.204 | -13.396 | -8.297 | 4.542 | 8.438 | 12.813 | 14.060 | 16.735 | 26.209 | 5.776 | 3.279 | ms | -3.792 | 28.07 | ||
The offset of a server in seconds. This is useful to see how the measured offset is behaving.
The chart also plots offset±rtt, where rtt is the round trip time to the server. NTP can not really know the offset of a remote chimer, NTP computes it by subtracting rtt/2 from the offset. Plotting the offset±rtt reverses this calculation to more easily see the effects of rtt changes.
Closer to 0s is better. An ideal system would be a horizontal line at 0s. Typical 90% ranges may be: local LAN server 80µs; 90% ranges for WAN server may be 4ms and much larger.
Clock Offset is field 5 in the peerstats log file. The Round Trip Time (rtt) is field 6 in the peerstats log file.
Server Offset 66.118.231.14

| Percentiles...... | Ranges...... | Skew- | Kurt- | |||||||||||||
| Name | Min | 1% | 5% | 50% | 95% | 99% | Max | 90% | 98% | StdDev | Mean | Units | ness | osis | ||
| Server Offset 66.118.231.14 | -0.952 | -0.952 | -0.952 | 0.349 | 4.672 | 4.672 | 4.672 | 5.623 | 5.623 | 1.689 | 0.982 | ms | 1.225 | 3.534 | ||
The offset of a server in seconds. This is useful to see how the measured offset is behaving.
The chart also plots offset±rtt, where rtt is the round trip time to the server. NTP can not really know the offset of a remote chimer, NTP computes it by subtracting rtt/2 from the offset. Plotting the offset±rtt reverses this calculation to more easily see the effects of rtt changes.
Closer to 0s is better. An ideal system would be a horizontal line at 0s. Typical 90% ranges may be: local LAN server 80µs; 90% ranges for WAN server may be 4ms and much larger.
Clock Offset is field 5 in the peerstats log file. The Round Trip Time (rtt) is field 6 in the peerstats log file.
Server Offset 67.210.96.32
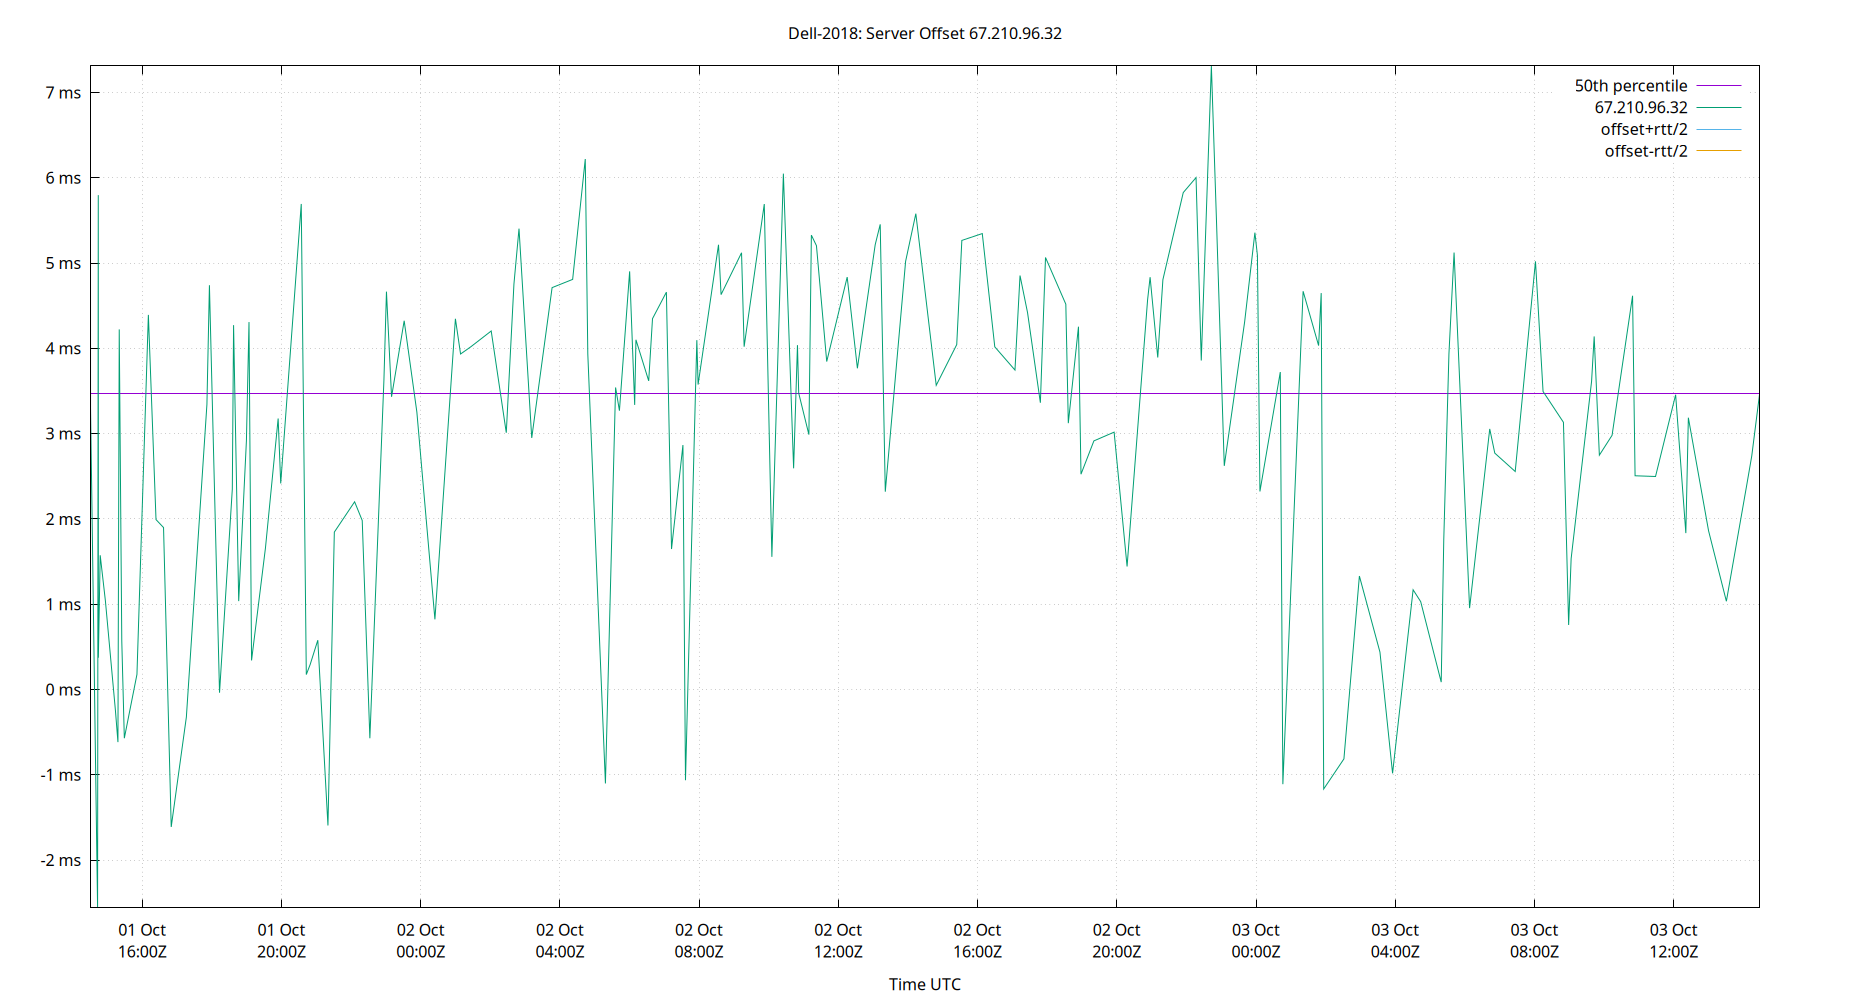
| Percentiles...... | Ranges...... | Skew- | Kurt- | |||||||||||||
| Name | Min | 1% | 5% | 50% | 95% | 99% | Max | 90% | 98% | StdDev | Mean | Units | ness | osis | ||
| Server Offset 67.210.96.32 | -2.561 | -1.611 | -0.813 | 3.475 | 5.579 | 6.219 | 7.311 | 6.392 | 7.831 | 1.943 | 3.069 | ms | -0.6649 | 2.816 | ||
The offset of a server in seconds. This is useful to see how the measured offset is behaving.
The chart also plots offset±rtt, where rtt is the round trip time to the server. NTP can not really know the offset of a remote chimer, NTP computes it by subtracting rtt/2 from the offset. Plotting the offset±rtt reverses this calculation to more easily see the effects of rtt changes.
Closer to 0s is better. An ideal system would be a horizontal line at 0s. Typical 90% ranges may be: local LAN server 80µs; 90% ranges for WAN server may be 4ms and much larger.
Clock Offset is field 5 in the peerstats log file. The Round Trip Time (rtt) is field 6 in the peerstats log file.
Server Offset 67.217.246.204

| Percentiles...... | Ranges...... | Skew- | Kurt- | |||||||||||||
| Name | Min | 1% | 5% | 50% | 95% | 99% | Max | 90% | 98% | StdDev | Mean | Units | ness | osis | ||
| Server Offset 67.217.246.204 | -33.203 | -20.781 | -6.815 | -1.590 | 2.829 | 8.831 | 423.145 | 9.644 | 29.611 | 19.691 | -1.014 | ms | 20.08 | 430.2 | ||
The offset of a server in seconds. This is useful to see how the measured offset is behaving.
The chart also plots offset±rtt, where rtt is the round trip time to the server. NTP can not really know the offset of a remote chimer, NTP computes it by subtracting rtt/2 from the offset. Plotting the offset±rtt reverses this calculation to more easily see the effects of rtt changes.
Closer to 0s is better. An ideal system would be a horizontal line at 0s. Typical 90% ranges may be: local LAN server 80µs; 90% ranges for WAN server may be 4ms and much larger.
Clock Offset is field 5 in the peerstats log file. The Round Trip Time (rtt) is field 6 in the peerstats log file.
Server Offset 68.183.147.240
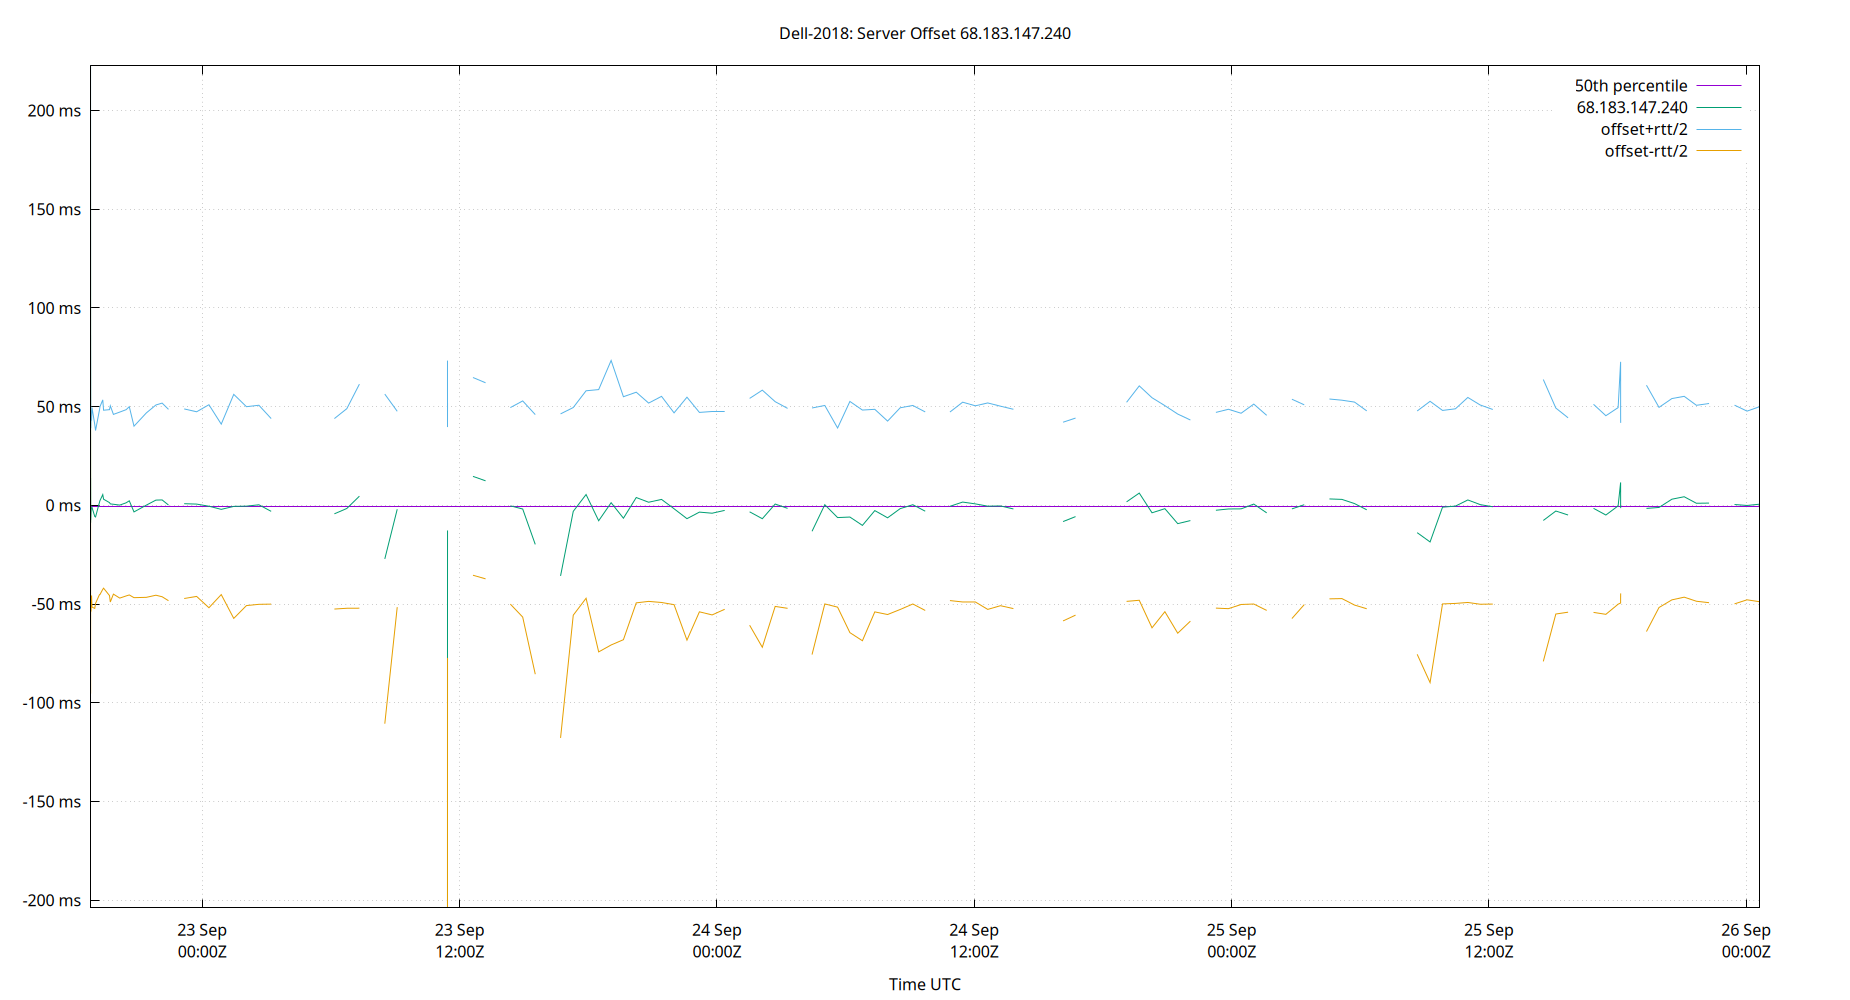
| Percentiles...... | Ranges...... | Skew- | Kurt- | |||||||||||||
| Name | Min | 1% | 5% | 50% | 95% | 99% | Max | 90% | 98% | StdDev | Mean | Units | ness | osis | ||
| Server Offset 68.183.147.240 | -203.968 | -76.027 | -18.550 | -0.728 | 11.605 | 220.740 | 222.620 | 30.155 | 296.767 | 38.326 | 0.582 | ms | 2.949 | 29.87 | ||
The offset of a server in seconds. This is useful to see how the measured offset is behaving.
The chart also plots offset±rtt, where rtt is the round trip time to the server. NTP can not really know the offset of a remote chimer, NTP computes it by subtracting rtt/2 from the offset. Plotting the offset±rtt reverses this calculation to more easily see the effects of rtt changes.
Closer to 0s is better. An ideal system would be a horizontal line at 0s. Typical 90% ranges may be: local LAN server 80µs; 90% ranges for WAN server may be 4ms and much larger.
Clock Offset is field 5 in the peerstats log file. The Round Trip Time (rtt) is field 6 in the peerstats log file.
Server Offset 69.172.133.130

| Percentiles...... | Ranges...... | Skew- | Kurt- | |||||||||||||
| Name | Min | 1% | 5% | 50% | 95% | 99% | Max | 90% | 98% | StdDev | Mean | Units | ness | osis | ||
| Server Offset 69.172.133.130 | -90.322 | -90.322 | -90.322 | -0.456 | 5.333 | 5.333 | 5.333 | 95.655 | 95.655 | 30.376 | -13.340 | ms | -1.942 | 5.071 | ||
The offset of a server in seconds. This is useful to see how the measured offset is behaving.
The chart also plots offset±rtt, where rtt is the round trip time to the server. NTP can not really know the offset of a remote chimer, NTP computes it by subtracting rtt/2 from the offset. Plotting the offset±rtt reverses this calculation to more easily see the effects of rtt changes.
Closer to 0s is better. An ideal system would be a horizontal line at 0s. Typical 90% ranges may be: local LAN server 80µs; 90% ranges for WAN server may be 4ms and much larger.
Clock Offset is field 5 in the peerstats log file. The Round Trip Time (rtt) is field 6 in the peerstats log file.
Server Offset 69.176.84.38

| Percentiles...... | Ranges...... | Skew- | Kurt- | |||||||||||||
| Name | Min | 1% | 5% | 50% | 95% | 99% | Max | 90% | 98% | StdDev | Mean | Units | ness | osis | ||
| Server Offset 69.176.84.38 | -4.887 | -4.887 | -3.512 | 1.450 | 3.073 | 4.499 | 4.499 | 6.585 | 9.386 | 2.266 | 0.622 | ms | -0.718 | 2.493 | ||
The offset of a server in seconds. This is useful to see how the measured offset is behaving.
The chart also plots offset±rtt, where rtt is the round trip time to the server. NTP can not really know the offset of a remote chimer, NTP computes it by subtracting rtt/2 from the offset. Plotting the offset±rtt reverses this calculation to more easily see the effects of rtt changes.
Closer to 0s is better. An ideal system would be a horizontal line at 0s. Typical 90% ranges may be: local LAN server 80µs; 90% ranges for WAN server may be 4ms and much larger.
Clock Offset is field 5 in the peerstats log file. The Round Trip Time (rtt) is field 6 in the peerstats log file.
Server Offset 69.89.207.199

| Percentiles...... | Ranges...... | Skew- | Kurt- | |||||||||||||
| Name | Min | 1% | 5% | 50% | 95% | 99% | Max | 90% | 98% | StdDev | Mean | Units | ness | osis | ||
| Server Offset 69.89.207.199 | -132.300 | -132.300 | -130.922 | -1.862 | 424.453 | 425.249 | 425.249 | 555.375 | 557.549 | 131.058 | 7.224 | ms | 1.983 | 7.38 | ||
The offset of a server in seconds. This is useful to see how the measured offset is behaving.
The chart also plots offset±rtt, where rtt is the round trip time to the server. NTP can not really know the offset of a remote chimer, NTP computes it by subtracting rtt/2 from the offset. Plotting the offset±rtt reverses this calculation to more easily see the effects of rtt changes.
Closer to 0s is better. An ideal system would be a horizontal line at 0s. Typical 90% ranges may be: local LAN server 80µs; 90% ranges for WAN server may be 4ms and much larger.
Clock Offset is field 5 in the peerstats log file. The Round Trip Time (rtt) is field 6 in the peerstats log file.
Server Offset 69.89.207.99

| Percentiles...... | Ranges...... | Skew- | Kurt- | |||||||||||||
| Name | Min | 1% | 5% | 50% | 95% | 99% | Max | 90% | 98% | StdDev | Mean | Units | ness | osis | ||
| Server Offset 69.89.207.99 | -82.728 | -4.013 | -2.302 | 1.660 | 4.470 | 7.036 | 20.985 | 6.773 | 11.049 | 3.084 | 1.469 | ms | -10.36 | 286.7 | ||
The offset of a server in seconds. This is useful to see how the measured offset is behaving.
The chart also plots offset±rtt, where rtt is the round trip time to the server. NTP can not really know the offset of a remote chimer, NTP computes it by subtracting rtt/2 from the offset. Plotting the offset±rtt reverses this calculation to more easily see the effects of rtt changes.
Closer to 0s is better. An ideal system would be a horizontal line at 0s. Typical 90% ranges may be: local LAN server 80µs; 90% ranges for WAN server may be 4ms and much larger.
Clock Offset is field 5 in the peerstats log file. The Round Trip Time (rtt) is field 6 in the peerstats log file.
Server Offset 71.19.144.140

| Percentiles...... | Ranges...... | Skew- | Kurt- | |||||||||||||
| Name | Min | 1% | 5% | 50% | 95% | 99% | Max | 90% | 98% | StdDev | Mean | Units | ness | osis | ||
| Server Offset 71.19.144.140 | -3.221 | -3.221 | -3.221 | 4.015 | 7.428 | 7.428 | 7.428 | 10.649 | 10.649 | 2.867 | 3.283 | ms | -0.3728 | 2.496 | ||
The offset of a server in seconds. This is useful to see how the measured offset is behaving.
The chart also plots offset±rtt, where rtt is the round trip time to the server. NTP can not really know the offset of a remote chimer, NTP computes it by subtracting rtt/2 from the offset. Plotting the offset±rtt reverses this calculation to more easily see the effects of rtt changes.
Closer to 0s is better. An ideal system would be a horizontal line at 0s. Typical 90% ranges may be: local LAN server 80µs; 90% ranges for WAN server may be 4ms and much larger.
Clock Offset is field 5 in the peerstats log file. The Round Trip Time (rtt) is field 6 in the peerstats log file.
Server Offset 72.14.182.49

| Percentiles...... | Ranges...... | Skew- | Kurt- | |||||||||||||
| Name | Min | 1% | 5% | 50% | 95% | 99% | Max | 90% | 98% | StdDev | Mean | Units | ness | osis | ||
| Server Offset 72.14.182.49 | -1.532 | -0.973 | 0.417 | 4.164 | 7.308 | 8.085 | 8.396 | 6.891 | 9.058 | 1.895 | 4.150 | ms | -0.3723 | 3.354 | ||
The offset of a server in seconds. This is useful to see how the measured offset is behaving.
The chart also plots offset±rtt, where rtt is the round trip time to the server. NTP can not really know the offset of a remote chimer, NTP computes it by subtracting rtt/2 from the offset. Plotting the offset±rtt reverses this calculation to more easily see the effects of rtt changes.
Closer to 0s is better. An ideal system would be a horizontal line at 0s. Typical 90% ranges may be: local LAN server 80µs; 90% ranges for WAN server may be 4ms and much larger.
Clock Offset is field 5 in the peerstats log file. The Round Trip Time (rtt) is field 6 in the peerstats log file.
Server Offset 72.14.183.39

| Percentiles...... | Ranges...... | Skew- | Kurt- | |||||||||||||
| Name | Min | 1% | 5% | 50% | 95% | 99% | Max | 90% | 98% | StdDev | Mean | Units | ness | osis | ||
| Server Offset 72.14.183.39 | 5.676 | 5.676 | 5.676 | 6.591 | 11.748 | 11.748 | 11.748 | 6.071 | 6.071 | 2.174 | 7.473 | ms | 1.37 | 3.097 | ||
The offset of a server in seconds. This is useful to see how the measured offset is behaving.
The chart also plots offset±rtt, where rtt is the round trip time to the server. NTP can not really know the offset of a remote chimer, NTP computes it by subtracting rtt/2 from the offset. Plotting the offset±rtt reverses this calculation to more easily see the effects of rtt changes.
Closer to 0s is better. An ideal system would be a horizontal line at 0s. Typical 90% ranges may be: local LAN server 80µs; 90% ranges for WAN server may be 4ms and much larger.
Clock Offset is field 5 in the peerstats log file. The Round Trip Time (rtt) is field 6 in the peerstats log file.
Server Offset 72.14.186.59

| Percentiles...... | Ranges...... | Skew- | Kurt- | |||||||||||||
| Name | Min | 1% | 5% | 50% | 95% | 99% | Max | 90% | 98% | StdDev | Mean | Units | ness | osis | ||
| Server Offset 72.14.186.59 | -10.962 | -10.962 | -6.498 | 5.374 | 7.467 | 8.444 | 8.444 | 13.965 | 19.405 | 4.758 | 3.225 | ms | -1.263 | 3.404 | ||
The offset of a server in seconds. This is useful to see how the measured offset is behaving.
The chart also plots offset±rtt, where rtt is the round trip time to the server. NTP can not really know the offset of a remote chimer, NTP computes it by subtracting rtt/2 from the offset. Plotting the offset±rtt reverses this calculation to more easily see the effects of rtt changes.
Closer to 0s is better. An ideal system would be a horizontal line at 0s. Typical 90% ranges may be: local LAN server 80µs; 90% ranges for WAN server may be 4ms and much larger.
Clock Offset is field 5 in the peerstats log file. The Round Trip Time (rtt) is field 6 in the peerstats log file.
Server Offset 72.30.35.88
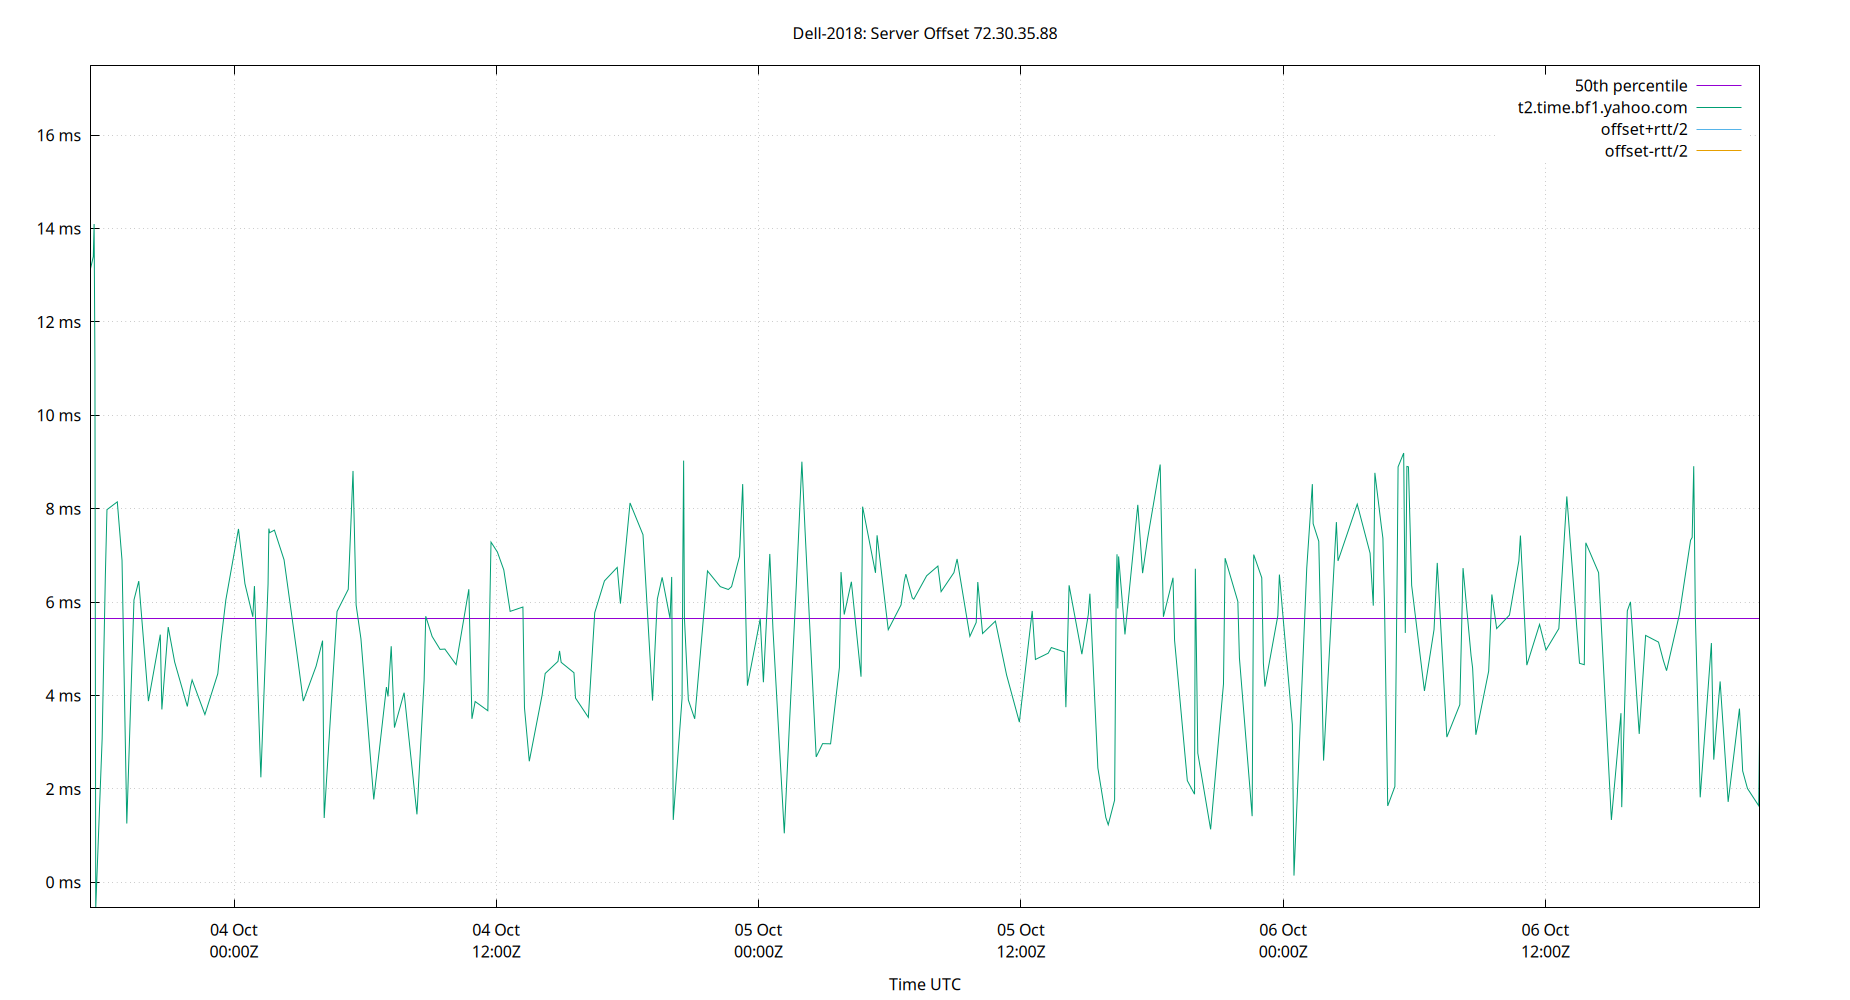
| Percentiles...... | Ranges...... | Skew- | Kurt- | |||||||||||||
| Name | Min | 1% | 5% | 50% | 95% | 99% | Max | 90% | 98% | StdDev | Mean | Units | ness | osis | ||
| Server Offset 72.30.35.88 | -0.550 | 1.048 | 1.636 | 5.649 | 8.897 | 13.400 | 17.485 | 7.262 | 12.352 | 2.267 | 5.458 | ms | 0.7578 | 6.645 | ||
The offset of a server in seconds. This is useful to see how the measured offset is behaving.
The chart also plots offset±rtt, where rtt is the round trip time to the server. NTP can not really know the offset of a remote chimer, NTP computes it by subtracting rtt/2 from the offset. Plotting the offset±rtt reverses this calculation to more easily see the effects of rtt changes.
Closer to 0s is better. An ideal system would be a horizontal line at 0s. Typical 90% ranges may be: local LAN server 80µs; 90% ranges for WAN server may be 4ms and much larger.
Clock Offset is field 5 in the peerstats log file. The Round Trip Time (rtt) is field 6 in the peerstats log file.
Server Offset 73.185.182.209

| Percentiles...... | Ranges...... | Skew- | Kurt- | |||||||||||||
| Name | Min | 1% | 5% | 50% | 95% | 99% | Max | 90% | 98% | StdDev | Mean | Units | ness | osis | ||
| Server Offset 73.185.182.209 | -385.027 | -375.515 | -5.663 | 1.418 | 6.214 | 8.598 | 12.049 | 11.877 | 384.113 | 43.260 | -3.630 | ms | -8.549 | 74.53 | ||
The offset of a server in seconds. This is useful to see how the measured offset is behaving.
The chart also plots offset±rtt, where rtt is the round trip time to the server. NTP can not really know the offset of a remote chimer, NTP computes it by subtracting rtt/2 from the offset. Plotting the offset±rtt reverses this calculation to more easily see the effects of rtt changes.
Closer to 0s is better. An ideal system would be a horizontal line at 0s. Typical 90% ranges may be: local LAN server 80µs; 90% ranges for WAN server may be 4ms and much larger.
Clock Offset is field 5 in the peerstats log file. The Round Trip Time (rtt) is field 6 in the peerstats log file.
Server Offset 74.208.14.149

| Percentiles...... | Ranges...... | Skew- | Kurt- | |||||||||||||
| Name | Min | 1% | 5% | 50% | 95% | 99% | Max | 90% | 98% | StdDev | Mean | Units | ness | osis | ||
| Server Offset 74.208.14.149 | -23.137 | -21.739 | -17.023 | -4.566 | -0.923 | 12.871 | 14.795 | 16.100 | 34.610 | 4.966 | -5.349 | ms | -0.1748 | 8.229 | ||
The offset of a server in seconds. This is useful to see how the measured offset is behaving.
The chart also plots offset±rtt, where rtt is the round trip time to the server. NTP can not really know the offset of a remote chimer, NTP computes it by subtracting rtt/2 from the offset. Plotting the offset±rtt reverses this calculation to more easily see the effects of rtt changes.
Closer to 0s is better. An ideal system would be a horizontal line at 0s. Typical 90% ranges may be: local LAN server 80µs; 90% ranges for WAN server may be 4ms and much larger.
Clock Offset is field 5 in the peerstats log file. The Round Trip Time (rtt) is field 6 in the peerstats log file.
Server Offset 77.37.97.124

| Percentiles...... | Ranges...... | Skew- | Kurt- | |||||||||||||
| Name | Min | 1% | 5% | 50% | 95% | 99% | Max | 90% | 98% | StdDev | Mean | Units | ness | osis | ||
| Server Offset 77.37.97.124 | -93.402 | -30.088 | -6.553 | 8.715 | 13.063 | 17.416 | 35.796 | 19.617 | 47.504 | 8.901 | 6.769 | ms | -5.017 | 41.06 | ||
The offset of a server in seconds. This is useful to see how the measured offset is behaving.
The chart also plots offset±rtt, where rtt is the round trip time to the server. NTP can not really know the offset of a remote chimer, NTP computes it by subtracting rtt/2 from the offset. Plotting the offset±rtt reverses this calculation to more easily see the effects of rtt changes.
Closer to 0s is better. An ideal system would be a horizontal line at 0s. Typical 90% ranges may be: local LAN server 80µs; 90% ranges for WAN server may be 4ms and much larger.
Clock Offset is field 5 in the peerstats log file. The Round Trip Time (rtt) is field 6 in the peerstats log file.
Server Offset 77.42.37.85

| Percentiles...... | Ranges...... | Skew- | Kurt- | |||||||||||||
| Name | Min | 1% | 5% | 50% | 95% | 99% | Max | 90% | 98% | StdDev | Mean | Units | ness | osis | ||
| Server Offset 77.42.37.85 | -88.107 | -40.517 | -8.386 | 1.614 | 4.988 | 9.257 | 17.475 | 13.374 | 49.775 | 7.967 | 0.338 | ms | -6.267 | 52.3 | ||
The offset of a server in seconds. This is useful to see how the measured offset is behaving.
The chart also plots offset±rtt, where rtt is the round trip time to the server. NTP can not really know the offset of a remote chimer, NTP computes it by subtracting rtt/2 from the offset. Plotting the offset±rtt reverses this calculation to more easily see the effects of rtt changes.
Closer to 0s is better. An ideal system would be a horizontal line at 0s. Typical 90% ranges may be: local LAN server 80µs; 90% ranges for WAN server may be 4ms and much larger.
Clock Offset is field 5 in the peerstats log file. The Round Trip Time (rtt) is field 6 in the peerstats log file.
Server Offset 79.160.225.13

| Percentiles...... | Ranges...... | Skew- | Kurt- | |||||||||||||
| Name | Min | 1% | 5% | 50% | 95% | 99% | Max | 90% | 98% | StdDev | Mean | Units | ness | osis | ||
| Server Offset 79.160.225.13 | -64.543 | -22.125 | -6.189 | -1.934 | 0.842 | 3.006 | 11.556 | 7.031 | 25.131 | 4.902 | -2.553 | ms | -7.128 | 70.98 | ||
The offset of a server in seconds. This is useful to see how the measured offset is behaving.
The chart also plots offset±rtt, where rtt is the round trip time to the server. NTP can not really know the offset of a remote chimer, NTP computes it by subtracting rtt/2 from the offset. Plotting the offset±rtt reverses this calculation to more easily see the effects of rtt changes.
Closer to 0s is better. An ideal system would be a horizontal line at 0s. Typical 90% ranges may be: local LAN server 80µs; 90% ranges for WAN server may be 4ms and much larger.
Clock Offset is field 5 in the peerstats log file. The Round Trip Time (rtt) is field 6 in the peerstats log file.
Server Offset 83.228.206.15

| Percentiles...... | Ranges...... | Skew- | Kurt- | |||||||||||||
| Name | Min | 1% | 5% | 50% | 95% | 99% | Max | 90% | 98% | StdDev | Mean | Units | ness | osis | ||
| Server Offset 83.228.206.15 | -137.287 | -103.254 | -84.102 | -4.454 | 5.321 | 17.569 | 31.867 | 89.423 | 120.823 | 27.221 | -15.904 | ms | -1.832 | 6.201 | ||
The offset of a server in seconds. This is useful to see how the measured offset is behaving.
The chart also plots offset±rtt, where rtt is the round trip time to the server. NTP can not really know the offset of a remote chimer, NTP computes it by subtracting rtt/2 from the offset. Plotting the offset±rtt reverses this calculation to more easily see the effects of rtt changes.
Closer to 0s is better. An ideal system would be a horizontal line at 0s. Typical 90% ranges may be: local LAN server 80µs; 90% ranges for WAN server may be 4ms and much larger.
Clock Offset is field 5 in the peerstats log file. The Round Trip Time (rtt) is field 6 in the peerstats log file.
Server Offset 91.224.149.196
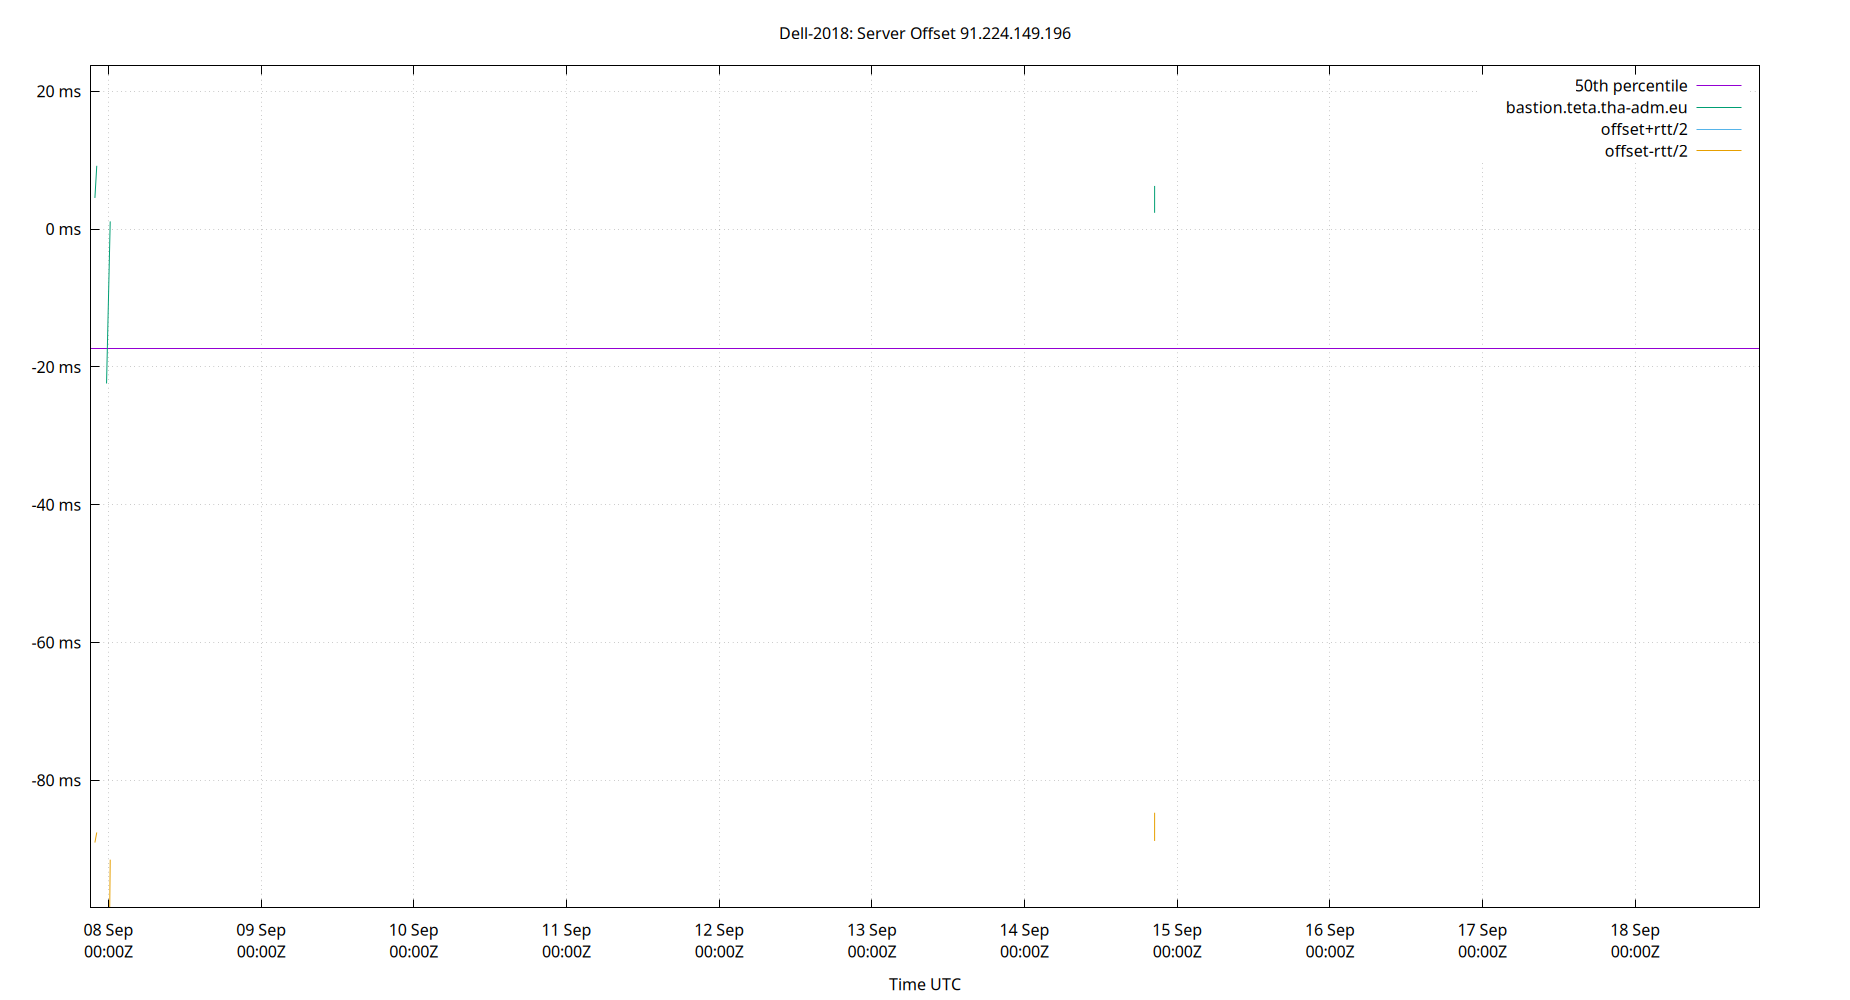
| Percentiles...... | Ranges...... | Skew- | Kurt- | |||||||||||||
| Name | Min | 1% | 5% | 50% | 95% | 99% | Max | 90% | 98% | StdDev | Mean | Units | ness | osis | ||
| Server Offset 91.224.149.196 | -121.847 | -98.542 | -75.284 | -8.905 | 7.896 | 14.505 | 23.694 | 83.180 | 113.048 | 27.019 | -18.387 | ms | -1.305 | 4.331 | ||
The offset of a server in seconds. This is useful to see how the measured offset is behaving.
The chart also plots offset±rtt, where rtt is the round trip time to the server. NTP can not really know the offset of a remote chimer, NTP computes it by subtracting rtt/2 from the offset. Plotting the offset±rtt reverses this calculation to more easily see the effects of rtt changes.
Closer to 0s is better. An ideal system would be a horizontal line at 0s. Typical 90% ranges may be: local LAN server 80µs; 90% ranges for WAN server may be 4ms and much larger.
Clock Offset is field 5 in the peerstats log file. The Round Trip Time (rtt) is field 6 in the peerstats log file.
Server Offset 94.198.159.11

| Percentiles...... | Ranges...... | Skew- | Kurt- | |||||||||||||
| Name | Min | 1% | 5% | 50% | 95% | 99% | Max | 90% | 98% | StdDev | Mean | Units | ness | osis | ||
| Server Offset 94.198.159.11 | 7.026 | 7.026 | 7.026 | 9.843 | 9.843 | 9.843 | 9.843 | 2.818 | 2.818 | 1.409 | 8.435 | ms | 0 | 1 | ||
The offset of a server in seconds. This is useful to see how the measured offset is behaving.
The chart also plots offset±rtt, where rtt is the round trip time to the server. NTP can not really know the offset of a remote chimer, NTP computes it by subtracting rtt/2 from the offset. Plotting the offset±rtt reverses this calculation to more easily see the effects of rtt changes.
Closer to 0s is better. An ideal system would be a horizontal line at 0s. Typical 90% ranges may be: local LAN server 80µs; 90% ranges for WAN server may be 4ms and much larger.
Clock Offset is field 5 in the peerstats log file. The Round Trip Time (rtt) is field 6 in the peerstats log file.
Server Offset 96.19.94.82

| Percentiles...... | Ranges...... | Skew- | Kurt- | |||||||||||||
| Name | Min | 1% | 5% | 50% | 95% | 99% | Max | 90% | 98% | StdDev | Mean | Units | ness | osis | ||
| Server Offset 96.19.94.82 | -0.647 | -0.647 | 1.724 | 5.045 | 7.144 | 7.510 | 7.510 | 5.420 | 8.157 | 1.558 | 4.959 | ms | -0.9895 | 4.45 | ||
The offset of a server in seconds. This is useful to see how the measured offset is behaving.
The chart also plots offset±rtt, where rtt is the round trip time to the server. NTP can not really know the offset of a remote chimer, NTP computes it by subtracting rtt/2 from the offset. Plotting the offset±rtt reverses this calculation to more easily see the effects of rtt changes.
Closer to 0s is better. An ideal system would be a horizontal line at 0s. Typical 90% ranges may be: local LAN server 80µs; 90% ranges for WAN server may be 4ms and much larger.
Clock Offset is field 5 in the peerstats log file. The Round Trip Time (rtt) is field 6 in the peerstats log file.
Server Offset 96.245.170.99
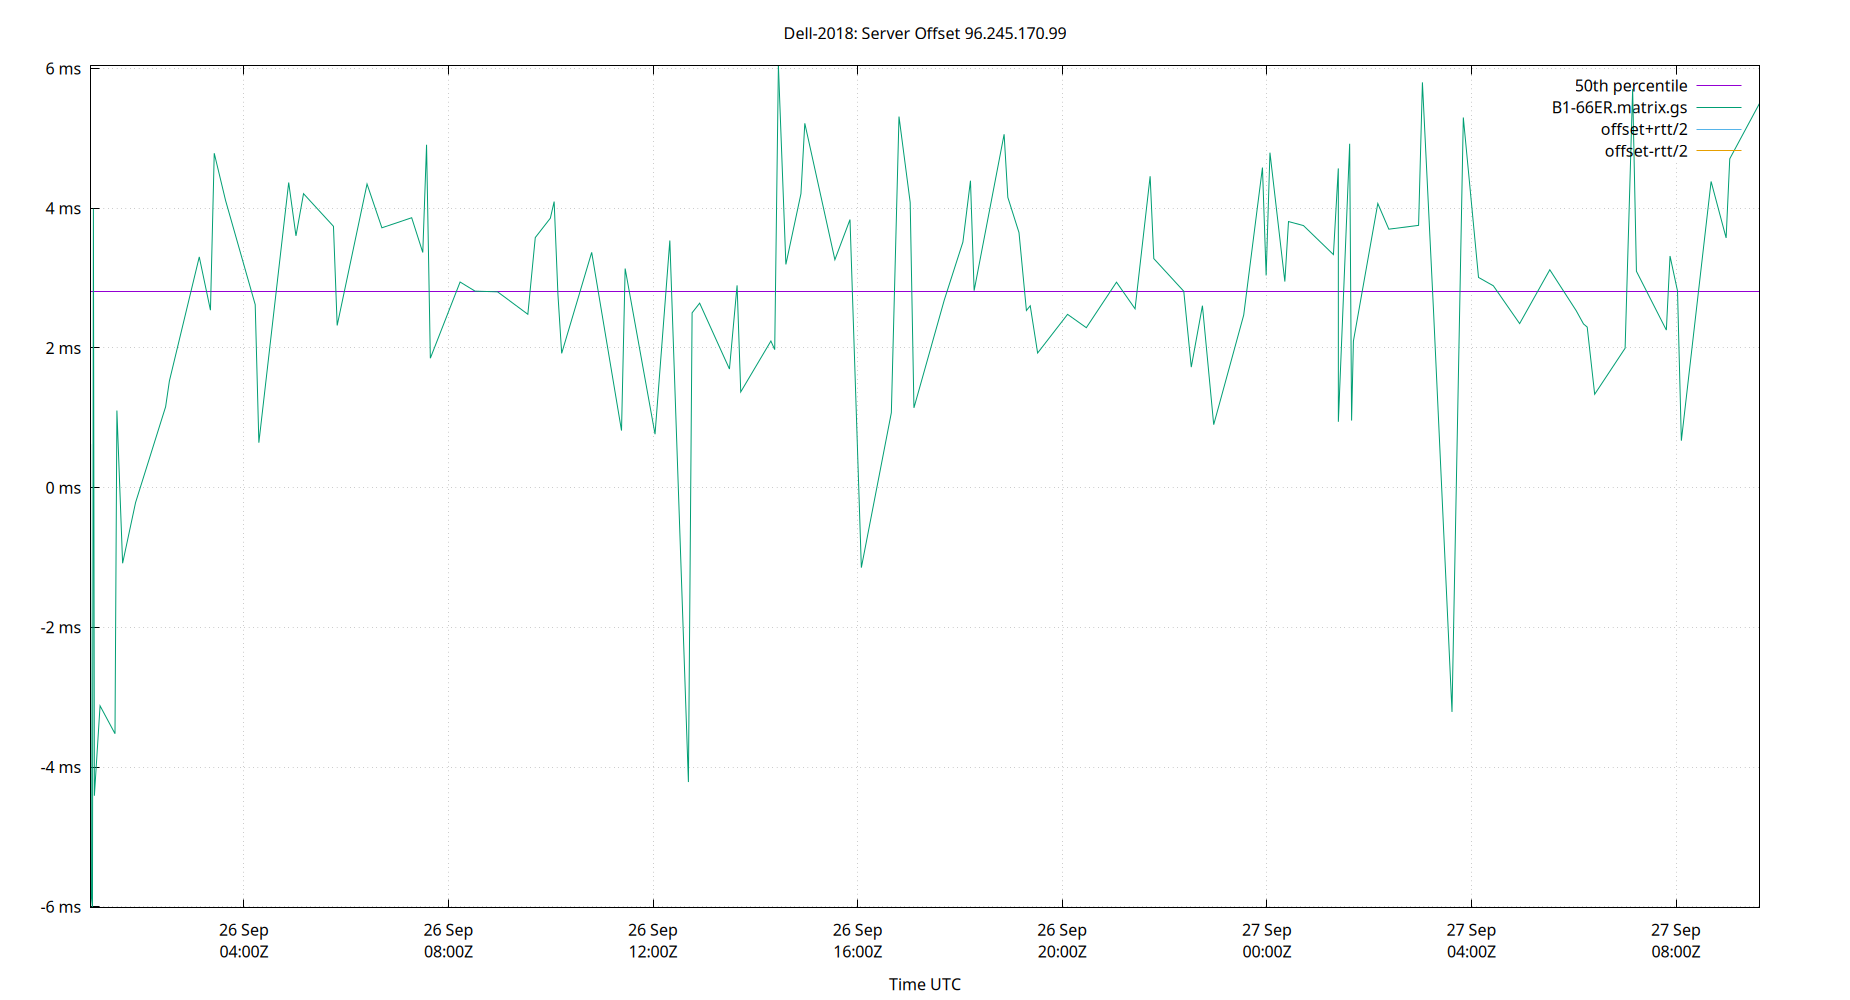
| Percentiles...... | Ranges...... | Skew- | Kurt- | |||||||||||||
| Name | Min | 1% | 5% | 50% | 95% | 99% | Max | 90% | 98% | StdDev | Mean | Units | ness | osis | ||
| Server Offset 96.245.170.99 | -6.017 | -5.876 | -3.123 | 2.815 | 5.216 | 5.802 | 6.038 | 8.339 | 11.679 | 2.351 | 2.390 | ms | -1.525 | 5.442 | ||
The offset of a server in seconds. This is useful to see how the measured offset is behaving.
The chart also plots offset±rtt, where rtt is the round trip time to the server. NTP can not really know the offset of a remote chimer, NTP computes it by subtracting rtt/2 from the offset. Plotting the offset±rtt reverses this calculation to more easily see the effects of rtt changes.
Closer to 0s is better. An ideal system would be a horizontal line at 0s. Typical 90% ranges may be: local LAN server 80µs; 90% ranges for WAN server may be 4ms and much larger.
Clock Offset is field 5 in the peerstats log file. The Round Trip Time (rtt) is field 6 in the peerstats log file.
Server Offset 99.28.14.242

| Percentiles...... | Ranges...... | Skew- | Kurt- | |||||||||||||
| Name | Min | 1% | 5% | 50% | 95% | 99% | Max | 90% | 98% | StdDev | Mean | Units | ness | osis | ||
| Server Offset 99.28.14.242 | -1,995.690 | -8.739 | -3.055 | 3.487 | 6.341 | 9.535 | 51.057 | 9.396 | 18.274 | 119.026 | -4.338 | ms | -16.63 | 277.9 | ||
The offset of a server in seconds. This is useful to see how the measured offset is behaving.
The chart also plots offset±rtt, where rtt is the round trip time to the server. NTP can not really know the offset of a remote chimer, NTP computes it by subtracting rtt/2 from the offset. Plotting the offset±rtt reverses this calculation to more easily see the effects of rtt changes.
Closer to 0s is better. An ideal system would be a horizontal line at 0s. Typical 90% ranges may be: local LAN server 80µs; 90% ranges for WAN server may be 4ms and much larger.
Clock Offset is field 5 in the peerstats log file. The Round Trip Time (rtt) is field 6 in the peerstats log file.
Server Offset SHM(0)

| Percentiles...... | Ranges...... | Skew- | Kurt- | |||||||||||||
| Name | Min | 1% | 5% | 50% | 95% | 99% | Max | 90% | 98% | StdDev | Mean | Units | ness | osis | ||
| Server Offset SHM(0) | -1,142.216 | -545.438 | -184.677 | -151.939 | -128.845 | -120.245 | 1,345.558 | 55.832 | 425.193 | 69.792 | -164.020 | ms | -4.658 | 29.51 | ||
The offset of a server in seconds. This is useful to see how the measured offset is behaving.
The chart also plots offset±rtt, where rtt is the round trip time to the server. NTP can not really know the offset of a remote chimer, NTP computes it by subtracting rtt/2 from the offset. Plotting the offset±rtt reverses this calculation to more easily see the effects of rtt changes.
Closer to 0s is better. An ideal system would be a horizontal line at 0s. Typical 90% ranges may be: local LAN server 80µs; 90% ranges for WAN server may be 4ms and much larger.
Clock Offset is field 5 in the peerstats log file. The Round Trip Time (rtt) is field 6 in the peerstats log file.
Server Offset SHM(1)

| Percentiles...... | Ranges...... | Skew- | Kurt- | |||||||||||||
| Name | Min | 1% | 5% | 50% | 95% | 99% | Max | 90% | 98% | StdDev | Mean | Units | ness | osis | ||
| Server Offset SHM(1) | -1,005.833 | -8.509 | -7.578 | -4.077 | 0.107 | 0.293 | 2,340.449 | 7.685 | 8.802 | 12.229 | -3.283 | ms | 121.5 | 2.128e+04 | ||
The offset of a server in seconds. This is useful to see how the measured offset is behaving.
The chart also plots offset±rtt, where rtt is the round trip time to the server. NTP can not really know the offset of a remote chimer, NTP computes it by subtracting rtt/2 from the offset. Plotting the offset±rtt reverses this calculation to more easily see the effects of rtt changes.
Closer to 0s is better. An ideal system would be a horizontal line at 0s. Typical 90% ranges may be: local LAN server 80µs; 90% ranges for WAN server may be 4ms and much larger.
Clock Offset is field 5 in the peerstats log file. The Round Trip Time (rtt) is field 6 in the peerstats log file.
Server Offset SHM(2)

| Percentiles...... | Ranges...... | Skew- | Kurt- | |||||||||||||
| Name | Min | 1% | 5% | 50% | 95% | 99% | Max | 90% | 98% | StdDev | Mean | Units | ness | osis | ||
| Server Offset SHM(2) | -192.688 | -183.188 | -178.010 | -164.032 | -139.790 | -135.441 | 1,940.513 | 38.220 | 47.747 | 20.967 | -160.296 | ms | 62.3 | 6095 | ||
The offset of a server in seconds. This is useful to see how the measured offset is behaving.
The chart also plots offset±rtt, where rtt is the round trip time to the server. NTP can not really know the offset of a remote chimer, NTP computes it by subtracting rtt/2 from the offset. Plotting the offset±rtt reverses this calculation to more easily see the effects of rtt changes.
Closer to 0s is better. An ideal system would be a horizontal line at 0s. Typical 90% ranges may be: local LAN server 80µs; 90% ranges for WAN server may be 4ms and much larger.
Clock Offset is field 5 in the peerstats log file. The Round Trip Time (rtt) is field 6 in the peerstats log file.
Server Offset SHM(3)

| Percentiles...... | Ranges...... | Skew- | Kurt- | |||||||||||||
| Name | Min | 1% | 5% | 50% | 95% | 99% | Max | 90% | 98% | StdDev | Mean | Units | ness | osis | ||
| Server Offset SHM(3) | -548.313 | -8.681 | -8.227 | -3.996 | 0.173 | 0.333 | 2,061.810 | 8.400 | 9.014 | 12.708 | -3.151 | ms | 143.1 | 2.3e+04 | ||
The offset of a server in seconds. This is useful to see how the measured offset is behaving.
The chart also plots offset±rtt, where rtt is the round trip time to the server. NTP can not really know the offset of a remote chimer, NTP computes it by subtracting rtt/2 from the offset. Plotting the offset±rtt reverses this calculation to more easily see the effects of rtt changes.
Closer to 0s is better. An ideal system would be a horizontal line at 0s. Typical 90% ranges may be: local LAN server 80µs; 90% ranges for WAN server may be 4ms and much larger.
Clock Offset is field 5 in the peerstats log file. The Round Trip Time (rtt) is field 6 in the peerstats log file.
Server Offset SHM(4)

| Percentiles...... | Ranges...... | Skew- | Kurt- | |||||||||||||
| Name | Min | 1% | 5% | 50% | 95% | 99% | Max | 90% | 98% | StdDev | Mean | Units | ness | osis | ||
| Server Offset SHM(4) | -161.294 | -159.152 | -156.877 | -151.439 | -146.907 | -145.585 | -142.438 | 9.970 | 13.567 | 3.040 | -151.647 | ms | -0.2552 | 2.747 | ||
The offset of a server in seconds. This is useful to see how the measured offset is behaving.
The chart also plots offset±rtt, where rtt is the round trip time to the server. NTP can not really know the offset of a remote chimer, NTP computes it by subtracting rtt/2 from the offset. Plotting the offset±rtt reverses this calculation to more easily see the effects of rtt changes.
Closer to 0s is better. An ideal system would be a horizontal line at 0s. Typical 90% ranges may be: local LAN server 80µs; 90% ranges for WAN server may be 4ms and much larger.
Clock Offset is field 5 in the peerstats log file. The Round Trip Time (rtt) is field 6 in the peerstats log file.
Server Offset SHM(5)

| Percentiles...... | Ranges...... | Skew- | Kurt- | |||||||||||||
| Name | Min | 1% | 5% | 50% | 95% | 99% | Max | 90% | 98% | StdDev | Mean | Units | ness | osis | ||
| Server Offset SHM(5) | -6.986 | -2.942 | -0.617 | -0.144 | 0.385 | 0.584 | 0.760 | 1.002 | 3.526 | 0.562 | -0.162 | ms | -5.053 | 42.24 | ||
The offset of a server in seconds. This is useful to see how the measured offset is behaving.
The chart also plots offset±rtt, where rtt is the round trip time to the server. NTP can not really know the offset of a remote chimer, NTP computes it by subtracting rtt/2 from the offset. Plotting the offset±rtt reverses this calculation to more easily see the effects of rtt changes.
Closer to 0s is better. An ideal system would be a horizontal line at 0s. Typical 90% ranges may be: local LAN server 80µs; 90% ranges for WAN server may be 4ms and much larger.
Clock Offset is field 5 in the peerstats log file. The Round Trip Time (rtt) is field 6 in the peerstats log file.
Server Offset SOCK(0)

| Percentiles...... | Ranges...... | Skew- | Kurt- | |||||||||||||
| Name | Min | 1% | 5% | 50% | 95% | 99% | Max | 90% | 98% | StdDev | Mean | Units | ness | osis | ||
| Server Offset SOCK(0) | -193.680 | -178.579 | -176.503 | -171.981 | -167.614 | -165.845 | -162.901 | 8.888 | 12.734 | 2.739 | -171.985 | ms | -0.3001 | 4.286 | ||
The offset of a server in seconds. This is useful to see how the measured offset is behaving.
The chart also plots offset±rtt, where rtt is the round trip time to the server. NTP can not really know the offset of a remote chimer, NTP computes it by subtracting rtt/2 from the offset. Plotting the offset±rtt reverses this calculation to more easily see the effects of rtt changes.
Closer to 0s is better. An ideal system would be a horizontal line at 0s. Typical 90% ranges may be: local LAN server 80µs; 90% ranges for WAN server may be 4ms and much larger.
Clock Offset is field 5 in the peerstats log file. The Round Trip Time (rtt) is field 6 in the peerstats log file.
Server Offset SOCK(1)

| Percentiles...... | Ranges...... | Skew- | Kurt- | |||||||||||||
| Name | Min | 1% | 5% | 50% | 95% | 99% | Max | 90% | 98% | StdDev | Mean | Units | ness | osis | ||
| Server Offset SOCK(1) | -10.997 | -6.657 | -6.280 | -0.160 | 0.286 | 0.390 | 2.165 | 6.566 | 7.047 | 2.192 | -1.067 | ms | -1.72 | 4.177 | ||
The offset of a server in seconds. This is useful to see how the measured offset is behaving.
The chart also plots offset±rtt, where rtt is the round trip time to the server. NTP can not really know the offset of a remote chimer, NTP computes it by subtracting rtt/2 from the offset. Plotting the offset±rtt reverses this calculation to more easily see the effects of rtt changes.
Closer to 0s is better. An ideal system would be a horizontal line at 0s. Typical 90% ranges may be: local LAN server 80µs; 90% ranges for WAN server may be 4ms and much larger.
Clock Offset is field 5 in the peerstats log file. The Round Trip Time (rtt) is field 6 in the peerstats log file.
Server Offset SOCK(2)

| Percentiles...... | Ranges...... | Skew- | Kurt- | |||||||||||||
| Name | Min | 1% | 5% | 50% | 95% | 99% | Max | 90% | 98% | StdDev | Mean | Units | ness | osis | ||
| Server Offset SOCK(2) | -181.172 | -176.994 | -173.059 | -163.444 | -157.121 | -154.860 | -148.505 | 15.938 | 22.134 | 4.800 | -164.015 | ms | -0.5576 | 3.253 | ||
The offset of a server in seconds. This is useful to see how the measured offset is behaving.
The chart also plots offset±rtt, where rtt is the round trip time to the server. NTP can not really know the offset of a remote chimer, NTP computes it by subtracting rtt/2 from the offset. Plotting the offset±rtt reverses this calculation to more easily see the effects of rtt changes.
Closer to 0s is better. An ideal system would be a horizontal line at 0s. Typical 90% ranges may be: local LAN server 80µs; 90% ranges for WAN server may be 4ms and much larger.
Clock Offset is field 5 in the peerstats log file. The Round Trip Time (rtt) is field 6 in the peerstats log file.
Server Offset SOCK(3)

| Percentiles...... | Ranges...... | Skew- | Kurt- | |||||||||||||
| Name | Min | 1% | 5% | 50% | 95% | 99% | Max | 90% | 98% | StdDev | Mean | Units | ness | osis | ||
| Server Offset SOCK(3) | -7.497 | -0.575 | -0.489 | -0.111 | 0.230 | 0.340 | 2.136 | 0.720 | 0.915 | 0.253 | -0.115 | ms | -0.8259 | 28.12 | ||
The offset of a server in seconds. This is useful to see how the measured offset is behaving.
The chart also plots offset±rtt, where rtt is the round trip time to the server. NTP can not really know the offset of a remote chimer, NTP computes it by subtracting rtt/2 from the offset. Plotting the offset±rtt reverses this calculation to more easily see the effects of rtt changes.
Closer to 0s is better. An ideal system would be a horizontal line at 0s. Typical 90% ranges may be: local LAN server 80µs; 90% ranges for WAN server may be 4ms and much larger.
Clock Offset is field 5 in the peerstats log file. The Round Trip Time (rtt) is field 6 in the peerstats log file.
Server Jitters

The RMS Jitter of all refclocks and servers. Jitter is the current estimated dispersion, in other words the variation in offset between samples.
Closer to 0s is better. An ideal system would be a horizontal line at 0s.
RMS Jitter is field 8 in the peerstats log file.
Server Jitter 104.131.155.175

| Percentiles...... | Ranges...... | Skew- | Kurt- | |||||||||||||
| Name | Min | 1% | 5% | 50% | 95% | 99% | Max | 90% | 98% | StdDev | Mean | Units | ness | osis | ||
| Server Jitter 104.131.155.175 | 0.000 | 0.000 | 0.834 | 4.593 | 17.108 | 88.041 | 111.550 | 16.275 | 88.041 | 12.164 | 6.897 | ms | 6.433 | 48.73 | ||
The RMS Jitter of a server. Jitter is the current estimated dispersion, in other words the variation in offset between samples.
Closer to 0s is better. An ideal system would be a horizontal line at 0s.
RMS Jitter is field 8 in the peerstats log file.
Server Jitter 104.152.220.5

| Percentiles...... | Ranges...... | Skew- | Kurt- | |||||||||||||
| Name | Min | 1% | 5% | 50% | 95% | 99% | Max | 90% | 98% | StdDev | Mean | Units | ness | osis | ||
| Server Jitter 104.152.220.5 | 0.000 | 0.000 | 0.000 | 0.888 | 2.438 | 2.438 | 2.438 | 2.438 | 2.438 | 0.710 | 1.068 | ms | 0.5336 | 2.756 | ||
The RMS Jitter of a server. Jitter is the current estimated dispersion, in other words the variation in offset between samples.
Closer to 0s is better. An ideal system would be a horizontal line at 0s.
RMS Jitter is field 8 in the peerstats log file.
Server Jitter 104.232.0.123
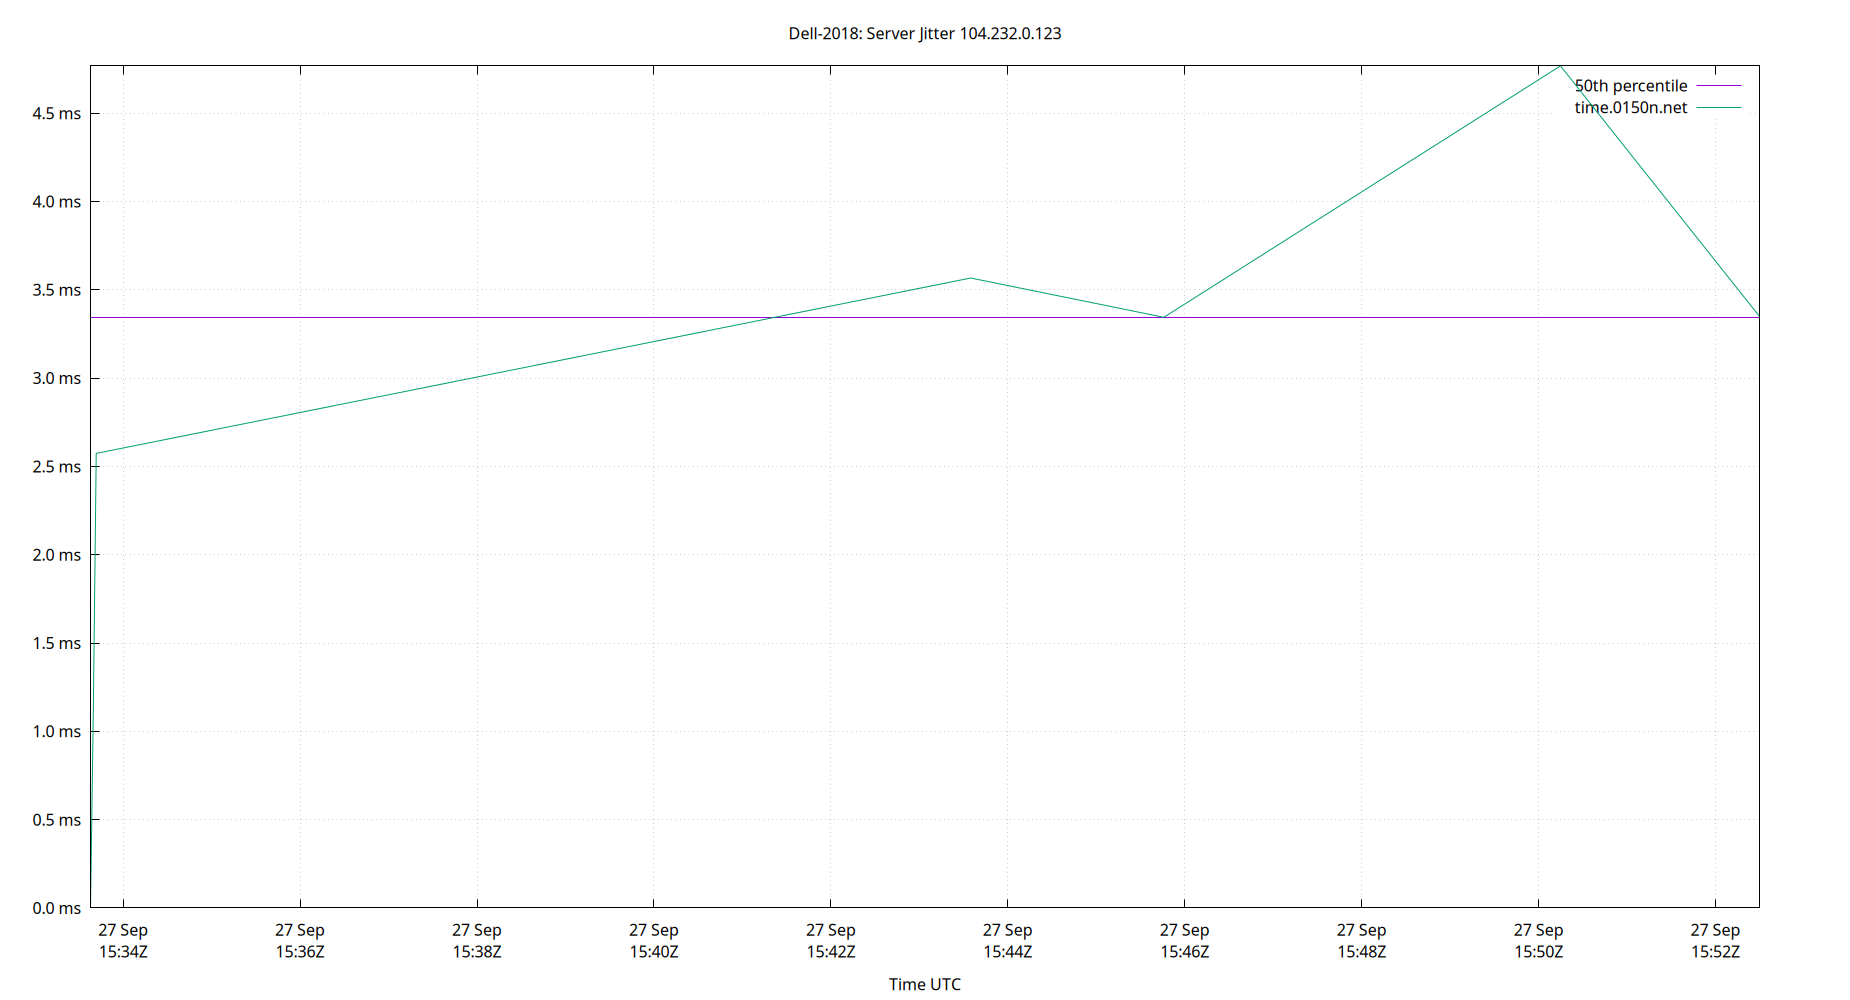
| Percentiles...... | Ranges...... | Skew- | Kurt- | |||||||||||||
| Name | Min | 1% | 5% | 50% | 95% | 99% | Max | 90% | 98% | StdDev | Mean | Units | ness | osis | ||
| Server Jitter 104.232.0.123 | 0.000 | 0.000 | 0.000 | 3.344 | 4.768 | 4.768 | 4.768 | 4.768 | 4.768 | 1.498 | 2.672 | ms | -0.5272 | 2.194 | ||
The RMS Jitter of a server. Jitter is the current estimated dispersion, in other words the variation in offset between samples.
Closer to 0s is better. An ideal system would be a horizontal line at 0s.
RMS Jitter is field 8 in the peerstats log file.
Server Jitter 104.234.61.117

| Percentiles...... | Ranges...... | Skew- | Kurt- | |||||||||||||
| Name | Min | 1% | 5% | 50% | 95% | 99% | Max | 90% | 98% | StdDev | Mean | Units | ness | osis | ||
| Server Jitter 104.234.61.117 | 0.000 | 0.735 | 1.495 | 3.548 | 13.550 | 26.903 | 29.916 | 12.055 | 26.168 | 4.494 | 4.883 | ms | 3.04 | 14.17 | ||
The RMS Jitter of a server. Jitter is the current estimated dispersion, in other words the variation in offset between samples.
Closer to 0s is better. An ideal system would be a horizontal line at 0s.
RMS Jitter is field 8 in the peerstats log file.
Server Jitter 107.172.222.7

| Percentiles...... | Ranges...... | Skew- | Kurt- | |||||||||||||
| Name | Min | 1% | 5% | 50% | 95% | 99% | Max | 90% | 98% | StdDev | Mean | Units | ness | osis | ||
| Server Jitter 107.172.222.7 | 0.000 | 0.000 | 1.084 | 4.379 | 25.305 | 36.743 | 37.327 | 24.221 | 36.743 | 8.622 | 8.136 | ms | 1.606 | 4.837 | ||
The RMS Jitter of a server. Jitter is the current estimated dispersion, in other words the variation in offset between samples.
Closer to 0s is better. An ideal system would be a horizontal line at 0s.
RMS Jitter is field 8 in the peerstats log file.
Server Jitter 108.61.215.221

| Percentiles...... | Ranges...... | Skew- | Kurt- | |||||||||||||
| Name | Min | 1% | 5% | 50% | 95% | 99% | Max | 90% | 98% | StdDev | Mean | Units | ness | osis | ||
| Server Jitter 108.61.215.221 | 0.000 | 0.714 | 1.150 | 4.505 | 26.091 | 34.413 | 41.318 | 24.940 | 33.698 | 8.433 | 8.402 | ms | 1.357 | 4.032 | ||
The RMS Jitter of a server. Jitter is the current estimated dispersion, in other words the variation in offset between samples.
Closer to 0s is better. An ideal system would be a horizontal line at 0s.
RMS Jitter is field 8 in the peerstats log file.
Server Jitter 12.205.28.193

| Percentiles...... | Ranges...... | Skew- | Kurt- | |||||||||||||
| Name | Min | 1% | 5% | 50% | 95% | 99% | Max | 90% | 98% | StdDev | Mean | Units | ness | osis | ||
| Server Jitter 12.205.28.193 | 0.000 | 0.000 | 0.000 | 11.183 | 108.575 | 108.575 | 108.575 | 108.575 | 108.575 | 37.651 | 31.806 | ms | 0.9856 | 2.424 | ||
The RMS Jitter of a server. Jitter is the current estimated dispersion, in other words the variation in offset between samples.
Closer to 0s is better. An ideal system would be a horizontal line at 0s.
RMS Jitter is field 8 in the peerstats log file.
Server Jitter 129.146.193.200

| Percentiles...... | Ranges...... | Skew- | Kurt- | |||||||||||||
| Name | Min | 1% | 5% | 50% | 95% | 99% | Max | 90% | 98% | StdDev | Mean | Units | ness | osis | ||
| Server Jitter 129.146.193.200 | 0.000 | 0.000 | 0.809 | 2.667 | 17.247 | 17.857 | 18.051 | 16.439 | 17.857 | 3.953 | 3.880 | ms | 2.33 | 8.207 | ||
The RMS Jitter of a server. Jitter is the current estimated dispersion, in other words the variation in offset between samples.
Closer to 0s is better. An ideal system would be a horizontal line at 0s.
RMS Jitter is field 8 in the peerstats log file.
Server Jitter 129.250.35.250

| Percentiles...... | Ranges...... | Skew- | Kurt- | |||||||||||||
| Name | Min | 1% | 5% | 50% | 95% | 99% | Max | 90% | 98% | StdDev | Mean | Units | ness | osis | ||
| Server Jitter 129.250.35.250 | 0.000 | 0.000 | 1.317 | 4.421 | 13.783 | 159.937 | 160.090 | 12.466 | 159.937 | 16.049 | 6.795 | ms | 9.004 | 85.92 | ||
The RMS Jitter of a server. Jitter is the current estimated dispersion, in other words the variation in offset between samples.
Closer to 0s is better. An ideal system would be a horizontal line at 0s.
RMS Jitter is field 8 in the peerstats log file.
Server Jitter 131.239.5.43

| Percentiles...... | Ranges...... | Skew- | Kurt- | |||||||||||||
| Name | Min | 1% | 5% | 50% | 95% | 99% | Max | 90% | 98% | StdDev | Mean | Units | ness | osis | ||
| Server Jitter 131.239.5.43 | 0.000 | 0.000 | 0.000 | 1.655 | 3.135 | 3.135 | 3.135 | 3.135 | 3.135 | 0.882 | 1.743 | ms | -0.2966 | 2.893 | ||
The RMS Jitter of a server. Jitter is the current estimated dispersion, in other words the variation in offset between samples.
Closer to 0s is better. An ideal system would be a horizontal line at 0s.
RMS Jitter is field 8 in the peerstats log file.
Server Jitter 134.215.155.177

| Percentiles...... | Ranges...... | Skew- | Kurt- | |||||||||||||
| Name | Min | 1% | 5% | 50% | 95% | 99% | Max | 90% | 98% | StdDev | Mean | Units | ness | osis | ||
| Server Jitter 134.215.155.177 | 0.000 | 0.215 | 1.574 | 3.642 | 10.470 | 21.230 | 22.367 | 8.897 | 21.015 | 3.543 | 4.682 | ms | 2.633 | 11.95 | ||
The RMS Jitter of a server. Jitter is the current estimated dispersion, in other words the variation in offset between samples.
Closer to 0s is better. An ideal system would be a horizontal line at 0s.
RMS Jitter is field 8 in the peerstats log file.
Server Jitter 136.244.88.170

| Percentiles...... | Ranges...... | Skew- | Kurt- | |||||||||||||
| Name | Min | 1% | 5% | 50% | 95% | 99% | Max | 90% | 98% | StdDev | Mean | Units | ness | osis | ||
| Server Jitter 136.244.88.170 | 0.000 | 0.000 | 1.438 | 52.845 | 95.857 | 101.959 | 115.431 | 94.419 | 101.959 | 26.303 | 50.947 | ms | -0.2059 | 2.744 | ||
The RMS Jitter of a server. Jitter is the current estimated dispersion, in other words the variation in offset between samples.
Closer to 0s is better. An ideal system would be a horizontal line at 0s.
RMS Jitter is field 8 in the peerstats log file.
Server Jitter 137.190.2.4

| Percentiles...... | Ranges...... | Skew- | Kurt- | |||||||||||||
| Name | Min | 1% | 5% | 50% | 95% | 99% | Max | 90% | 98% | StdDev | Mean | Units | ness | osis | ||
| Server Jitter 137.190.2.4 | 0.000 | 0.000 | 0.000 | 8.346 | 83.883 | 83.883 | 83.883 | 83.883 | 83.883 | 25.677 | 16.869 | ms | 1.958 | 5.07 | ||
The RMS Jitter of a server. Jitter is the current estimated dispersion, in other words the variation in offset between samples.
Closer to 0s is better. An ideal system would be a horizontal line at 0s.
RMS Jitter is field 8 in the peerstats log file.
Server Jitter 139.177.202.26

| Percentiles...... | Ranges...... | Skew- | Kurt- | |||||||||||||
| Name | Min | 1% | 5% | 50% | 95% | 99% | Max | 90% | 98% | StdDev | Mean | Units | ness | osis | ||
| Server Jitter 139.177.202.26 | 0.000 | 0.000 | 0.000 | 1.830 | 3.716 | 3.716 | 3.716 | 3.716 | 3.716 | 1.177 | 1.625 | ms | 0.3916 | 2.367 | ||
The RMS Jitter of a server. Jitter is the current estimated dispersion, in other words the variation in offset between samples.
Closer to 0s is better. An ideal system would be a horizontal line at 0s.
RMS Jitter is field 8 in the peerstats log file.
Server Jitter 139.84.137.244

| Percentiles...... | Ranges...... | Skew- | Kurt- | |||||||||||||
| Name | Min | 1% | 5% | 50% | 95% | 99% | Max | 90% | 98% | StdDev | Mean | Units | ness | osis | ||
| Server Jitter 139.84.137.244 | 0.000 | 1.131 | 3.660 | 23.593 | 63.864 | 79.789 | 171.675 | 60.204 | 78.658 | 18.877 | 27.084 | ms | 1.288 | 6.797 | ||
The RMS Jitter of a server. Jitter is the current estimated dispersion, in other words the variation in offset between samples.
Closer to 0s is better. An ideal system would be a horizontal line at 0s.
RMS Jitter is field 8 in the peerstats log file.
Server Jitter 139.94.144.123

| Percentiles...... | Ranges...... | Skew- | Kurt- | |||||||||||||
| Name | Min | 1% | 5% | 50% | 95% | 99% | Max | 90% | 98% | StdDev | Mean | Units | ness | osis | ||
| Server Jitter 139.94.144.123 | 0.000 | 0.000 | 0.000 | 1.501 | 2.945 | 2.945 | 2.945 | 2.945 | 2.945 | 1.260 | 1.529 | ms | 0.002279 | 1.271 | ||
The RMS Jitter of a server. Jitter is the current estimated dispersion, in other words the variation in offset between samples.
Closer to 0s is better. An ideal system would be a horizontal line at 0s.
RMS Jitter is field 8 in the peerstats log file.
Server Jitter 141.11.89.193

| Percentiles...... | Ranges...... | Skew- | Kurt- | |||||||||||||
| Name | Min | 1% | 5% | 50% | 95% | 99% | Max | 90% | 98% | StdDev | Mean | Units | ness | osis | ||
| Server Jitter 141.11.89.193 | 0.000 | 0.753 | 1.179 | 4.911 | 26.490 | 37.783 | 47.502 | 25.312 | 37.030 | 8.477 | 8.215 | ms | 1.982 | 7.242 | ||
The RMS Jitter of a server. Jitter is the current estimated dispersion, in other words the variation in offset between samples.
Closer to 0s is better. An ideal system would be a horizontal line at 0s.
RMS Jitter is field 8 in the peerstats log file.
Server Jitter 142.202.190.19

| Percentiles...... | Ranges...... | Skew- | Kurt- | |||||||||||||
| Name | Min | 1% | 5% | 50% | 95% | 99% | Max | 90% | 98% | StdDev | Mean | Units | ness | osis | ||
| Server Jitter 142.202.190.19 | 0.000 | 0.000 | 0.000 | 2.202 | 33.553 | 33.553 | 33.553 | 33.553 | 33.553 | 7.428 | 4.893 | ms | 2.967 | 11.73 | ||
The RMS Jitter of a server. Jitter is the current estimated dispersion, in other words the variation in offset between samples.
Closer to 0s is better. An ideal system would be a horizontal line at 0s.
RMS Jitter is field 8 in the peerstats log file.
Server Jitter 142.248.80.92
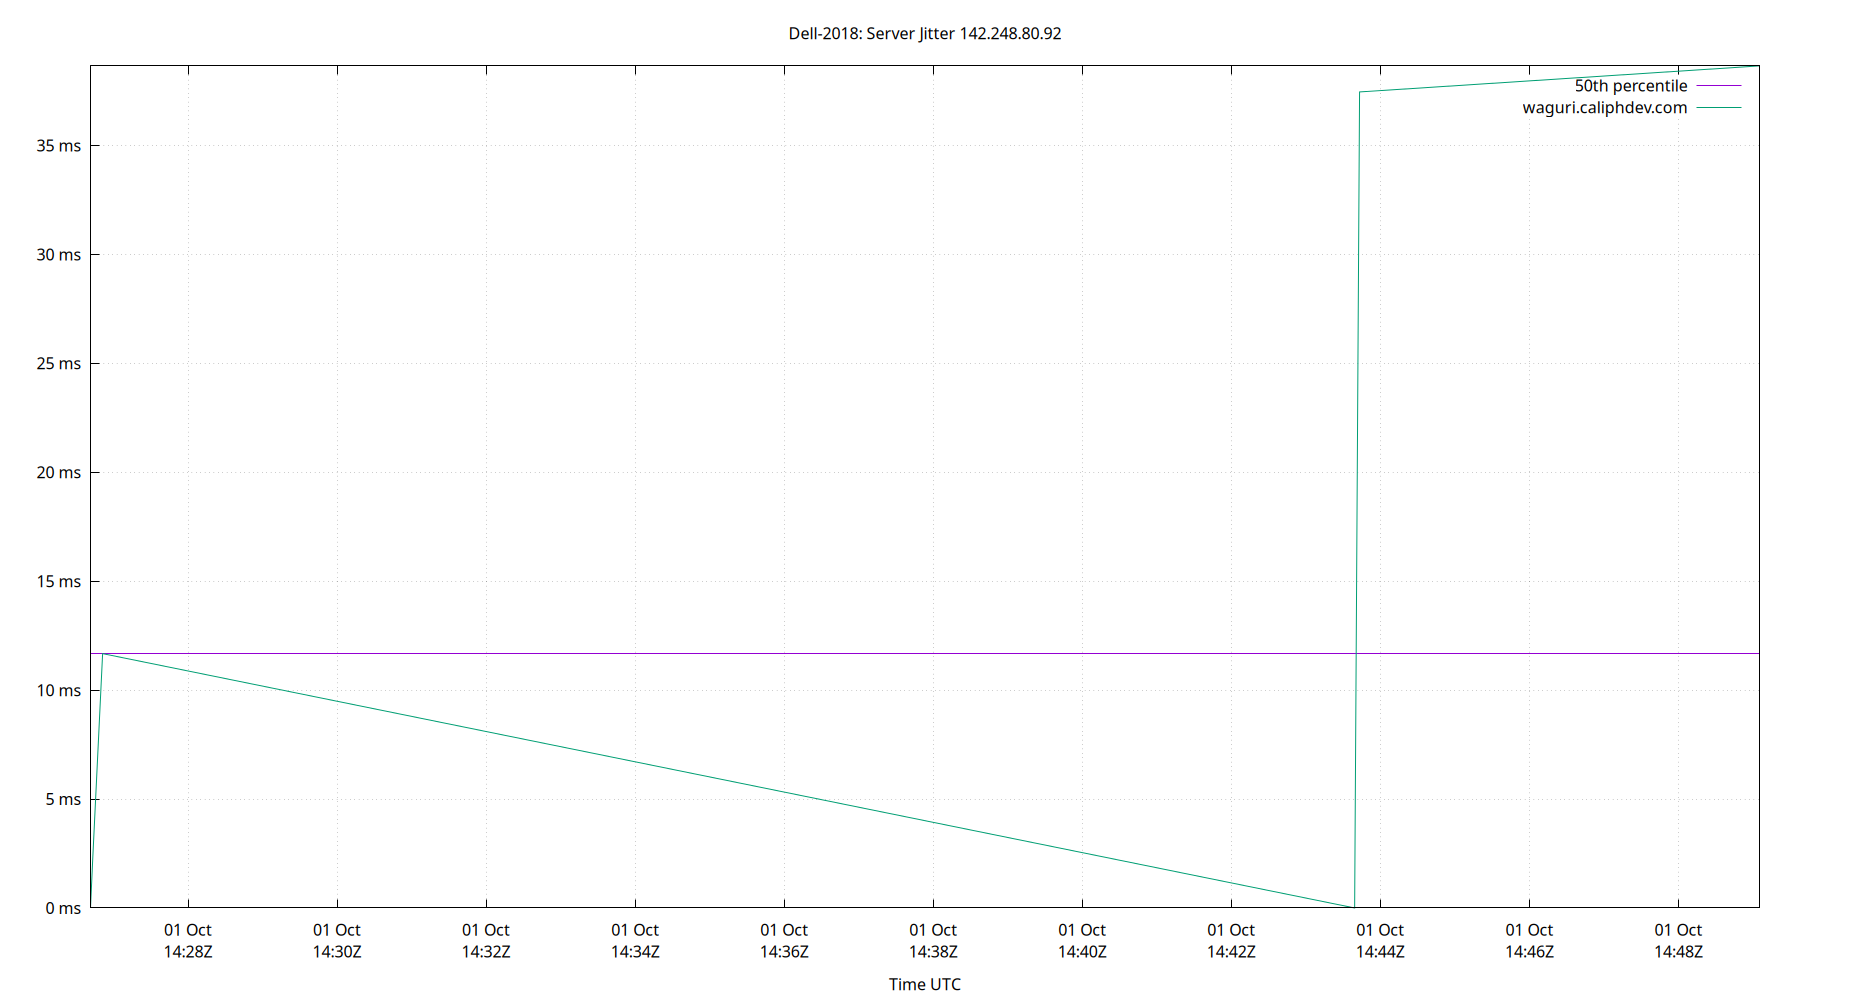
| Percentiles...... | Ranges...... | Skew- | Kurt- | |||||||||||||
| Name | Min | 1% | 5% | 50% | 95% | 99% | Max | 90% | 98% | StdDev | Mean | Units | ness | osis | ||
| Server Jitter 142.248.80.92 | 0.000 | 0.000 | 0.000 | 11.676 | 38.656 | 38.656 | 38.656 | 38.656 | 38.656 | 16.777 | 15.000 | ms | 0.5537 | 1.464 | ||
The RMS Jitter of a server. Jitter is the current estimated dispersion, in other words the variation in offset between samples.
Closer to 0s is better. An ideal system would be a horizontal line at 0s.
RMS Jitter is field 8 in the peerstats log file.
Server Jitter 143.42.229.154

| Percentiles...... | Ranges...... | Skew- | Kurt- | |||||||||||||
| Name | Min | 1% | 5% | 50% | 95% | 99% | Max | 90% | 98% | StdDev | Mean | Units | ness | osis | ||
| Server Jitter 143.42.229.154 | 0.000 | 0.729 | 1.313 | 5.036 | 31.083 | 50.106 | 52.766 | 29.770 | 49.377 | 9.739 | 8.999 | ms | 2.179 | 8.427 | ||
The RMS Jitter of a server. Jitter is the current estimated dispersion, in other words the variation in offset between samples.
Closer to 0s is better. An ideal system would be a horizontal line at 0s.
RMS Jitter is field 8 in the peerstats log file.
Server Jitter 144.202.0.197

| Percentiles...... | Ranges...... | Skew- | Kurt- | |||||||||||||
| Name | Min | 1% | 5% | 50% | 95% | 99% | Max | 90% | 98% | StdDev | Mean | Units | ness | osis | ||
| Server Jitter 144.202.0.197 | 0.000 | 0.000 | 1.476 | 12.023 | 42.042 | 230.623 | 231.516 | 40.566 | 230.623 | 29.493 | 18.297 | ms | 5.532 | 38.73 | ||
The RMS Jitter of a server. Jitter is the current estimated dispersion, in other words the variation in offset between samples.
Closer to 0s is better. An ideal system would be a horizontal line at 0s.
RMS Jitter is field 8 in the peerstats log file.
Server Jitter 144.202.41.38

| Percentiles...... | Ranges...... | Skew- | Kurt- | |||||||||||||
| Name | Min | 1% | 5% | 50% | 95% | 99% | Max | 90% | 98% | StdDev | Mean | Units | ness | osis | ||
| Server Jitter 144.202.41.38 | 0.000 | 0.000 | 0.000 | 5.577 | 14.889 | 14.889 | 14.889 | 14.889 | 14.889 | 4.476 | 5.400 | ms | 0.4994 | 2.437 | ||
The RMS Jitter of a server. Jitter is the current estimated dispersion, in other words the variation in offset between samples.
Closer to 0s is better. An ideal system would be a horizontal line at 0s.
RMS Jitter is field 8 in the peerstats log file.
Server Jitter 144.202.62.209

| Percentiles...... | Ranges...... | Skew- | Kurt- | |||||||||||||
| Name | Min | 1% | 5% | 50% | 95% | 99% | Max | 90% | 98% | StdDev | Mean | Units | ness | osis | ||
| Server Jitter 144.202.62.209 | 0.000 | 0.000 | 1.137 | 3.703 | 18.598 | 217.349 | 311.298 | 17.462 | 217.349 | 30.716 | 9.133 | ms | 7.378 | 59.79 | ||
The RMS Jitter of a server. Jitter is the current estimated dispersion, in other words the variation in offset between samples.
Closer to 0s is better. An ideal system would be a horizontal line at 0s.
RMS Jitter is field 8 in the peerstats log file.
Server Jitter 144.202.66.214

| Percentiles...... | Ranges...... | Skew- | Kurt- | |||||||||||||
| Name | Min | 1% | 5% | 50% | 95% | 99% | Max | 90% | 98% | StdDev | Mean | Units | ness | osis | ||
| Server Jitter 144.202.66.214 | 0.000 | 0.718 | 1.239 | 3.846 | 17.964 | 43.753 | 123.164 | 16.725 | 43.034 | 9.165 | 6.161 | ms | 6.53 | 62.37 | ||
The RMS Jitter of a server. Jitter is the current estimated dispersion, in other words the variation in offset between samples.
Closer to 0s is better. An ideal system would be a horizontal line at 0s.
RMS Jitter is field 8 in the peerstats log file.
Server Jitter 144.31.251.154

| Percentiles...... | Ranges...... | Skew- | Kurt- | |||||||||||||
| Name | Min | 1% | 5% | 50% | 95% | 99% | Max | 90% | 98% | StdDev | Mean | Units | ness | osis | ||
| Server Jitter 144.31.251.154 | 0.000 | 0.000 | 0.000 | 19.833 | 74.107 | 74.107 | 74.107 | 74.107 | 74.107 | 32.568 | 34.054 | ms | 0.1749 | 1.143 | ||
The RMS Jitter of a server. Jitter is the current estimated dispersion, in other words the variation in offset between samples.
Closer to 0s is better. An ideal system would be a horizontal line at 0s.
RMS Jitter is field 8 in the peerstats log file.
Server Jitter 144.76.66.157
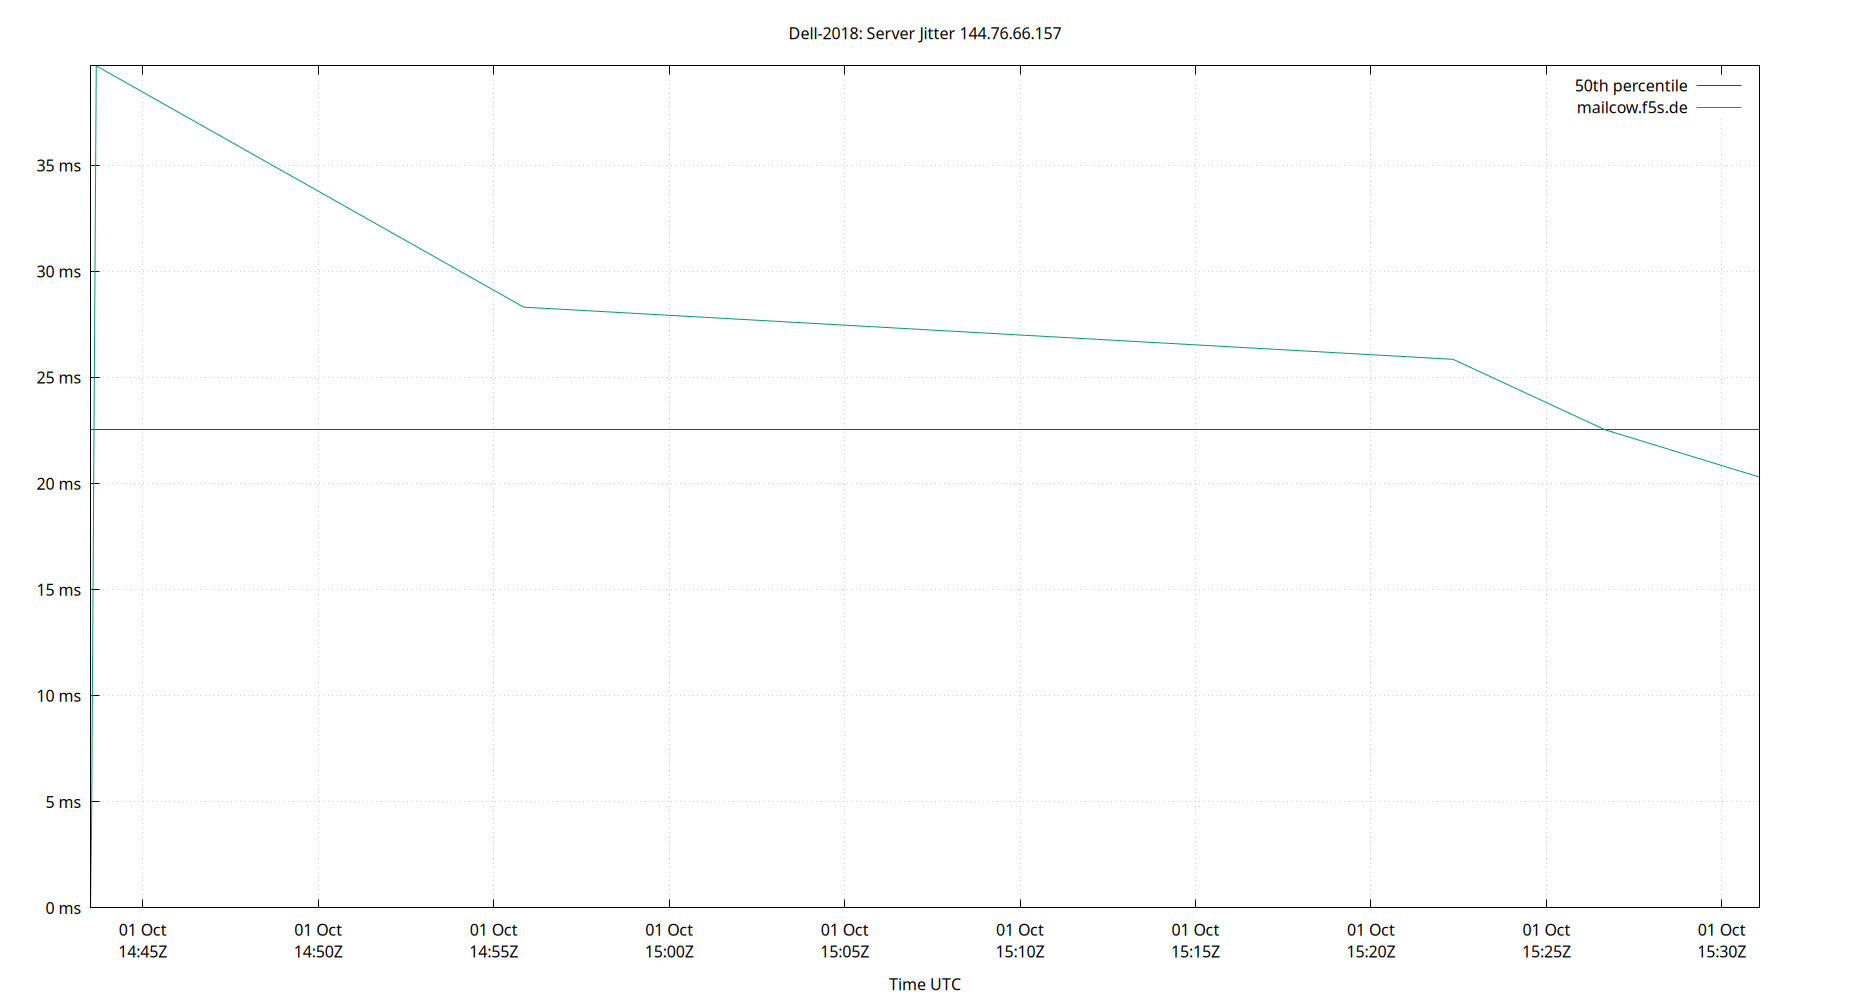
| Percentiles...... | Ranges...... | Skew- | Kurt- | |||||||||||||
| Name | Min | 1% | 5% | 50% | 95% | 99% | Max | 90% | 98% | StdDev | Mean | Units | ness | osis | ||
| Server Jitter 144.76.66.157 | 0.000 | 0.000 | 0.000 | 22.537 | 39.690 | 39.690 | 39.690 | 39.690 | 39.690 | 12.862 | 20.083 | ms | -0.2726 | 2.012 | ||
The RMS Jitter of a server. Jitter is the current estimated dispersion, in other words the variation in offset between samples.
Closer to 0s is better. An ideal system would be a horizontal line at 0s.
RMS Jitter is field 8 in the peerstats log file.
Server Jitter 147.88.195.53

| Percentiles...... | Ranges...... | Skew- | Kurt- | |||||||||||||
| Name | Min | 1% | 5% | 50% | 95% | 99% | Max | 90% | 98% | StdDev | Mean | Units | ness | osis | ||
| Server Jitter 147.88.195.53 | 0.000 | 0.000 | 0.000 | 43.100 | 85.739 | 95.602 | 103.980 | 85.739 | 95.602 | 23.225 | 42.442 | ms | 0.007513 | 2.759 | ||
The RMS Jitter of a server. Jitter is the current estimated dispersion, in other words the variation in offset between samples.
Closer to 0s is better. An ideal system would be a horizontal line at 0s.
RMS Jitter is field 8 in the peerstats log file.
Server Jitter 148.163.226.148

| Percentiles...... | Ranges...... | Skew- | Kurt- | |||||||||||||
| Name | Min | 1% | 5% | 50% | 95% | 99% | Max | 90% | 98% | StdDev | Mean | Units | ness | osis | ||
| Server Jitter 148.163.226.148 | 0.000 | 0.000 | 0.000 | 0.817 | 80.131 | 80.131 | 80.131 | 80.131 | 80.131 | 25.414 | 13.052 | ms | 1.993 | 5.456 | ||
The RMS Jitter of a server. Jitter is the current estimated dispersion, in other words the variation in offset between samples.
Closer to 0s is better. An ideal system would be a horizontal line at 0s.
RMS Jitter is field 8 in the peerstats log file.
Server Jitter 149.248.12.167

| Percentiles...... | Ranges...... | Skew- | Kurt- | |||||||||||||
| Name | Min | 1% | 5% | 50% | 95% | 99% | Max | 90% | 98% | StdDev | Mean | Units | ness | osis | ||
| Server Jitter 149.248.12.167 | 0.000 | 0.000 | 0.000 | 5.393 | 14.159 | 15.551 | 15.551 | 14.159 | 15.551 | 4.042 | 5.981 | ms | 0.6682 | 2.543 | ||
The RMS Jitter of a server. Jitter is the current estimated dispersion, in other words the variation in offset between samples.
Closer to 0s is better. An ideal system would be a horizontal line at 0s.
RMS Jitter is field 8 in the peerstats log file.
Server Jitter 149.28.200.179

| Percentiles...... | Ranges...... | Skew- | Kurt- | |||||||||||||
| Name | Min | 1% | 5% | 50% | 95% | 99% | Max | 90% | 98% | StdDev | Mean | Units | ness | osis | ||
| Server Jitter 149.28.200.179 | 0.000 | 0.000 | 1.112 | 3.393 | 13.171 | 65.088 | 74.406 | 12.058 | 65.088 | 8.936 | 5.598 | ms | 5.35 | 35.8 | ||
The RMS Jitter of a server. Jitter is the current estimated dispersion, in other words the variation in offset between samples.
Closer to 0s is better. An ideal system would be a horizontal line at 0s.
RMS Jitter is field 8 in the peerstats log file.
Server Jitter 149.28.61.105

| Percentiles...... | Ranges...... | Skew- | Kurt- | |||||||||||||
| Name | Min | 1% | 5% | 50% | 95% | 99% | Max | 90% | 98% | StdDev | Mean | Units | ness | osis | ||
| Server Jitter 149.28.61.105 | 0.000 | 0.574 | 1.180 | 5.015 | 36.641 | 56.964 | 197.074 | 35.461 | 56.390 | 13.075 | 10.134 | ms | 4.144 | 37.12 | ||
The RMS Jitter of a server. Jitter is the current estimated dispersion, in other words the variation in offset between samples.
Closer to 0s is better. An ideal system would be a horizontal line at 0s.
RMS Jitter is field 8 in the peerstats log file.
Server Jitter 151.236.20.166

| Percentiles...... | Ranges...... | Skew- | Kurt- | |||||||||||||
| Name | Min | 1% | 5% | 50% | 95% | 99% | Max | 90% | 98% | StdDev | Mean | Units | ness | osis | ||
| Server Jitter 151.236.20.166 | 0.000 | 1.259 | 1.527 | 3.486 | 15.315 | 62.462 | 73.702 | 13.788 | 61.203 | 9.812 | 5.895 | ms | 4.933 | 28.97 | ||
The RMS Jitter of a server. Jitter is the current estimated dispersion, in other words the variation in offset between samples.
Closer to 0s is better. An ideal system would be a horizontal line at 0s.
RMS Jitter is field 8 in the peerstats log file.
Server Jitter 155.248.196.28

| Percentiles...... | Ranges...... | Skew- | Kurt- | |||||||||||||
| Name | Min | 1% | 5% | 50% | 95% | 99% | Max | 90% | 98% | StdDev | Mean | Units | ness | osis | ||
| Server Jitter 155.248.196.28 | 0.000 | 0.355 | 0.902 | 3.193 | 9.792 | 16.282 | 21.738 | 8.891 | 15.927 | 3.015 | 3.977 | ms | 2.004 | 8.991 | ||
The RMS Jitter of a server. Jitter is the current estimated dispersion, in other words the variation in offset between samples.
Closer to 0s is better. An ideal system would be a horizontal line at 0s.
RMS Jitter is field 8 in the peerstats log file.
Server Jitter 157.245.125.229

| Percentiles...... | Ranges...... | Skew- | Kurt- | |||||||||||||
| Name | Min | 1% | 5% | 50% | 95% | 99% | Max | 90% | 98% | StdDev | Mean | Units | ness | osis | ||
| Server Jitter 157.245.125.229 | 0.000 | 0.743 | 1.227 | 6.519 | 33.986 | 58.212 | 77.920 | 32.759 | 57.469 | 11.400 | 10.738 | ms | 2.201 | 9.15 | ||
The RMS Jitter of a server. Jitter is the current estimated dispersion, in other words the variation in offset between samples.
Closer to 0s is better. An ideal system would be a horizontal line at 0s.
RMS Jitter is field 8 in the peerstats log file.
Server Jitter 158.51.99.19

| Percentiles...... | Ranges...... | Skew- | Kurt- | |||||||||||||
| Name | Min | 1% | 5% | 50% | 95% | 99% | Max | 90% | 98% | StdDev | Mean | Units | ness | osis | ||
| Server Jitter 158.51.99.19 | 0.000 | 0.000 | 1.215 | 3.556 | 16.983 | 23.734 | 52.793 | 15.768 | 23.734 | 5.603 | 5.117 | ms | 3.979 | 25.61 | ||
The RMS Jitter of a server. Jitter is the current estimated dispersion, in other words the variation in offset between samples.
Closer to 0s is better. An ideal system would be a horizontal line at 0s.
RMS Jitter is field 8 in the peerstats log file.
Server Jitter 159.203.158.197
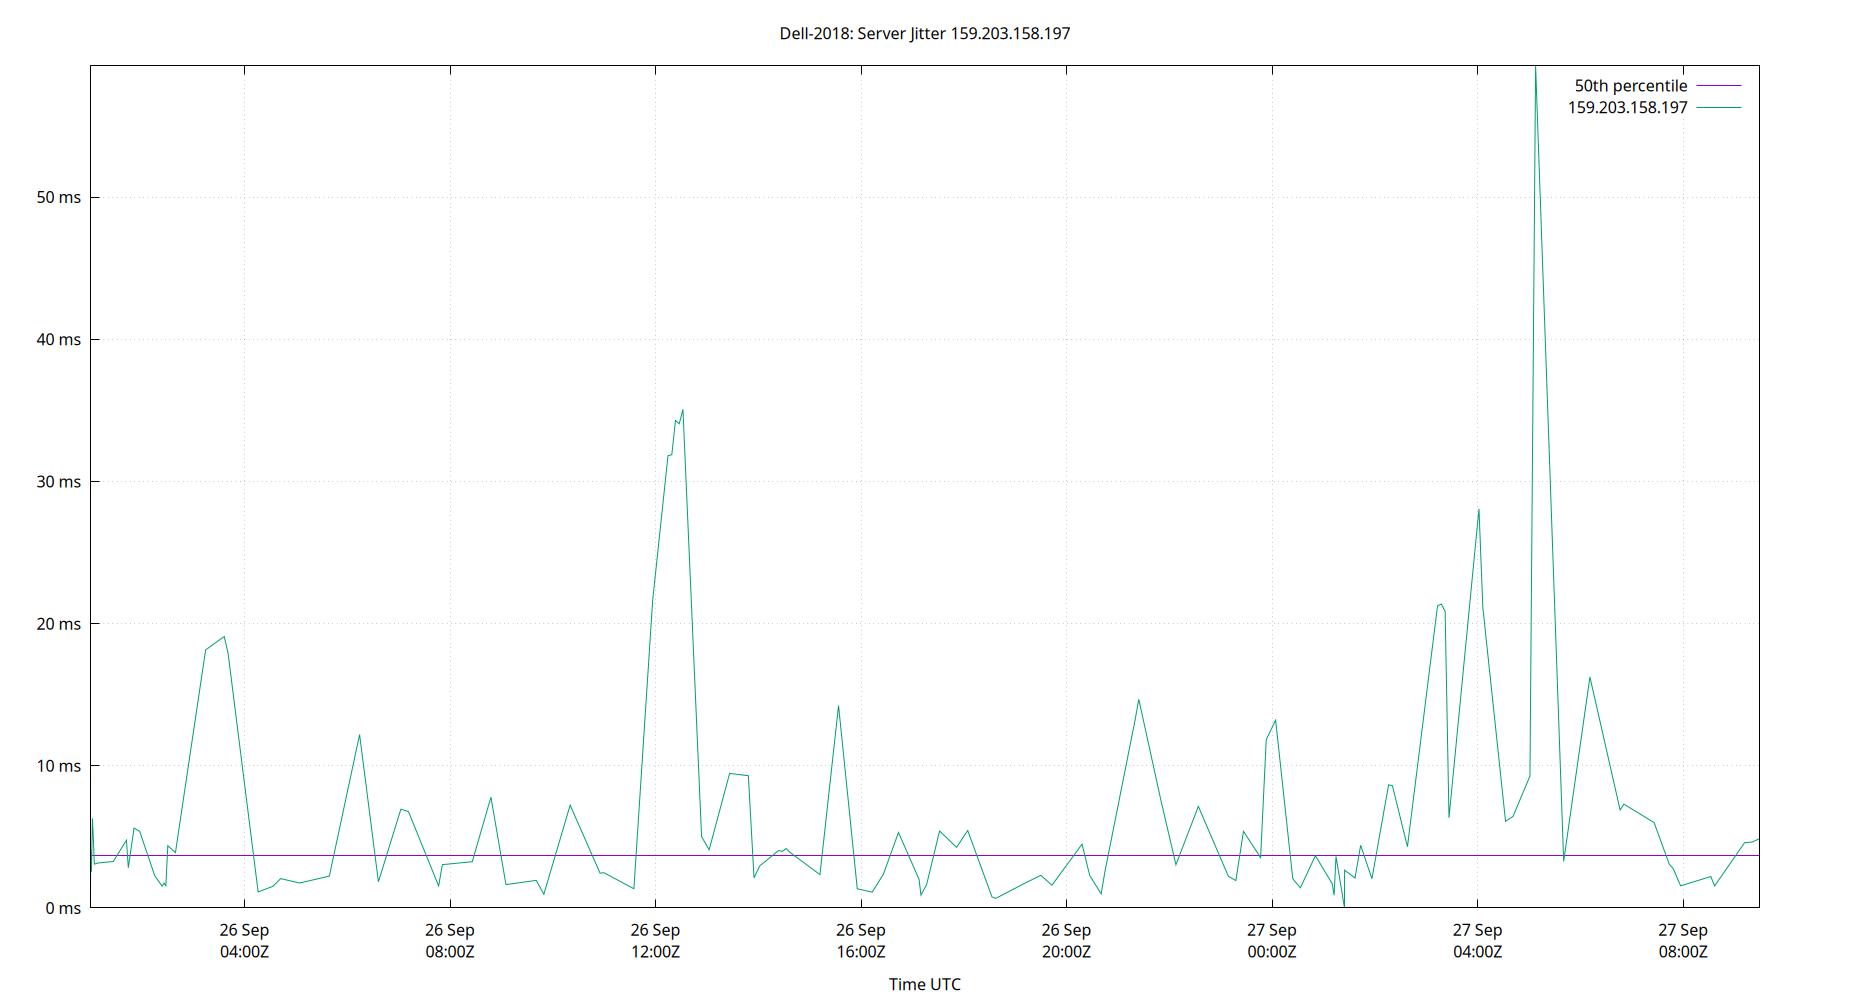
| Percentiles...... | Ranges...... | Skew- | Kurt- | |||||||||||||
| Name | Min | 1% | 5% | 50% | 95% | 99% | Max | 90% | 98% | StdDev | Mean | Units | ness | osis | ||
| Server Jitter 159.203.158.197 | 0.000 | 0.000 | 0.970 | 3.679 | 28.068 | 35.073 | 59.229 | 27.098 | 35.073 | 8.869 | 6.920 | ms | 2.834 | 12.9 | ||
The RMS Jitter of a server. Jitter is the current estimated dispersion, in other words the variation in offset between samples.
Closer to 0s is better. An ideal system would be a horizontal line at 0s.
RMS Jitter is field 8 in the peerstats log file.
Server Jitter 161.35.230.200

| Percentiles...... | Ranges...... | Skew- | Kurt- | |||||||||||||
| Name | Min | 1% | 5% | 50% | 95% | 99% | Max | 90% | 98% | StdDev | Mean | Units | ness | osis | ||
| Server Jitter 161.35.230.200 | 0.000 | 0.000 | 0.000 | 1.722 | 4.765 | 5.072 | 5.072 | 4.765 | 5.072 | 1.384 | 2.182 | ms | 0.4533 | 2.424 | ||
The RMS Jitter of a server. Jitter is the current estimated dispersion, in other words the variation in offset between samples.
Closer to 0s is better. An ideal system would be a horizontal line at 0s.
RMS Jitter is field 8 in the peerstats log file.
Server Jitter 162.159.200.1

| Percentiles...... | Ranges...... | Skew- | Kurt- | |||||||||||||
| Name | Min | 1% | 5% | 50% | 95% | 99% | Max | 90% | 98% | StdDev | Mean | Units | ness | osis | ||
| Server Jitter 162.159.200.1 | 0.000 | 0.611 | 1.086 | 3.495 | 11.634 | 23.568 | 200.939 | 10.549 | 22.957 | 7.746 | 4.920 | ms | 11.88 | 210.7 | ||
The RMS Jitter of a server. Jitter is the current estimated dispersion, in other words the variation in offset between samples.
Closer to 0s is better. An ideal system would be a horizontal line at 0s.
RMS Jitter is field 8 in the peerstats log file.
Server Jitter 162.159.200.123

| Percentiles...... | Ranges...... | Skew- | Kurt- | |||||||||||||
| Name | Min | 1% | 5% | 50% | 95% | 99% | Max | 90% | 98% | StdDev | Mean | Units | ness | osis | ||
| Server Jitter 162.159.200.123 | 0.000 | 0.418 | 1.100 | 3.151 | 14.477 | 45.117 | 89.291 | 13.377 | 44.699 | 7.592 | 4.952 | ms | 6.698 | 61.34 | ||
The RMS Jitter of a server. Jitter is the current estimated dispersion, in other words the variation in offset between samples.
Closer to 0s is better. An ideal system would be a horizontal line at 0s.
RMS Jitter is field 8 in the peerstats log file.
Server Jitter 162.244.81.139

| Percentiles...... | Ranges...... | Skew- | Kurt- | |||||||||||||
| Name | Min | 1% | 5% | 50% | 95% | 99% | Max | 90% | 98% | StdDev | Mean | Units | ness | osis | ||
| Server Jitter 162.244.81.139 | 0.000 | 0.000 | 1.693 | 12.794 | 49.214 | 241.378 | 310.114 | 47.521 | 241.378 | 38.806 | 21.014 | ms | 5.115 | 31.27 | ||
The RMS Jitter of a server. Jitter is the current estimated dispersion, in other words the variation in offset between samples.
Closer to 0s is better. An ideal system would be a horizontal line at 0s.
RMS Jitter is field 8 in the peerstats log file.
Server Jitter 162.254.225.151
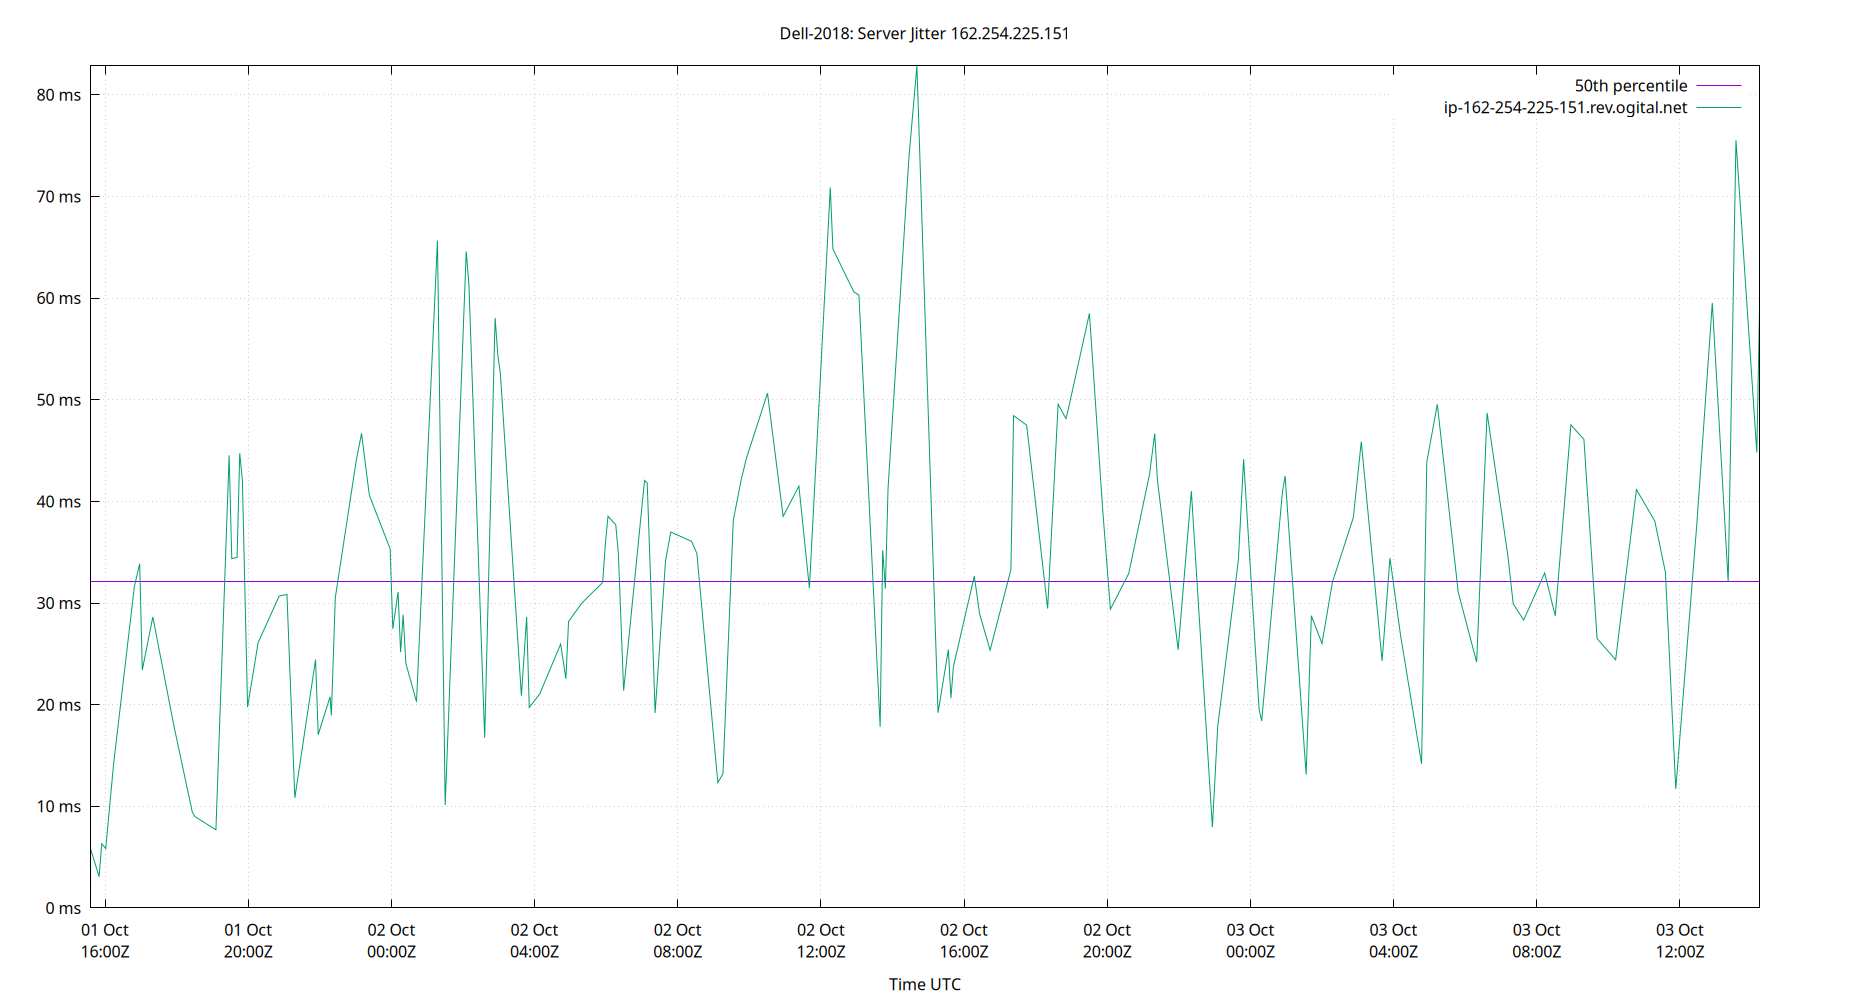
| Percentiles...... | Ranges...... | Skew- | Kurt- | |||||||||||||
| Name | Min | 1% | 5% | 50% | 95% | 99% | Max | 90% | 98% | StdDev | Mean | Units | ness | osis | ||
| Server Jitter 162.254.225.151 | 0.000 | 3.082 | 8.987 | 32.115 | 61.363 | 75.521 | 82.844 | 52.376 | 72.439 | 15.378 | 33.549 | ms | 0.483 | 3.374 | ||
The RMS Jitter of a server. Jitter is the current estimated dispersion, in other words the variation in offset between samples.
Closer to 0s is better. An ideal system would be a horizontal line at 0s.
RMS Jitter is field 8 in the peerstats log file.
Server Jitter 162.254.225.152
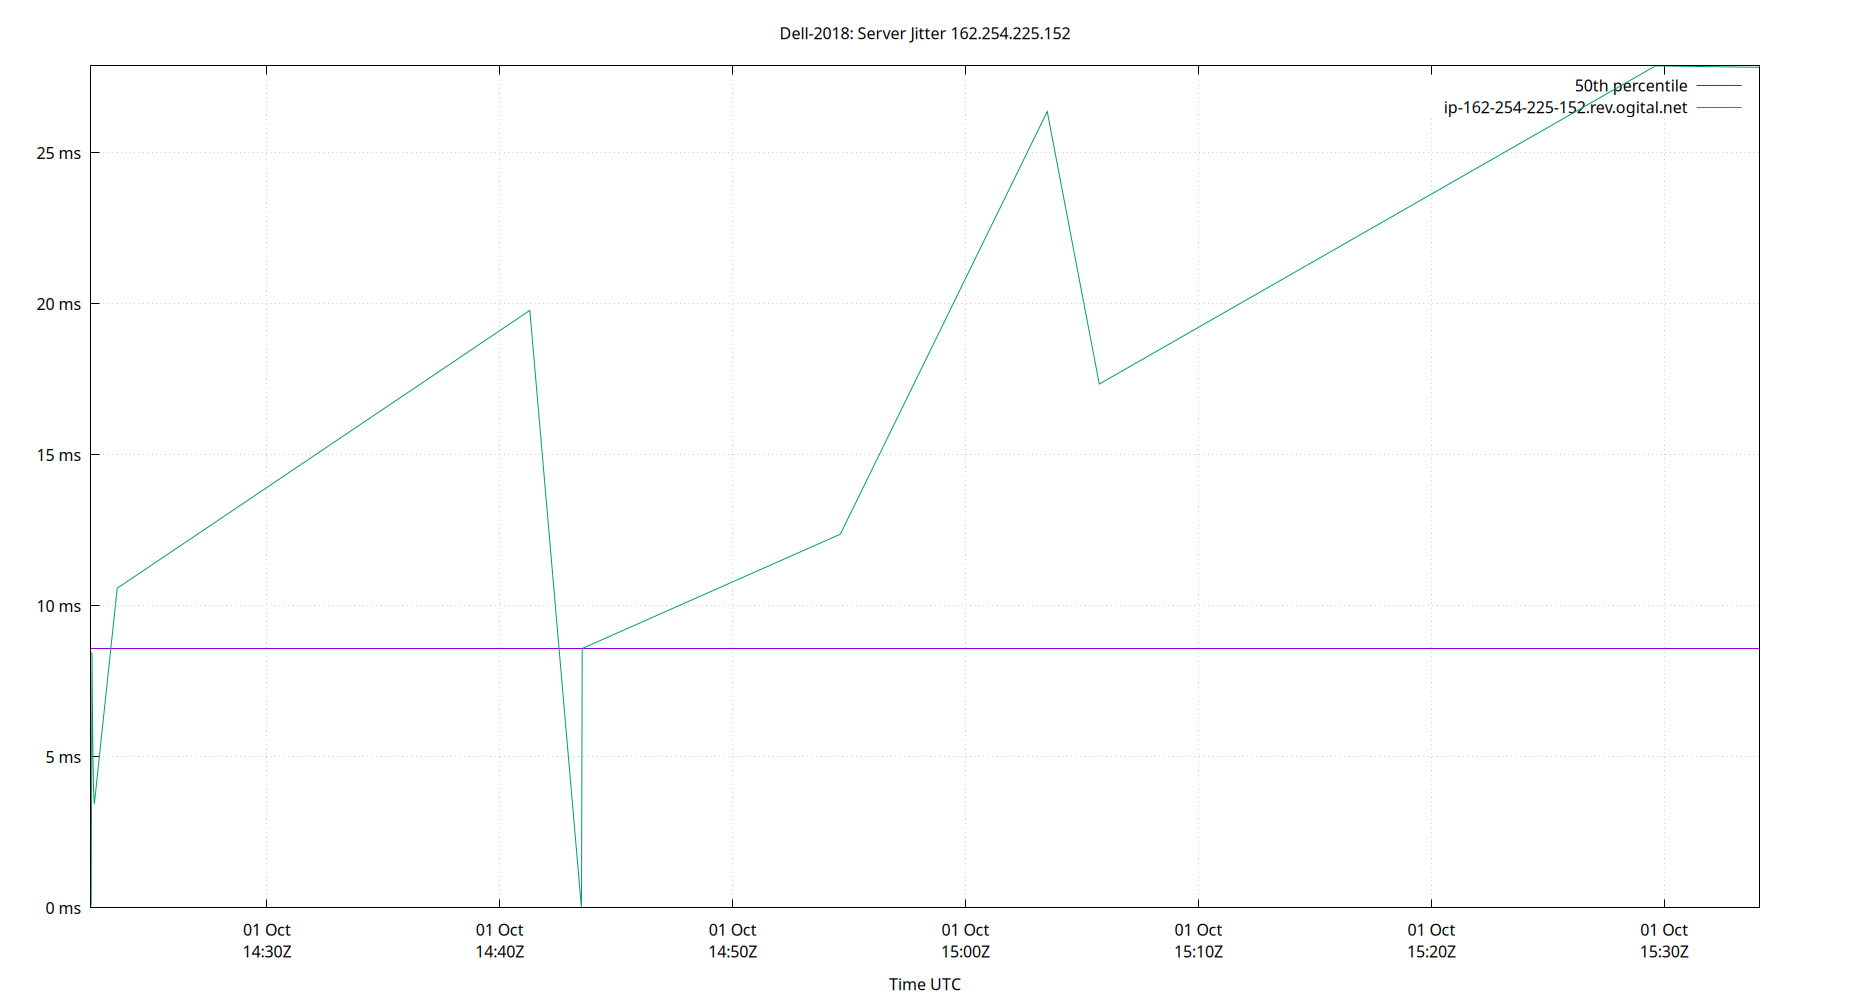
| Percentiles...... | Ranges...... | Skew- | Kurt- | |||||||||||||
| Name | Min | 1% | 5% | 50% | 95% | 99% | Max | 90% | 98% | StdDev | Mean | Units | ness | osis | ||
| Server Jitter 162.254.225.152 | 0.000 | 0.000 | 0.000 | 8.593 | 27.885 | 27.885 | 27.885 | 27.885 | 27.885 | 9.771 | 11.475 | ms | 0.5127 | 1.898 | ||
The RMS Jitter of a server. Jitter is the current estimated dispersion, in other words the variation in offset between samples.
Closer to 0s is better. An ideal system would be a horizontal line at 0s.
RMS Jitter is field 8 in the peerstats log file.
Server Jitter 163.123.152.14

| Percentiles...... | Ranges...... | Skew- | Kurt- | |||||||||||||
| Name | Min | 1% | 5% | 50% | 95% | 99% | Max | 90% | 98% | StdDev | Mean | Units | ness | osis | ||
| Server Jitter 163.123.152.14 | 0.000 | 0.000 | 0.000 | 3.728 | 4.357 | 4.357 | 4.357 | 4.357 | 4.357 | 1.674 | 2.791 | ms | -0.9099 | 2.151 | ||
The RMS Jitter of a server. Jitter is the current estimated dispersion, in other words the variation in offset between samples.
Closer to 0s is better. An ideal system would be a horizontal line at 0s.
RMS Jitter is field 8 in the peerstats log file.
Server Jitter 163.123.153.14
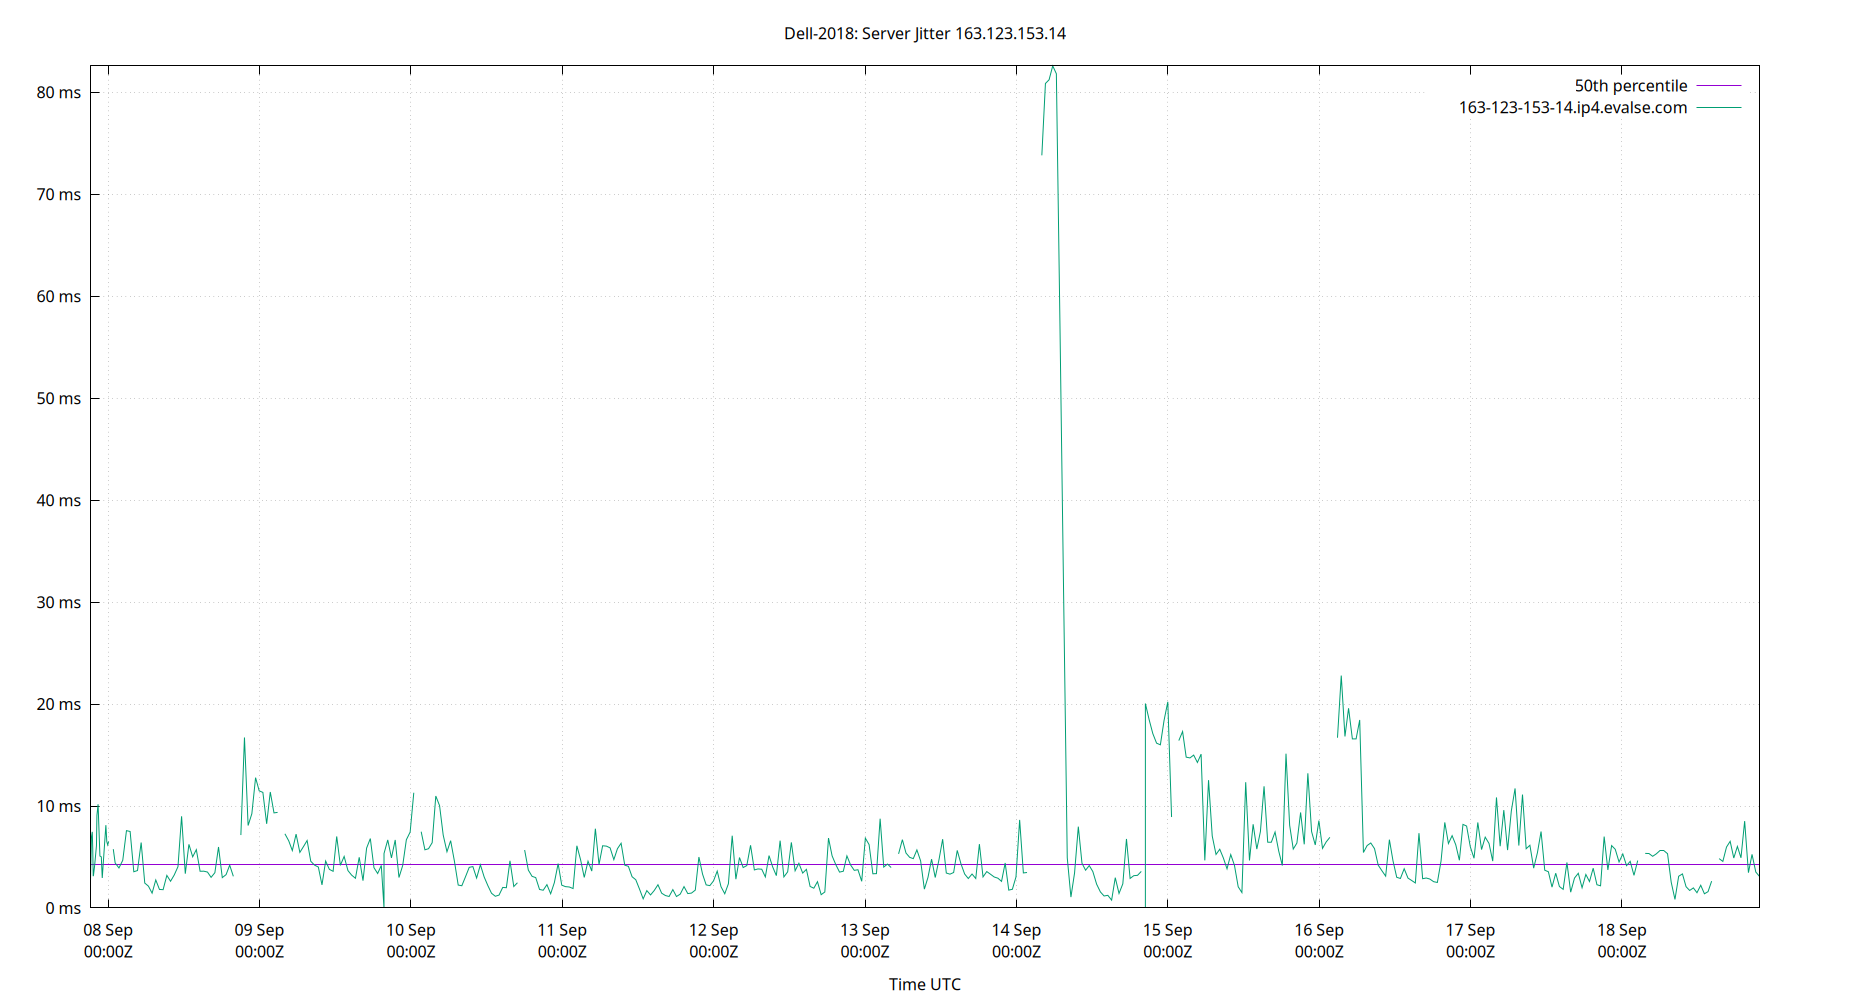
| Percentiles...... | Ranges...... | Skew- | Kurt- | |||||||||||||
| Name | Min | 1% | 5% | 50% | 95% | 99% | Max | 90% | 98% | StdDev | Mean | Units | ness | osis | ||
| Server Jitter 163.123.153.14 | 0.000 | 0.899 | 1.455 | 4.019 | 16.420 | 57.022 | 82.597 | 14.965 | 56.123 | 9.692 | 6.311 | ms | 5.555 | 37.74 | ||
The RMS Jitter of a server. Jitter is the current estimated dispersion, in other words the variation in offset between samples.
Closer to 0s is better. An ideal system would be a horizontal line at 0s.
RMS Jitter is field 8 in the peerstats log file.
Server Jitter 166.88.142.52

| Percentiles...... | Ranges...... | Skew- | Kurt- | |||||||||||||
| Name | Min | 1% | 5% | 50% | 95% | 99% | Max | 90% | 98% | StdDev | Mean | Units | ness | osis | ||
| Server Jitter 166.88.142.52 | 0.000 | 0.000 | 0.000 | 1.075 | 3.927 | 3.927 | 3.927 | 3.927 | 3.927 | 1.133 | 1.349 | ms | 1.419 | 4.128 | ||
The RMS Jitter of a server. Jitter is the current estimated dispersion, in other words the variation in offset between samples.
Closer to 0s is better. An ideal system would be a horizontal line at 0s.
RMS Jitter is field 8 in the peerstats log file.
Server Jitter 168.235.89.132

| Percentiles...... | Ranges...... | Skew- | Kurt- | |||||||||||||
| Name | Min | 1% | 5% | 50% | 95% | 99% | Max | 90% | 98% | StdDev | Mean | Units | ness | osis | ||
| Server Jitter 168.235.89.132 | 0.000 | 0.000 | 1.451 | 6.551 | 24.642 | 241.813 | 312.601 | 23.191 | 241.813 | 41.436 | 15.557 | ms | 5.318 | 31.48 | ||
The RMS Jitter of a server. Jitter is the current estimated dispersion, in other words the variation in offset between samples.
Closer to 0s is better. An ideal system would be a horizontal line at 0s.
RMS Jitter is field 8 in the peerstats log file.
Server Jitter 170.187.147.56

| Percentiles...... | Ranges...... | Skew- | Kurt- | |||||||||||||
| Name | Min | 1% | 5% | 50% | 95% | 99% | Max | 90% | 98% | StdDev | Mean | Units | ness | osis | ||
| Server Jitter 170.187.147.56 | 0.000 | 0.346 | 1.042 | 3.020 | 13.585 | 35.711 | 154.182 | 12.543 | 35.365 | 8.619 | 5.057 | ms | 10.79 | 170.1 | ||
The RMS Jitter of a server. Jitter is the current estimated dispersion, in other words the variation in offset between samples.
Closer to 0s is better. An ideal system would be a horizontal line at 0s.
RMS Jitter is field 8 in the peerstats log file.
Server Jitter 171.66.97.126

| Percentiles...... | Ranges...... | Skew- | Kurt- | |||||||||||||
| Name | Min | 1% | 5% | 50% | 95% | 99% | Max | 90% | 98% | StdDev | Mean | Units | ness | osis | ||
| Server Jitter 171.66.97.126 | 0.000 | 0.000 | 0.934 | 2.691 | 18.421 | 98.115 | 126.152 | 17.487 | 98.115 | 14.936 | 5.909 | ms | 6.169 | 42.32 | ||
The RMS Jitter of a server. Jitter is the current estimated dispersion, in other words the variation in offset between samples.
Closer to 0s is better. An ideal system would be a horizontal line at 0s.
RMS Jitter is field 8 in the peerstats log file.
Server Jitter 172.104.28.175
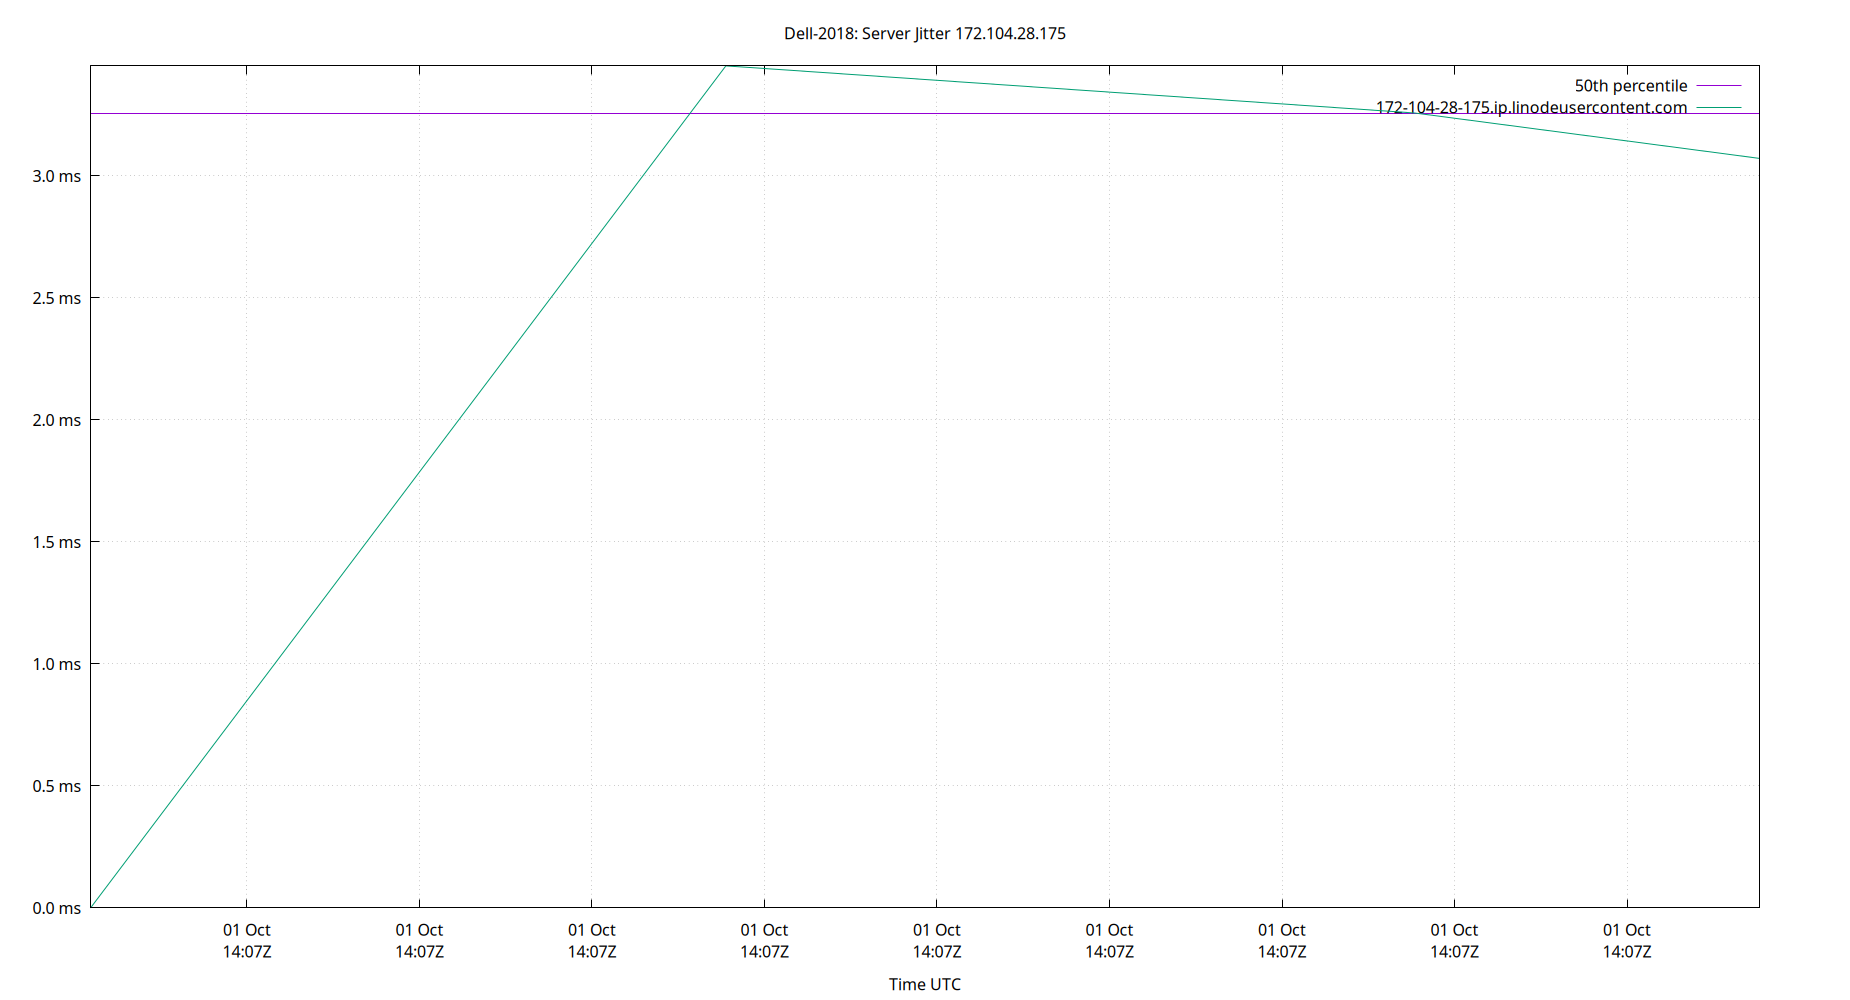
| Percentiles...... | Ranges...... | Skew- | Kurt- | |||||||||||||
| Name | Min | 1% | 5% | 50% | 95% | 99% | Max | 90% | 98% | StdDev | Mean | Units | ness | osis | ||
| Server Jitter 172.104.28.175 | 0.000 | 0.000 | 0.000 | 3.258 | 3.451 | 3.451 | 3.451 | 3.451 | 3.451 | 1.418 | 2.445 | ms | -1.124 | 2.31 | ||
The RMS Jitter of a server. Jitter is the current estimated dispersion, in other words the variation in offset between samples.
Closer to 0s is better. An ideal system would be a horizontal line at 0s.
RMS Jitter is field 8 in the peerstats log file.
Server Jitter 172.232.15.202

| Percentiles...... | Ranges...... | Skew- | Kurt- | |||||||||||||
| Name | Min | 1% | 5% | 50% | 95% | 99% | Max | 90% | 98% | StdDev | Mean | Units | ness | osis | ||
| Server Jitter 172.232.15.202 | 0.000 | 0.000 | 0.000 | 3.215 | 33.540 | 33.540 | 33.540 | 33.540 | 33.540 | 13.913 | 13.115 | ms | 0.3783 | 1.284 | ||
The RMS Jitter of a server. Jitter is the current estimated dispersion, in other words the variation in offset between samples.
Closer to 0s is better. An ideal system would be a horizontal line at 0s.
RMS Jitter is field 8 in the peerstats log file.
Server Jitter 172.233.153.85

| Percentiles...... | Ranges...... | Skew- | Kurt- | |||||||||||||
| Name | Min | 1% | 5% | 50% | 95% | 99% | Max | 90% | 98% | StdDev | Mean | Units | ness | osis | ||
| Server Jitter 172.233.153.85 | 0.000 | 0.000 | 1.067 | 4.764 | 14.089 | 23.765 | 302.556 | 13.022 | 23.765 | 29.458 | 8.479 | ms | 9.659 | 96.43 | ||
The RMS Jitter of a server. Jitter is the current estimated dispersion, in other words the variation in offset between samples.
Closer to 0s is better. An ideal system would be a horizontal line at 0s.
RMS Jitter is field 8 in the peerstats log file.
Server Jitter 172.233.155.39

| Percentiles...... | Ranges...... | Skew- | Kurt- | |||||||||||||
| Name | Min | 1% | 5% | 50% | 95% | 99% | Max | 90% | 98% | StdDev | Mean | Units | ness | osis | ||
| Server Jitter 172.233.155.39 | 0.000 | 0.000 | 0.857 | 2.798 | 13.575 | 19.709 | 19.951 | 12.718 | 19.709 | 3.872 | 3.811 | ms | 2.816 | 11.19 | ||
The RMS Jitter of a server. Jitter is the current estimated dispersion, in other words the variation in offset between samples.
Closer to 0s is better. An ideal system would be a horizontal line at 0s.
RMS Jitter is field 8 in the peerstats log file.
Server Jitter 172.233.157.223

| Percentiles...... | Ranges...... | Skew- | Kurt- | |||||||||||||
| Name | Min | 1% | 5% | 50% | 95% | 99% | Max | 90% | 98% | StdDev | Mean | Units | ness | osis | ||
| Server Jitter 172.233.157.223 | 0.000 | 0.000 | 1.134 | 3.693 | 17.831 | 227.721 | 477.649 | 16.697 | 227.721 | 41.160 | 10.833 | ms | 7.887 | 73.89 | ||
The RMS Jitter of a server. Jitter is the current estimated dispersion, in other words the variation in offset between samples.
Closer to 0s is better. An ideal system would be a horizontal line at 0s.
RMS Jitter is field 8 in the peerstats log file.
Server Jitter 172.233.177.198

| Percentiles...... | Ranges...... | Skew- | Kurt- | |||||||||||||
| Name | Min | 1% | 5% | 50% | 95% | 99% | Max | 90% | 98% | StdDev | Mean | Units | ness | osis | ||
| Server Jitter 172.233.177.198 | 0.000 | 0.000 | 0.000 | 5.156 | 9.581 | 9.581 | 9.581 | 9.581 | 9.581 | 2.646 | 5.415 | ms | -0.2803 | 2.993 | ||
The RMS Jitter of a server. Jitter is the current estimated dispersion, in other words the variation in offset between samples.
Closer to 0s is better. An ideal system would be a horizontal line at 0s.
RMS Jitter is field 8 in the peerstats log file.
Server Jitter 172.233.189.68

| Percentiles...... | Ranges...... | Skew- | Kurt- | |||||||||||||
| Name | Min | 1% | 5% | 50% | 95% | 99% | Max | 90% | 98% | StdDev | Mean | Units | ness | osis | ||
| Server Jitter 172.233.189.68 | 0.000 | 0.000 | 0.599 | 17.934 | 37.387 | 49.953 | 52.151 | 36.788 | 49.953 | 11.734 | 17.669 | ms | 0.4156 | 2.82 | ||
The RMS Jitter of a server. Jitter is the current estimated dispersion, in other words the variation in offset between samples.
Closer to 0s is better. An ideal system would be a horizontal line at 0s.
RMS Jitter is field 8 in the peerstats log file.
Server Jitter 172.234.25.10

| Percentiles...... | Ranges...... | Skew- | Kurt- | |||||||||||||
| Name | Min | 1% | 5% | 50% | 95% | 99% | Max | 90% | 98% | StdDev | Mean | Units | ness | osis | ||
| Server Jitter 172.234.25.10 | 0.000 | 0.000 | 1.002 | 3.849 | 11.993 | 15.117 | 20.475 | 10.991 | 15.117 | 3.352 | 4.781 | ms | 1.687 | 6.835 | ||
The RMS Jitter of a server. Jitter is the current estimated dispersion, in other words the variation in offset between samples.
Closer to 0s is better. An ideal system would be a horizontal line at 0s.
RMS Jitter is field 8 in the peerstats log file.
Server Jitter 172.234.37.140

| Percentiles...... | Ranges...... | Skew- | Kurt- | |||||||||||||
| Name | Min | 1% | 5% | 50% | 95% | 99% | Max | 90% | 98% | StdDev | Mean | Units | ness | osis | ||
| Server Jitter 172.234.37.140 | 0.000 | 0.000 | 0.964 | 4.951 | 38.858 | 76.993 | 110.008 | 37.894 | 76.993 | 16.647 | 11.284 | ms | 3.198 | 14.54 | ||
The RMS Jitter of a server. Jitter is the current estimated dispersion, in other words the variation in offset between samples.
Closer to 0s is better. An ideal system would be a horizontal line at 0s.
RMS Jitter is field 8 in the peerstats log file.
Server Jitter 172.234.44.141

| Percentiles...... | Ranges...... | Skew- | Kurt- | |||||||||||||
| Name | Min | 1% | 5% | 50% | 95% | 99% | Max | 90% | 98% | StdDev | Mean | Units | ness | osis | ||
| Server Jitter 172.234.44.141 | 0.000 | 0.000 | 1.217 | 9.440 | 37.592 | 42.602 | 60.768 | 36.376 | 42.602 | 11.543 | 12.278 | ms | 1.444 | 5.242 | ||
The RMS Jitter of a server. Jitter is the current estimated dispersion, in other words the variation in offset between samples.
Closer to 0s is better. An ideal system would be a horizontal line at 0s.
RMS Jitter is field 8 in the peerstats log file.
Server Jitter 172.235.154.118
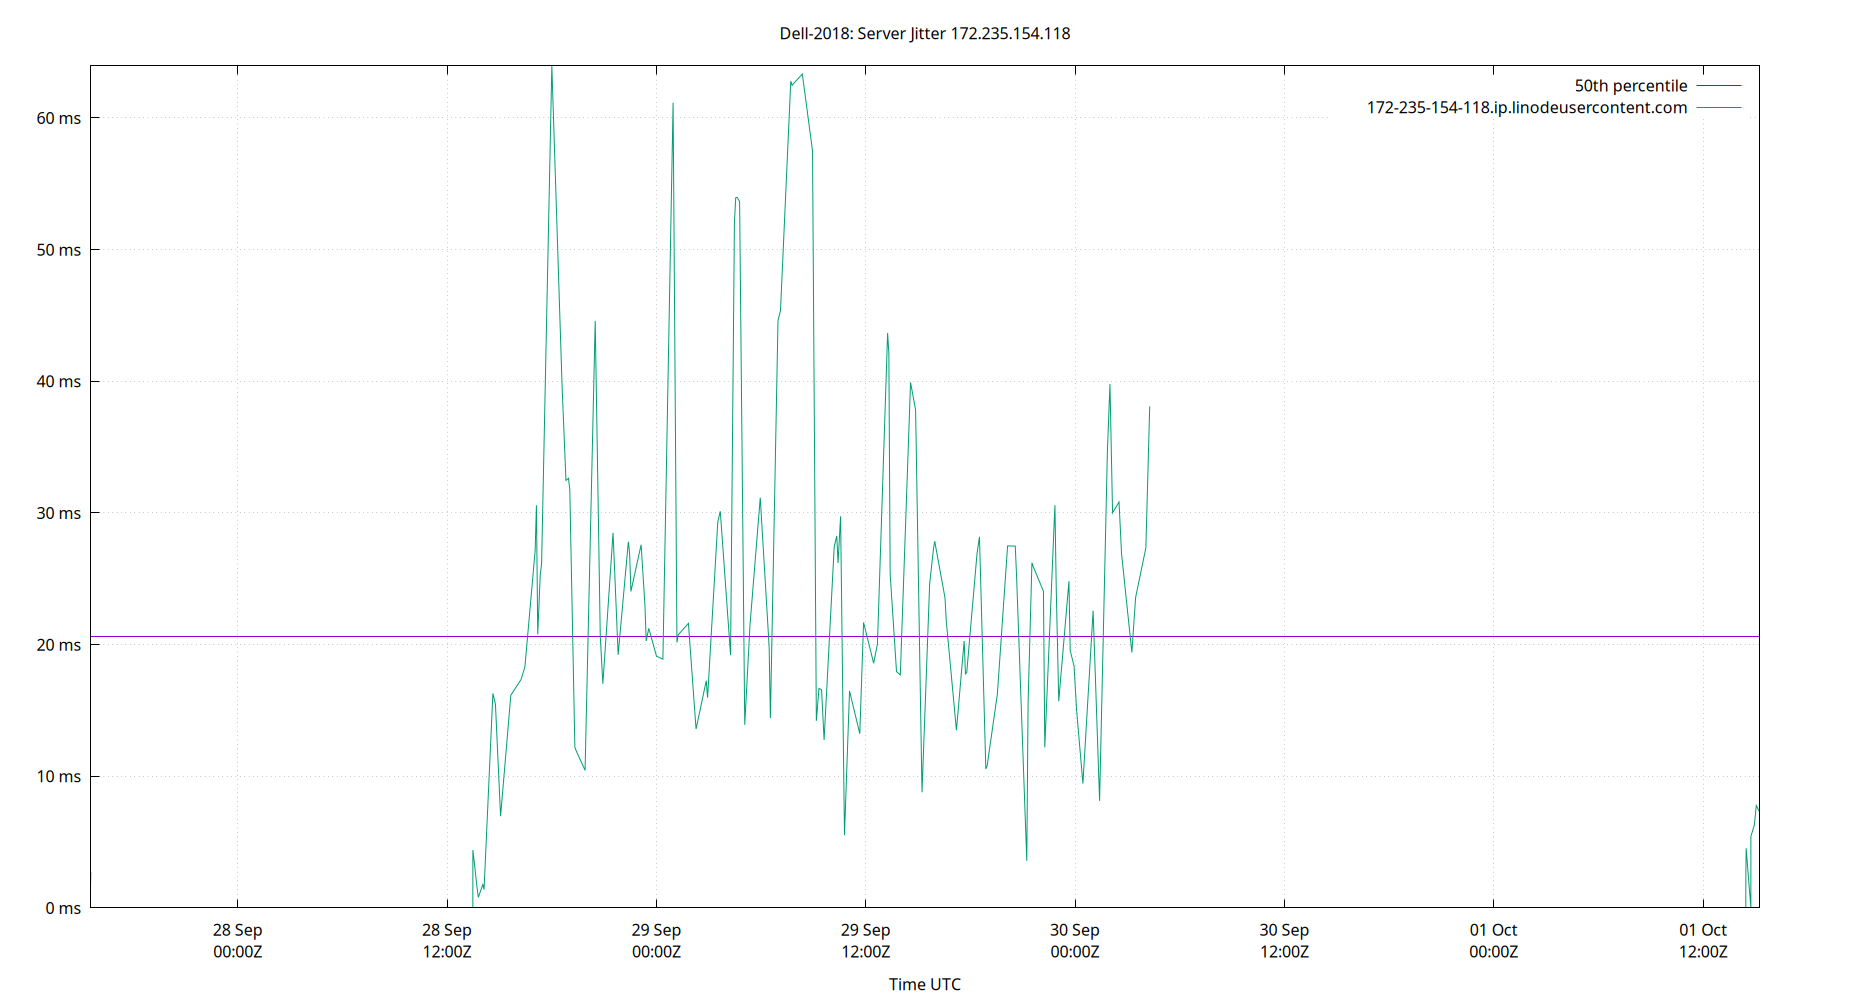
| Percentiles...... | Ranges...... | Skew- | Kurt- | |||||||||||||
| Name | Min | 1% | 5% | 50% | 95% | 99% | Max | 90% | 98% | StdDev | Mean | Units | ness | osis | ||
| Server Jitter 172.235.154.118 | 0.000 | 0.000 | 1.535 | 20.649 | 53.942 | 63.342 | 63.958 | 52.407 | 63.342 | 14.580 | 22.437 | ms | 0.8483 | 3.724 | ||
The RMS Jitter of a server. Jitter is the current estimated dispersion, in other words the variation in offset between samples.
Closer to 0s is better. An ideal system would be a horizontal line at 0s.
RMS Jitter is field 8 in the peerstats log file.
Server Jitter 172.235.60.8

| Percentiles...... | Ranges...... | Skew- | Kurt- | |||||||||||||
| Name | Min | 1% | 5% | 50% | 95% | 99% | Max | 90% | 98% | StdDev | Mean | Units | ness | osis | ||
| Server Jitter 172.235.60.8 | 0.000 | 0.773 | 1.154 | 3.472 | 14.471 | 27.652 | 74.064 | 13.318 | 26.879 | 5.681 | 4.934 | ms | 5.261 | 44.65 | ||
The RMS Jitter of a server. Jitter is the current estimated dispersion, in other words the variation in offset between samples.
Closer to 0s is better. An ideal system would be a horizontal line at 0s.
RMS Jitter is field 8 in the peerstats log file.
Server Jitter 172.238.164.57

| Percentiles...... | Ranges...... | Skew- | Kurt- | |||||||||||||
| Name | Min | 1% | 5% | 50% | 95% | 99% | Max | 90% | 98% | StdDev | Mean | Units | ness | osis | ||
| Server Jitter 172.238.164.57 | 0.000 | 0.651 | 1.077 | 3.190 | 12.196 | 22.320 | 98.321 | 11.119 | 21.670 | 6.582 | 4.553 | ms | 9.34 | 119.8 | ||
The RMS Jitter of a server. Jitter is the current estimated dispersion, in other words the variation in offset between samples.
Closer to 0s is better. An ideal system would be a horizontal line at 0s.
RMS Jitter is field 8 in the peerstats log file.
Server Jitter 172.245.210.108

| Percentiles...... | Ranges...... | Skew- | Kurt- | |||||||||||||
| Name | Min | 1% | 5% | 50% | 95% | 99% | Max | 90% | 98% | StdDev | Mean | Units | ness | osis | ||
| Server Jitter 172.245.210.108 | 0.000 | 0.000 | 0.000 | 3.191 | 187.963 | 208.084 | 208.084 | 187.963 | 208.084 | 52.818 | 21.295 | ms | 2.724 | 8.749 | ||
The RMS Jitter of a server. Jitter is the current estimated dispersion, in other words the variation in offset between samples.
Closer to 0s is better. An ideal system would be a horizontal line at 0s.
RMS Jitter is field 8 in the peerstats log file.
Server Jitter 173.249.203.227

| Percentiles...... | Ranges...... | Skew- | Kurt- | |||||||||||||
| Name | Min | 1% | 5% | 50% | 95% | 99% | Max | 90% | 98% | StdDev | Mean | Units | ness | osis | ||
| Server Jitter 173.249.203.227 | 0.000 | 0.000 | 0.000 | 2.338 | 5.843 | 5.843 | 5.843 | 5.843 | 5.843 | 1.587 | 2.822 | ms | 0.3165 | 2.627 | ||
The RMS Jitter of a server. Jitter is the current estimated dispersion, in other words the variation in offset between samples.
Closer to 0s is better. An ideal system would be a horizontal line at 0s.
RMS Jitter is field 8 in the peerstats log file.
Server Jitter 173.255.230.96

| Percentiles...... | Ranges...... | Skew- | Kurt- | |||||||||||||
| Name | Min | 1% | 5% | 50% | 95% | 99% | Max | 90% | 98% | StdDev | Mean | Units | ness | osis | ||
| Server Jitter 173.255.230.96 | 0.000 | 0.000 | 1.050 | 3.510 | 18.774 | 67.403 | 67.650 | 17.724 | 67.403 | 9.020 | 6.895 | ms | 3.984 | 24.19 | ||
The RMS Jitter of a server. Jitter is the current estimated dispersion, in other words the variation in offset between samples.
Closer to 0s is better. An ideal system would be a horizontal line at 0s.
RMS Jitter is field 8 in the peerstats log file.
Server Jitter 173.255.255.133

| Percentiles...... | Ranges...... | Skew- | Kurt- | |||||||||||||
| Name | Min | 1% | 5% | 50% | 95% | 99% | Max | 90% | 98% | StdDev | Mean | Units | ness | osis | ||
| Server Jitter 173.255.255.133 | 0.000 | 0.000 | 0.000 | 4.005 | 4.530 | 4.530 | 4.530 | 4.530 | 4.530 | 1.752 | 2.866 | ms | -0.8115 | 2.037 | ||
The RMS Jitter of a server. Jitter is the current estimated dispersion, in other words the variation in offset between samples.
Closer to 0s is better. An ideal system would be a horizontal line at 0s.
RMS Jitter is field 8 in the peerstats log file.
Server Jitter 178.156.185.92

| Percentiles...... | Ranges...... | Skew- | Kurt- | |||||||||||||
| Name | Min | 1% | 5% | 50% | 95% | 99% | Max | 90% | 98% | StdDev | Mean | Units | ness | osis | ||
| Server Jitter 178.156.185.92 | 0.000 | 0.657 | 1.198 | 6.232 | 36.386 | 60.264 | 69.113 | 35.188 | 59.607 | 11.634 | 10.482 | ms | 2.26 | 9.133 | ||
The RMS Jitter of a server. Jitter is the current estimated dispersion, in other words the variation in offset between samples.
Closer to 0s is better. An ideal system would be a horizontal line at 0s.
RMS Jitter is field 8 in the peerstats log file.
Server Jitter 185.214.143.237

| Percentiles...... | Ranges...... | Skew- | Kurt- | |||||||||||||
| Name | Min | 1% | 5% | 50% | 95% | 99% | Max | 90% | 98% | StdDev | Mean | Units | ness | osis | ||
| Server Jitter 185.214.143.237 | 0.000 | 0.000 | 0.849 | 3.509 | 24.075 | 66.532 | 66.532 | 23.226 | 66.532 | 12.782 | 6.885 | ms | 4.143 | 19.26 | ||
The RMS Jitter of a server. Jitter is the current estimated dispersion, in other words the variation in offset between samples.
Closer to 0s is better. An ideal system would be a horizontal line at 0s.
RMS Jitter is field 8 in the peerstats log file.
Server Jitter 185.234.20.134

| Percentiles...... | Ranges...... | Skew- | Kurt- | |||||||||||||
| Name | Min | 1% | 5% | 50% | 95% | 99% | Max | 90% | 98% | StdDev | Mean | Units | ness | osis | ||
| Server Jitter 185.234.20.134 | 0.000 | 0.000 | 0.508 | 39.811 | 79.288 | 185.571 | 206.604 | 78.780 | 185.571 | 30.495 | 40.818 | ms | 2.363 | 12.83 | ||
The RMS Jitter of a server. Jitter is the current estimated dispersion, in other words the variation in offset between samples.
Closer to 0s is better. An ideal system would be a horizontal line at 0s.
RMS Jitter is field 8 in the peerstats log file.
Server Jitter 192.207.55.254
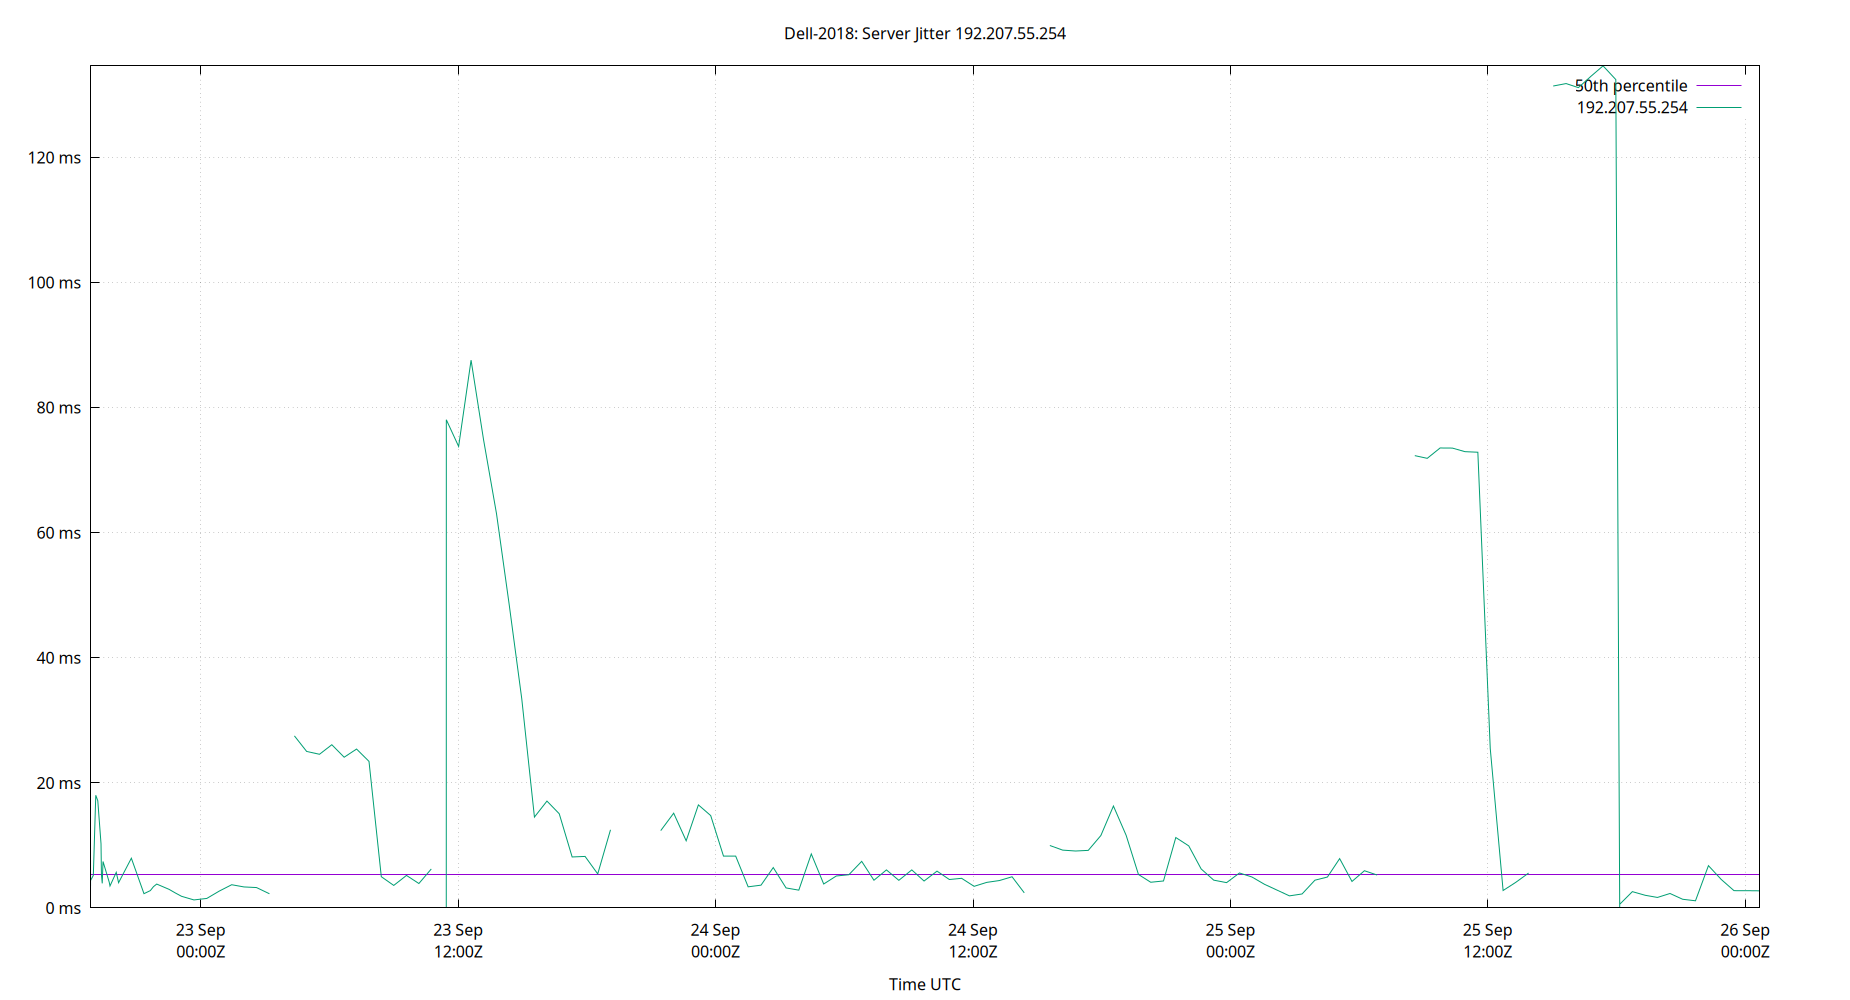
| Percentiles...... | Ranges...... | Skew- | Kurt- | |||||||||||||
| Name | Min | 1% | 5% | 50% | 95% | 99% | Max | 90% | 98% | StdDev | Mean | Units | ness | osis | ||
| Server Jitter 192.207.55.254 | 0.000 | 0.000 | 1.395 | 5.353 | 78.059 | 132.954 | 134.633 | 76.664 | 132.954 | 30.185 | 17.569 | ms | 2.68 | 9.499 | ||
The RMS Jitter of a server. Jitter is the current estimated dispersion, in other words the variation in offset between samples.
Closer to 0s is better. An ideal system would be a horizontal line at 0s.
RMS Jitter is field 8 in the peerstats log file.
Server Jitter 192.231.84.117
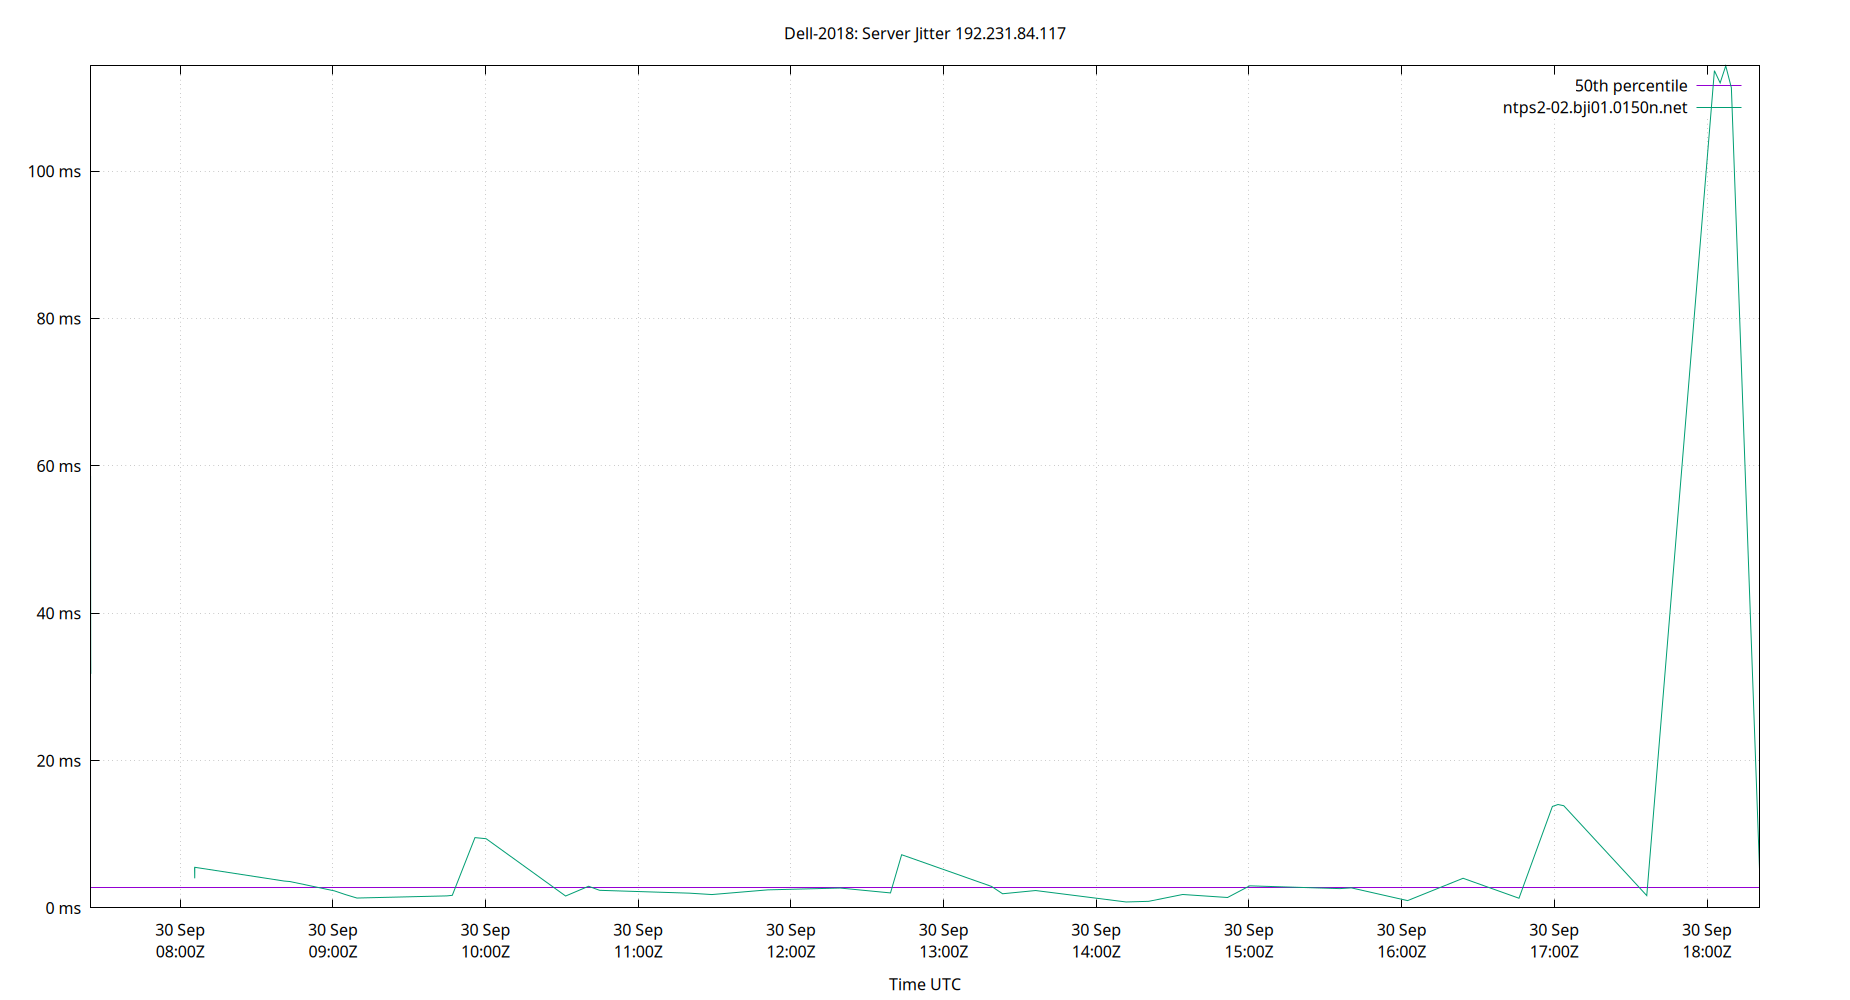
| Percentiles...... | Ranges...... | Skew- | Kurt- | |||||||||||||
| Name | Min | 1% | 5% | 50% | 95% | 99% | Max | 90% | 98% | StdDev | Mean | Units | ness | osis | ||
| Server Jitter 192.231.84.117 | 0.000 | 0.000 | 0.904 | 2.731 | 111.990 | 114.301 | 114.301 | 111.086 | 114.301 | 31.413 | 15.471 | ms | 2.543 | 7.959 | ||
The RMS Jitter of a server. Jitter is the current estimated dispersion, in other words the variation in offset between samples.
Closer to 0s is better. An ideal system would be a horizontal line at 0s.
RMS Jitter is field 8 in the peerstats log file.
Server Jitter 192.231.84.118
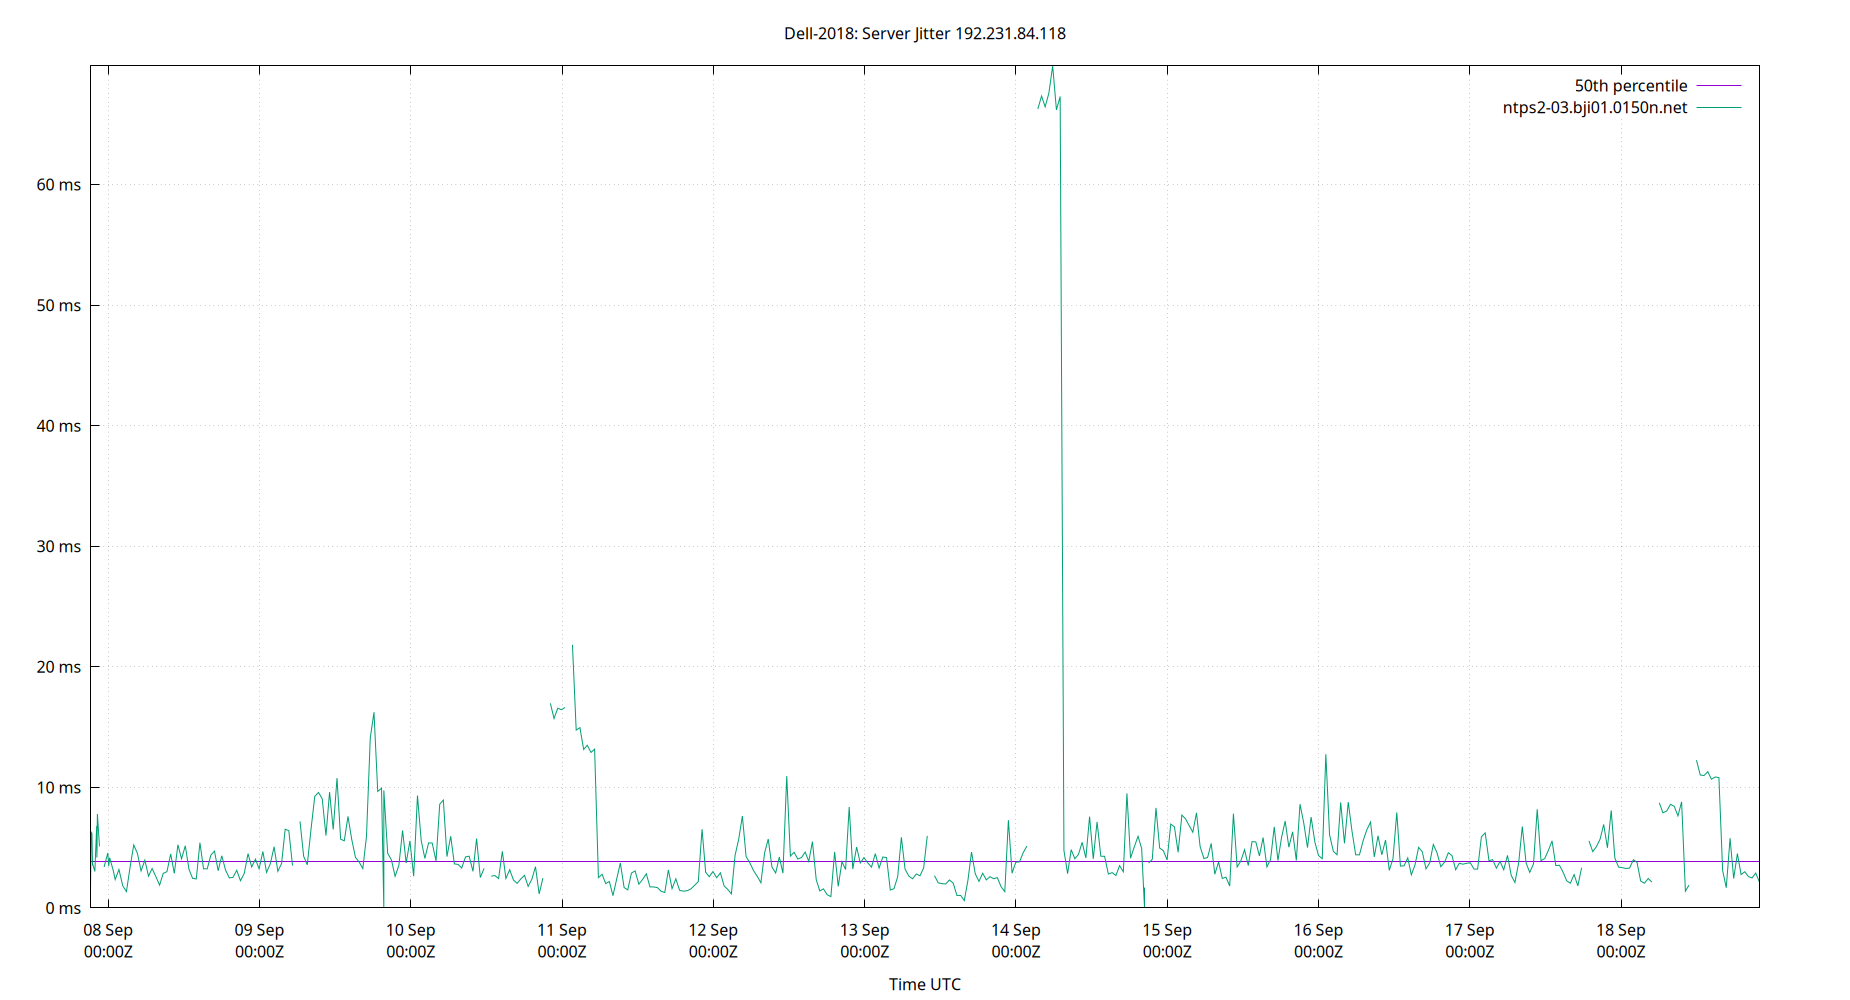
| Percentiles...... | Ranges...... | Skew- | Kurt- | |||||||||||||
| Name | Min | 1% | 5% | 50% | 95% | 99% | Max | 90% | 98% | StdDev | Mean | Units | ness | osis | ||
| Server Jitter 192.231.84.118 | 0.000 | 0.934 | 1.393 | 3.578 | 10.863 | 66.268 | 69.847 | 9.470 | 65.334 | 7.525 | 5.026 | ms | 7.106 | 58.43 | ||
The RMS Jitter of a server. Jitter is the current estimated dispersion, in other words the variation in offset between samples.
Closer to 0s is better. An ideal system would be a horizontal line at 0s.
RMS Jitter is field 8 in the peerstats log file.
Server Jitter 192.48.105.15

| Percentiles...... | Ranges...... | Skew- | Kurt- | |||||||||||||
| Name | Min | 1% | 5% | 50% | 95% | 99% | Max | 90% | 98% | StdDev | Mean | Units | ness | osis | ||
| Server Jitter 192.48.105.15 | 0.000 | 0.000 | 7.808 | 30.985 | 62.953 | 81.489 | 85.309 | 55.145 | 81.489 | 17.040 | 34.378 | ms | 0.4215 | 2.981 | ||
The RMS Jitter of a server. Jitter is the current estimated dispersion, in other words the variation in offset between samples.
Closer to 0s is better. An ideal system would be a horizontal line at 0s.
RMS Jitter is field 8 in the peerstats log file.
Server Jitter 193.29.63.226

| Percentiles...... | Ranges...... | Skew- | Kurt- | |||||||||||||
| Name | Min | 1% | 5% | 50% | 95% | 99% | Max | 90% | 98% | StdDev | Mean | Units | ness | osis | ||
| Server Jitter 193.29.63.226 | 0.000 | 0.000 | 0.000 | 2.854 | 7.768 | 7.768 | 7.768 | 7.768 | 7.768 | 1.838 | 2.982 | ms | 1.078 | 4.127 | ||
The RMS Jitter of a server. Jitter is the current estimated dispersion, in other words the variation in offset between samples.
Closer to 0s is better. An ideal system would be a horizontal line at 0s.
RMS Jitter is field 8 in the peerstats log file.
Server Jitter 194.0.5.123

| Percentiles...... | Ranges...... | Skew- | Kurt- | |||||||||||||
| Name | Min | 1% | 5% | 50% | 95% | 99% | Max | 90% | 98% | StdDev | Mean | Units | ness | osis | ||
| Server Jitter 194.0.5.123 | 0.000 | 0.755 | 1.143 | 3.328 | 12.639 | 24.435 | 398.640 | 11.495 | 23.680 | 8.165 | 4.868 | ms | 16.34 | 463.6 | ||
The RMS Jitter of a server. Jitter is the current estimated dispersion, in other words the variation in offset between samples.
Closer to 0s is better. An ideal system would be a horizontal line at 0s.
RMS Jitter is field 8 in the peerstats log file.
Server Jitter 198.137.202.56

| Percentiles...... | Ranges...... | Skew- | Kurt- | |||||||||||||
| Name | Min | 1% | 5% | 50% | 95% | 99% | Max | 90% | 98% | StdDev | Mean | Units | ness | osis | ||
| Server Jitter 198.137.202.56 | 0.000 | 0.765 | 1.186 | 3.435 | 13.890 | 31.984 | 170.481 | 12.704 | 31.219 | 9.067 | 5.251 | ms | 10.1 | 140.9 | ||
The RMS Jitter of a server. Jitter is the current estimated dispersion, in other words the variation in offset between samples.
Closer to 0s is better. An ideal system would be a horizontal line at 0s.
RMS Jitter is field 8 in the peerstats log file.
Server Jitter 198.206.187.98
| Percentiles...... | Ranges...... | Skew- | Kurt- | |||||||||||||
| Name | Min | 1% | 5% | 50% | 95% | 99% | Max | 90% | 98% | StdDev | Mean | Units | ness | osis | ||
| Server Jitter 198.206.187.98 | 0.000 | 0.000 | 0.000 | 2.747 | 29.704 | 29.704 | 29.704 | 29.704 | 29.704 | 11.123 | 7.569 | ms | 1.462 | 3.202 | ||
The RMS Jitter of a server. Jitter is the current estimated dispersion, in other words the variation in offset between samples.
Closer to 0s is better. An ideal system would be a horizontal line at 0s.
RMS Jitter is field 8 in the peerstats log file.
Server Jitter 198.23.132.33
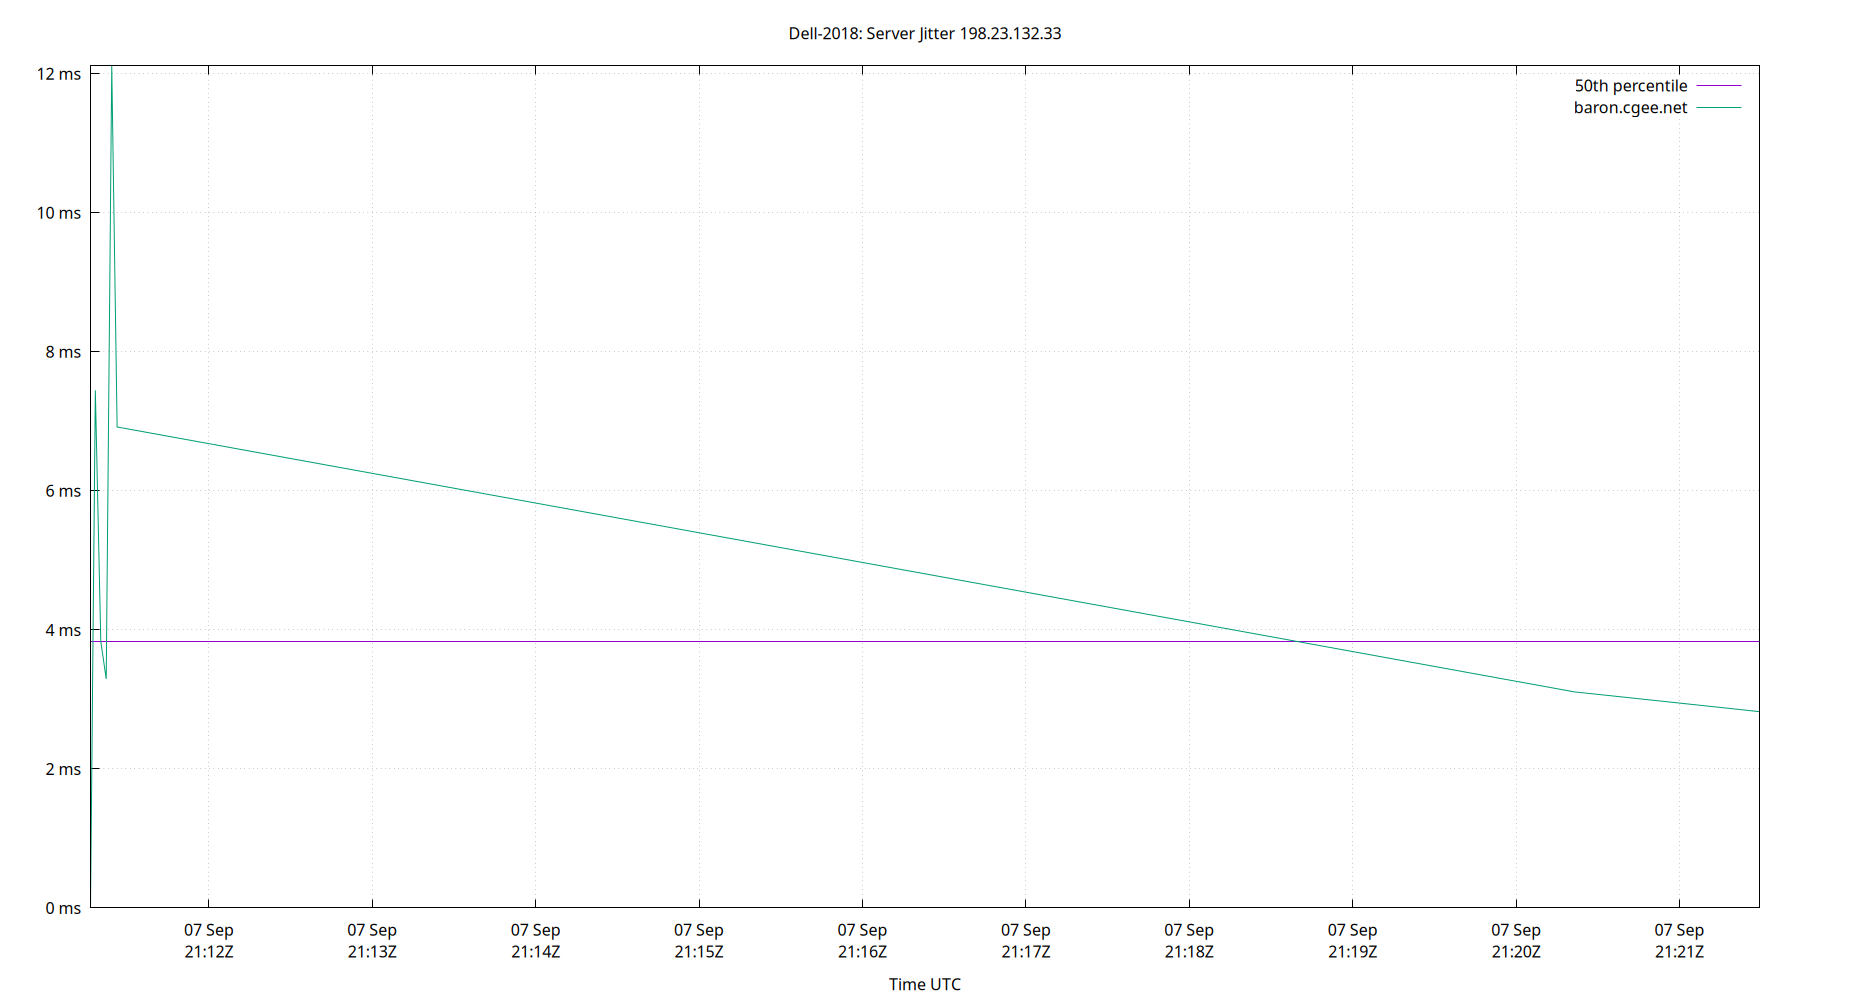
| Percentiles...... | Ranges...... | Skew- | Kurt- | |||||||||||||
| Name | Min | 1% | 5% | 50% | 95% | 99% | Max | 90% | 98% | StdDev | Mean | Units | ness | osis | ||
| Server Jitter 198.23.132.33 | 0.000 | 0.000 | 0.000 | 3.835 | 12.113 | 12.113 | 12.113 | 12.113 | 12.113 | 3.497 | 4.943 | ms | 0.7304 | 2.789 | ||
The RMS Jitter of a server. Jitter is the current estimated dispersion, in other words the variation in offset between samples.
Closer to 0s is better. An ideal system would be a horizontal line at 0s.
RMS Jitter is field 8 in the peerstats log file.
Server Jitter 198.46.254.130

| Percentiles...... | Ranges...... | Skew- | Kurt- | |||||||||||||
| Name | Min | 1% | 5% | 50% | 95% | 99% | Max | 90% | 98% | StdDev | Mean | Units | ness | osis | ||
| Server Jitter 198.46.254.130 | 0.000 | 0.000 | 0.999 | 3.685 | 17.434 | 36.558 | 41.450 | 16.435 | 36.558 | 6.279 | 5.702 | ms | 2.802 | 13.08 | ||
The RMS Jitter of a server. Jitter is the current estimated dispersion, in other words the variation in offset between samples.
Closer to 0s is better. An ideal system would be a horizontal line at 0s.
RMS Jitter is field 8 in the peerstats log file.
Server Jitter 198.60.22.240

| Percentiles...... | Ranges...... | Skew- | Kurt- | |||||||||||||
| Name | Min | 1% | 5% | 50% | 95% | 99% | Max | 90% | 98% | StdDev | Mean | Units | ness | osis | ||
| Server Jitter 198.60.22.240 | 0.000 | 0.000 | 0.000 | 1.229 | 8.123 | 8.123 | 8.123 | 8.123 | 8.123 | 2.808 | 2.774 | ms | 0.7715 | 2.116 | ||
The RMS Jitter of a server. Jitter is the current estimated dispersion, in other words the variation in offset between samples.
Closer to 0s is better. An ideal system would be a horizontal line at 0s.
RMS Jitter is field 8 in the peerstats log file.
Server Jitter 198.71.50.75

| Percentiles...... | Ranges...... | Skew- | Kurt- | |||||||||||||
| Name | Min | 1% | 5% | 50% | 95% | 99% | Max | 90% | 98% | StdDev | Mean | Units | ness | osis | ||
| Server Jitter 198.71.50.75 | 0.000 | 1.525 | 3.734 | 23.735 | 49.077 | 91.787 | 92.484 | 45.343 | 90.262 | 15.505 | 24.891 | ms | 1.557 | 7.619 | ||
The RMS Jitter of a server. Jitter is the current estimated dispersion, in other words the variation in offset between samples.
Closer to 0s is better. An ideal system would be a horizontal line at 0s.
RMS Jitter is field 8 in the peerstats log file.
Server Jitter 199.68.201.237

| Percentiles...... | Ranges...... | Skew- | Kurt- | |||||||||||||
| Name | Min | 1% | 5% | 50% | 95% | 99% | Max | 90% | 98% | StdDev | Mean | Units | ness | osis | ||
| Server Jitter 199.68.201.237 | 0.000 | 1.108 | 1.497 | 4.379 | 13.223 | 24.575 | 59.461 | 11.726 | 23.467 | 4.609 | 5.470 | ms | 4.52 | 39.75 | ||
The RMS Jitter of a server. Jitter is the current estimated dispersion, in other words the variation in offset between samples.
Closer to 0s is better. An ideal system would be a horizontal line at 0s.
RMS Jitter is field 8 in the peerstats log file.
Server Jitter 20.55.26.153

| Percentiles...... | Ranges...... | Skew- | Kurt- | |||||||||||||
| Name | Min | 1% | 5% | 50% | 95% | 99% | Max | 90% | 98% | StdDev | Mean | Units | ness | osis | ||
| Server Jitter 20.55.26.153 | 0.000 | 0.000 | 0.000 | 6.632 | 74.079 | 74.079 | 74.079 | 74.079 | 74.079 | 25.471 | 19.985 | ms | 1.005 | 2.423 | ||
The RMS Jitter of a server. Jitter is the current estimated dispersion, in other words the variation in offset between samples.
Closer to 0s is better. An ideal system would be a horizontal line at 0s.
RMS Jitter is field 8 in the peerstats log file.
Server Jitter 2001:1600:13:101::16b7

| Percentiles...... | Ranges...... | Skew- | Kurt- | |||||||||||||
| Name | Min | 1% | 5% | 50% | 95% | 99% | Max | 90% | 98% | StdDev | Mean | Units | ness | osis | ||
| Server Jitter 2001:1600:13:101::16b7 | 0.000 | 6.381 | 8.865 | 27.341 | 63.554 | 76.237 | 194.366 | 54.689 | 69.856 | 19.414 | 30.805 | ms | 1.848 | 13 | ||
The RMS Jitter of a server. Jitter is the current estimated dispersion, in other words the variation in offset between samples.
Closer to 0s is better. An ideal system would be a horizontal line at 0s.
RMS Jitter is field 8 in the peerstats log file.
Server Jitter 2001:19f0:1590:5123:1057:a11:da7a:1 (lithium.constant.com)

| Percentiles...... | Ranges...... | Skew- | Kurt- | |||||||||||||
| Name | Min | 1% | 5% | 50% | 95% | 99% | Max | 90% | 98% | StdDev | Mean | Units | ness | osis | ||
| Server Jitter 2001:19f0:1590:5123:1057:a11:da7a:1 (lithium.constant.com) | 0.000 | 0.000 | 0.000 | 6.706 | 10.790 | 10.790 | 10.790 | 10.790 | 10.790 | 3.771 | 6.760 | ms | -0.8058 | 2.409 | ||
The RMS Jitter of a server. Jitter is the current estimated dispersion, in other words the variation in offset between samples.
Closer to 0s is better. An ideal system would be a horizontal line at 0s.
RMS Jitter is field 8 in the peerstats log file.
Server Jitter 2001:19f0:6401:400:5400:4ff:fec3:522a

| Percentiles...... | Ranges...... | Skew- | Kurt- | |||||||||||||
| Name | Min | 1% | 5% | 50% | 95% | 99% | Max | 90% | 98% | StdDev | Mean | Units | ness | osis | ||
| Server Jitter 2001:19f0:6401:400:5400:4ff:fec3:522a | 0.000 | 0.000 | 0.000 | 8.886 | 24.636 | 24.636 | 24.636 | 24.636 | 24.636 | 9.634 | 8.939 | ms | 0.7974 | 2.006 | ||
The RMS Jitter of a server. Jitter is the current estimated dispersion, in other words the variation in offset between samples.
Closer to 0s is better. An ideal system would be a horizontal line at 0s.
RMS Jitter is field 8 in the peerstats log file.
Server Jitter 2001:418:3ff::53 (x.ns.gin.ntt.net)

| Percentiles...... | Ranges...... | Skew- | Kurt- | |||||||||||||
| Name | Min | 1% | 5% | 50% | 95% | 99% | Max | 90% | 98% | StdDev | Mean | Units | ness | osis | ||
| Server Jitter 2001:418:3ff::53 (x.ns.gin.ntt.net) | 0.000 | 0.000 | 0.000 | 14.048 | 17.951 | 17.951 | 17.951 | 17.951 | 17.951 | 7.508 | 10.420 | ms | -0.3643 | 1.295 | ||
The RMS Jitter of a server. Jitter is the current estimated dispersion, in other words the variation in offset between samples.
Closer to 0s is better. An ideal system would be a horizontal line at 0s.
RMS Jitter is field 8 in the peerstats log file.
Server Jitter 2001:41d0:303:65e9::1

| Percentiles...... | Ranges...... | Skew- | Kurt- | |||||||||||||
| Name | Min | 1% | 5% | 50% | 95% | 99% | Max | 90% | 98% | StdDev | Mean | Units | ness | osis | ||
| Server Jitter 2001:41d0:303:65e9::1 | 0.000 | 1.638 | 5.026 | 24.360 | 63.536 | 94.275 | 441.235 | 58.511 | 92.637 | 27.238 | 29.563 | ms | 7.074 | 97.1 | ||
The RMS Jitter of a server. Jitter is the current estimated dispersion, in other words the variation in offset between samples.
Closer to 0s is better. An ideal system would be a horizontal line at 0s.
RMS Jitter is field 8 in the peerstats log file.
Server Jitter 2001:470:1f07:24f::123

| Percentiles...... | Ranges...... | Skew- | Kurt- | |||||||||||||
| Name | Min | 1% | 5% | 50% | 95% | 99% | Max | 90% | 98% | StdDev | Mean | Units | ness | osis | ||
| Server Jitter 2001:470:1f07:24f::123 | 0.000 | 0.000 | 0.000 | 25.254 | 42.613 | 42.613 | 42.613 | 42.613 | 42.613 | 13.314 | 18.607 | ms | 0.05496 | 1.858 | ||
The RMS Jitter of a server. Jitter is the current estimated dispersion, in other words the variation in offset between samples.
Closer to 0s is better. An ideal system would be a horizontal line at 0s.
RMS Jitter is field 8 in the peerstats log file.
Server Jitter 2001:470:a:b4::2 (dell-2018.jamesb912.com.)

| Percentiles...... | Ranges...... | Skew- | Kurt- | |||||||||||||
| Name | Min | 1% | 5% | 50% | 95% | 99% | Max | 90% | 98% | StdDev | Mean | Units | ness | osis | ||
| Server Jitter 2001:470:a:b4::2 (dell-2018.jamesb912.com.) | 0.000 | 0.000 | 0.000 | 0.000 | 0.000 | 0.000 | 0.000 | 0.000 | 0.000 | 0.000 | 0.000 | ns | nan | nan | ||
The RMS Jitter of a server. Jitter is the current estimated dispersion, in other words the variation in offset between samples.
Closer to 0s is better. An ideal system would be a horizontal line at 0s.
RMS Jitter is field 8 in the peerstats log file.
Server Jitter 2001:4998:c:1028::1001 (t2.time.gq1.yahoo.com)

| Percentiles...... | Ranges...... | Skew- | Kurt- | |||||||||||||
| Name | Min | 1% | 5% | 50% | 95% | 99% | Max | 90% | 98% | StdDev | Mean | Units | ness | osis | ||
| Server Jitter 2001:4998:c:1028::1001 (t2.time.gq1.yahoo.com) | 0.000 | 0.830 | 1.150 | 3.284 | 24.575 | 55.936 | 146.741 | 23.425 | 55.106 | 10.291 | 6.585 | ms | 4.523 | 32.1 | ||
The RMS Jitter of a server. Jitter is the current estimated dispersion, in other words the variation in offset between samples.
Closer to 0s is better. An ideal system would be a horizontal line at 0s.
RMS Jitter is field 8 in the peerstats log file.
Server Jitter 2001:559:2be:3::1001

| Percentiles...... | Ranges...... | Skew- | Kurt- | |||||||||||||
| Name | Min | 1% | 5% | 50% | 95% | 99% | Max | 90% | 98% | StdDev | Mean | Units | ness | osis | ||
| Server Jitter 2001:559:2be:3::1001 | 0.000 | 0.000 | 0.000 | 2.623 | 4.670 | 4.670 | 4.670 | 4.670 | 4.670 | 1.301 | 2.709 | ms | -0.4538 | 2.918 | ||
The RMS Jitter of a server. Jitter is the current estimated dispersion, in other words the variation in offset between samples.
Closer to 0s is better. An ideal system would be a horizontal line at 0s.
RMS Jitter is field 8 in the peerstats log file.
Server Jitter 2001:678:8::123 (any.time.nl)

| Percentiles...... | Ranges...... | Skew- | Kurt- | |||||||||||||
| Name | Min | 1% | 5% | 50% | 95% | 99% | Max | 90% | 98% | StdDev | Mean | Units | ness | osis | ||
| Server Jitter 2001:678:8::123 (any.time.nl) | 0.000 | 1.336 | 2.466 | 22.769 | 84.523 | 104.133 | 240.582 | 82.057 | 102.797 | 26.853 | 31.178 | ms | 0.982 | 3.468 | ||
The RMS Jitter of a server. Jitter is the current estimated dispersion, in other words the variation in offset between samples.
Closer to 0s is better. An ideal system would be a horizontal line at 0s.
RMS Jitter is field 8 in the peerstats log file.
Server Jitter 204.2.134.173

| Percentiles...... | Ranges...... | Skew- | Kurt- | |||||||||||||
| Name | Min | 1% | 5% | 50% | 95% | 99% | Max | 90% | 98% | StdDev | Mean | Units | ness | osis | ||
| Server Jitter 204.2.134.173 | 0.000 | 0.737 | 1.155 | 3.937 | 11.016 | 25.193 | 273.013 | 9.861 | 24.456 | 16.748 | 5.825 | ms | 14.91 | 236.2 | ||
The RMS Jitter of a server. Jitter is the current estimated dispersion, in other words the variation in offset between samples.
Closer to 0s is better. An ideal system would be a horizontal line at 0s.
RMS Jitter is field 8 in the peerstats log file.
Server Jitter 206.210.192.99

| Percentiles...... | Ranges...... | Skew- | Kurt- | |||||||||||||
| Name | Min | 1% | 5% | 50% | 95% | 99% | Max | 90% | 98% | StdDev | Mean | Units | ness | osis | ||
| Server Jitter 206.210.192.99 | 0.000 | 0.000 | 0.000 | 2.291 | 4.456 | 4.456 | 4.456 | 4.456 | 4.456 | 1.344 | 2.379 | ms | 0.04821 | 2.401 | ||
The RMS Jitter of a server. Jitter is the current estimated dispersion, in other words the variation in offset between samples.
Closer to 0s is better. An ideal system would be a horizontal line at 0s.
RMS Jitter is field 8 in the peerstats log file.
Server Jitter 207.244.103.95
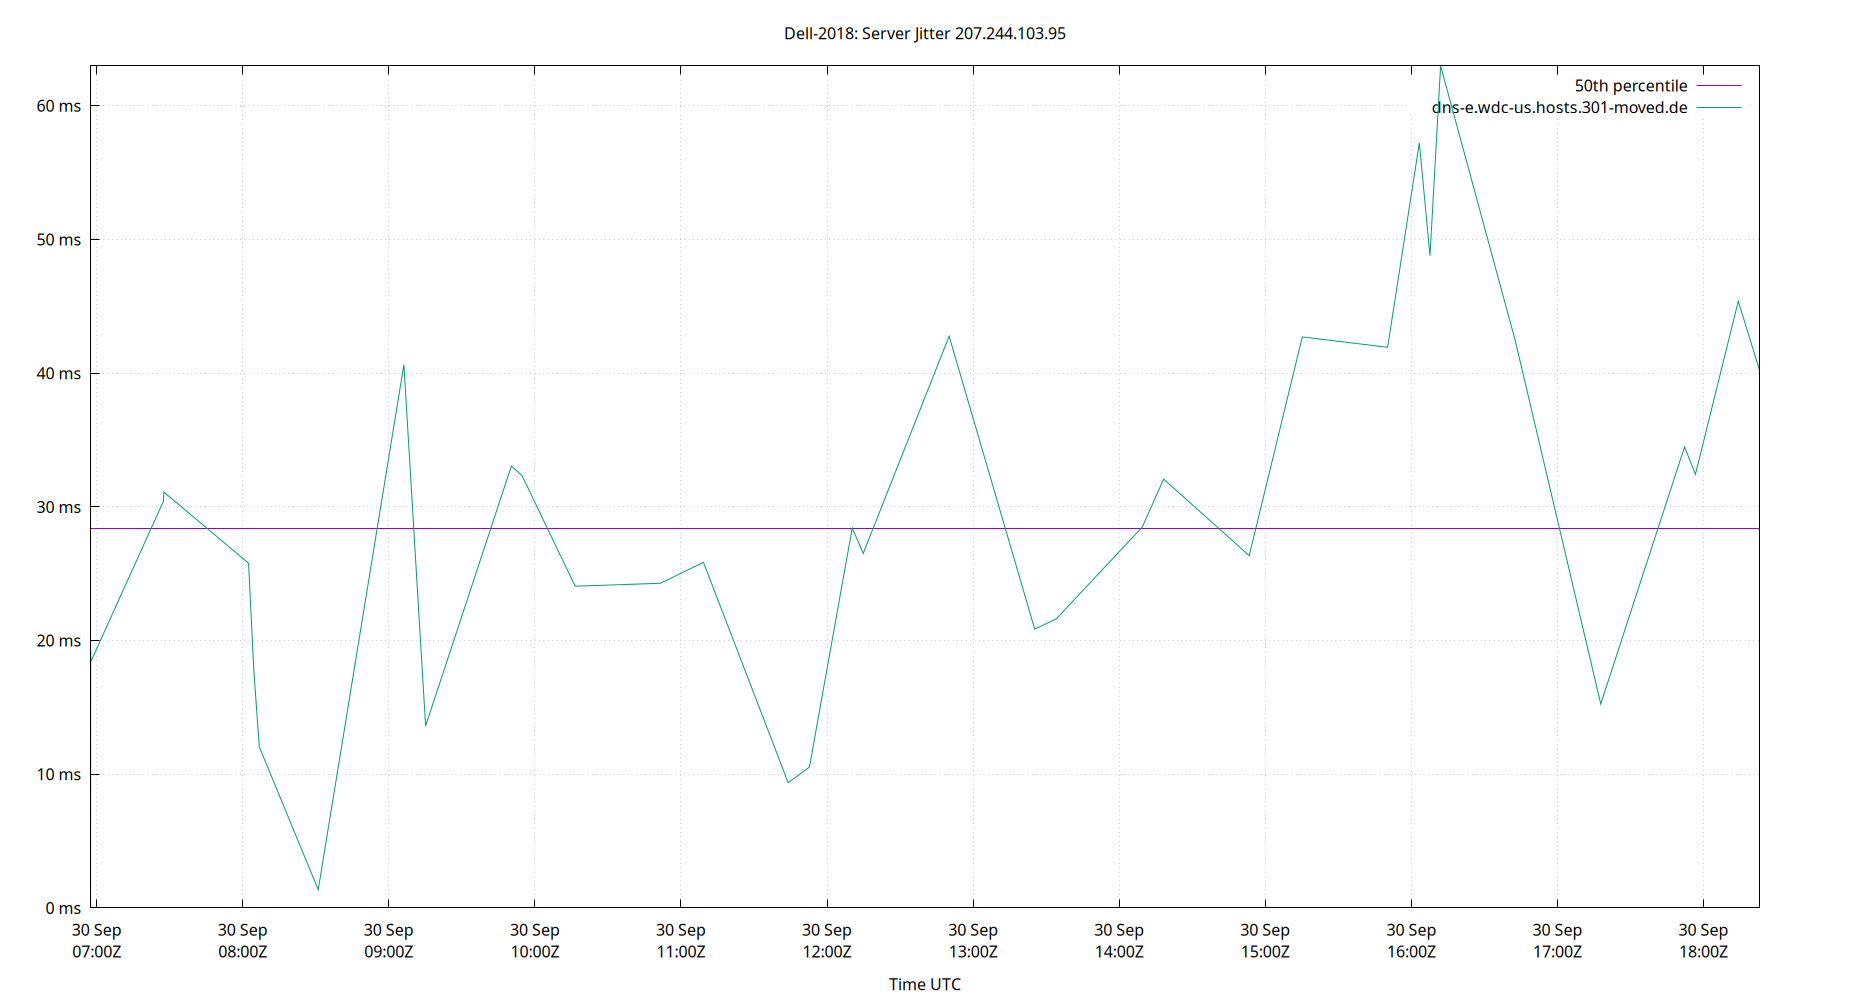
| Percentiles...... | Ranges...... | Skew- | Kurt- | |||||||||||||
| Name | Min | 1% | 5% | 50% | 95% | 99% | Max | 90% | 98% | StdDev | Mean | Units | ness | osis | ||
| Server Jitter 207.244.103.95 | 0.000 | 0.000 | 0.797 | 28.422 | 57.233 | 62.990 | 62.990 | 56.436 | 62.990 | 14.523 | 27.944 | ms | 0.1276 | 2.827 | ||
The RMS Jitter of a server. Jitter is the current estimated dispersion, in other words the variation in offset between samples.
Closer to 0s is better. An ideal system would be a horizontal line at 0s.
RMS Jitter is field 8 in the peerstats log file.
Server Jitter 208.113.130.146

| Percentiles...... | Ranges...... | Skew- | Kurt- | |||||||||||||
| Name | Min | 1% | 5% | 50% | 95% | 99% | Max | 90% | 98% | StdDev | Mean | Units | ness | osis | ||
| Server Jitter 208.113.130.146 | 0.000 | 0.726 | 1.226 | 4.463 | 28.136 | 54.240 | 78.971 | 26.910 | 53.514 | 10.217 | 8.334 | ms | 3.109 | 15.87 | ||
The RMS Jitter of a server. Jitter is the current estimated dispersion, in other words the variation in offset between samples.
Closer to 0s is better. An ideal system would be a horizontal line at 0s.
RMS Jitter is field 8 in the peerstats log file.
Server Jitter 208.70.148.101
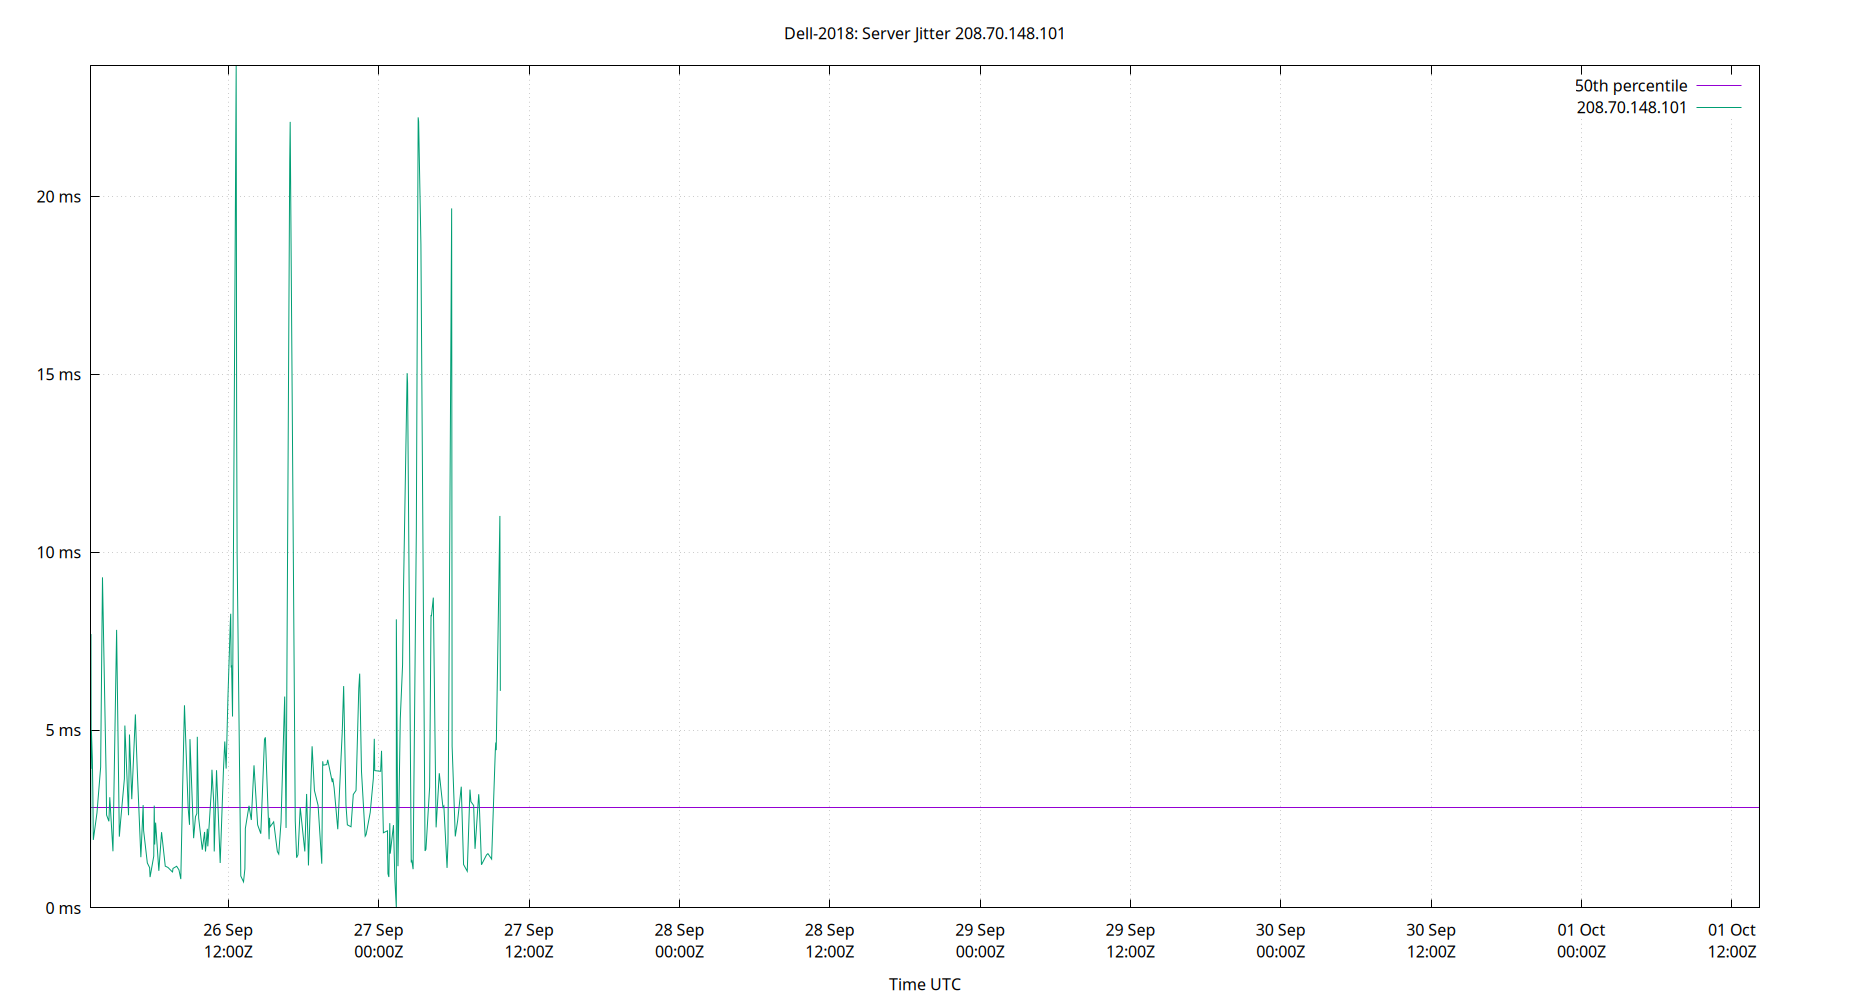
| Percentiles...... | Ranges...... | Skew- | Kurt- | |||||||||||||
| Name | Min | 1% | 5% | 50% | 95% | 99% | Max | 90% | 98% | StdDev | Mean | Units | ness | osis | ||
| Server Jitter 208.70.148.101 | 0.000 | 0.000 | 0.964 | 2.831 | 12.191 | 22.101 | 23.669 | 11.227 | 22.101 | 4.129 | 4.033 | ms | 2.823 | 11.77 | ||
The RMS Jitter of a server. Jitter is the current estimated dispersion, in other words the variation in offset between samples.
Closer to 0s is better. An ideal system would be a horizontal line at 0s.
RMS Jitter is field 8 in the peerstats log file.
Server Jitter 209.177.158.85

| Percentiles...... | Ranges...... | Skew- | Kurt- | |||||||||||||
| Name | Min | 1% | 5% | 50% | 95% | 99% | Max | 90% | 98% | StdDev | Mean | Units | ness | osis | ||
| Server Jitter 209.177.158.85 | 0.000 | 0.638 | 1.059 | 3.381 | 16.552 | 42.861 | 76.463 | 15.494 | 42.223 | 7.143 | 5.333 | ms | 5.146 | 38.96 | ||
The RMS Jitter of a server. Jitter is the current estimated dispersion, in other words the variation in offset between samples.
Closer to 0s is better. An ideal system would be a horizontal line at 0s.
RMS Jitter is field 8 in the peerstats log file.
Server Jitter 209.205.228.50
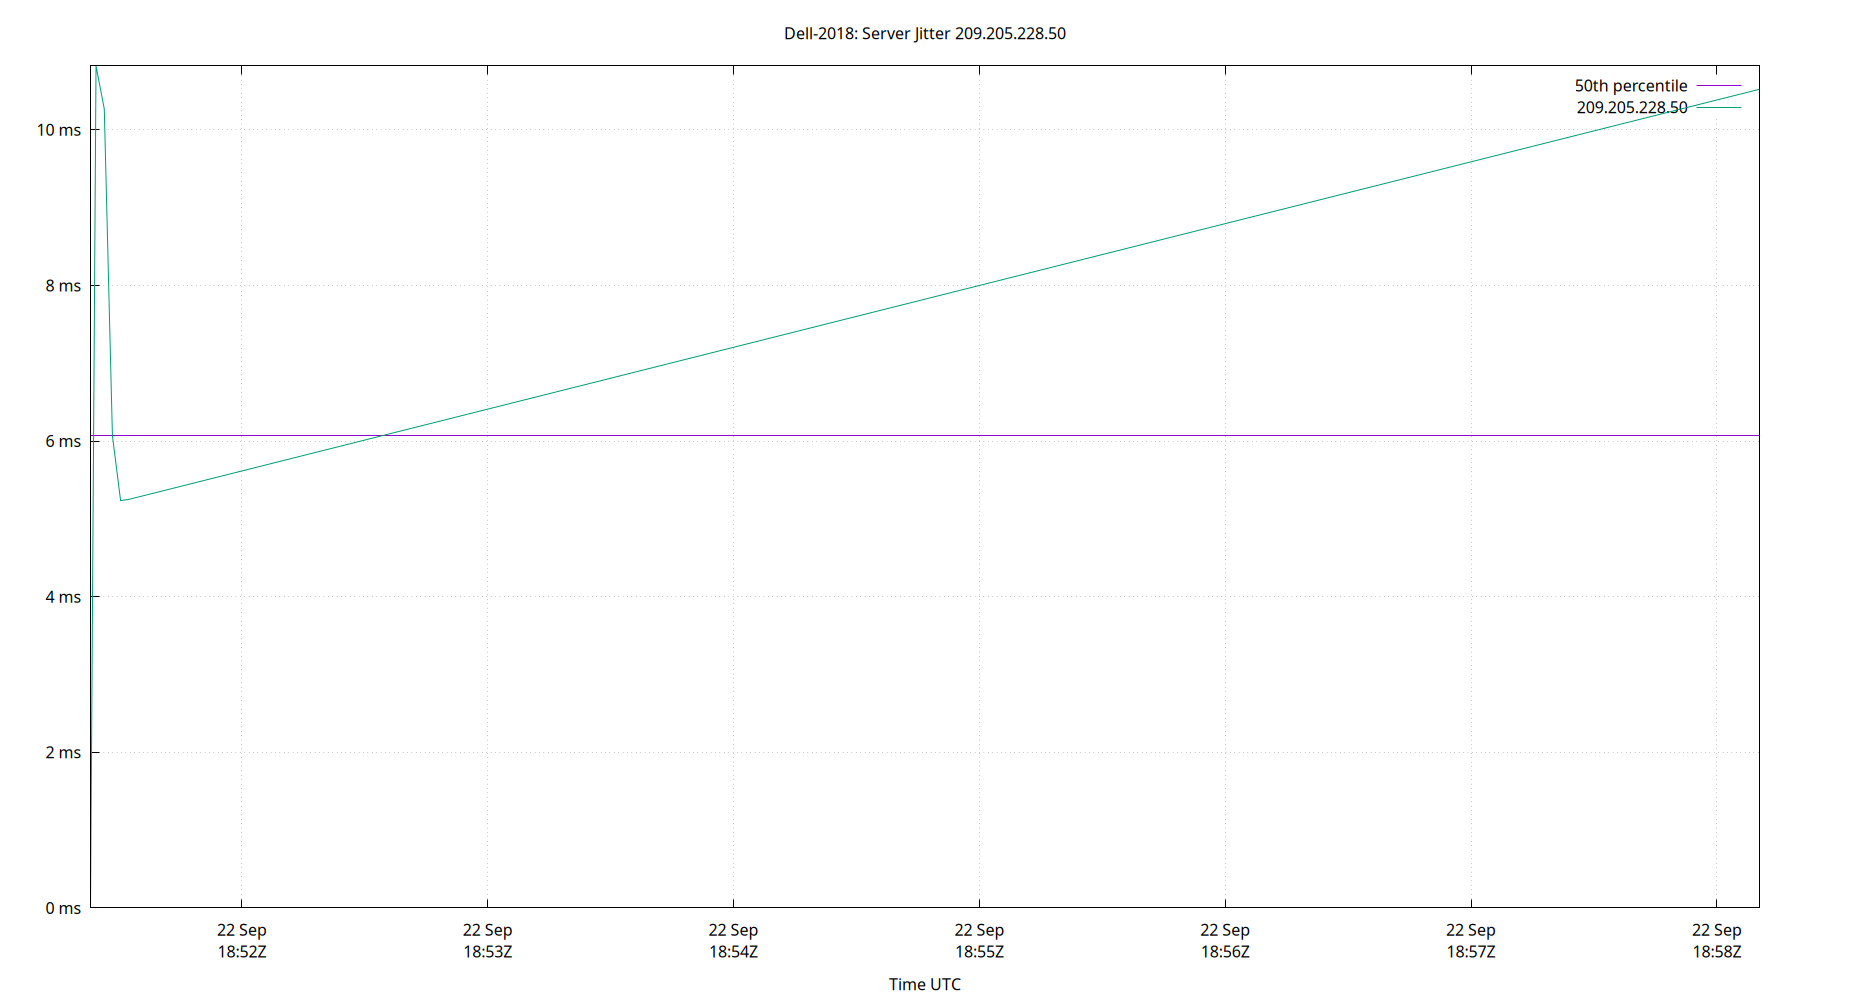
| Percentiles...... | Ranges...... | Skew- | Kurt- | |||||||||||||
| Name | Min | 1% | 5% | 50% | 95% | 99% | Max | 90% | 98% | StdDev | Mean | Units | ness | osis | ||
| Server Jitter 209.205.228.50 | 0.000 | 0.000 | 0.000 | 6.067 | 10.822 | 10.822 | 10.822 | 10.822 | 10.822 | 3.658 | 6.881 | ms | -0.5453 | 2.24 | ||
The RMS Jitter of a server. Jitter is the current estimated dispersion, in other words the variation in offset between samples.
Closer to 0s is better. An ideal system would be a horizontal line at 0s.
RMS Jitter is field 8 in the peerstats log file.
Server Jitter 209.253.210.112
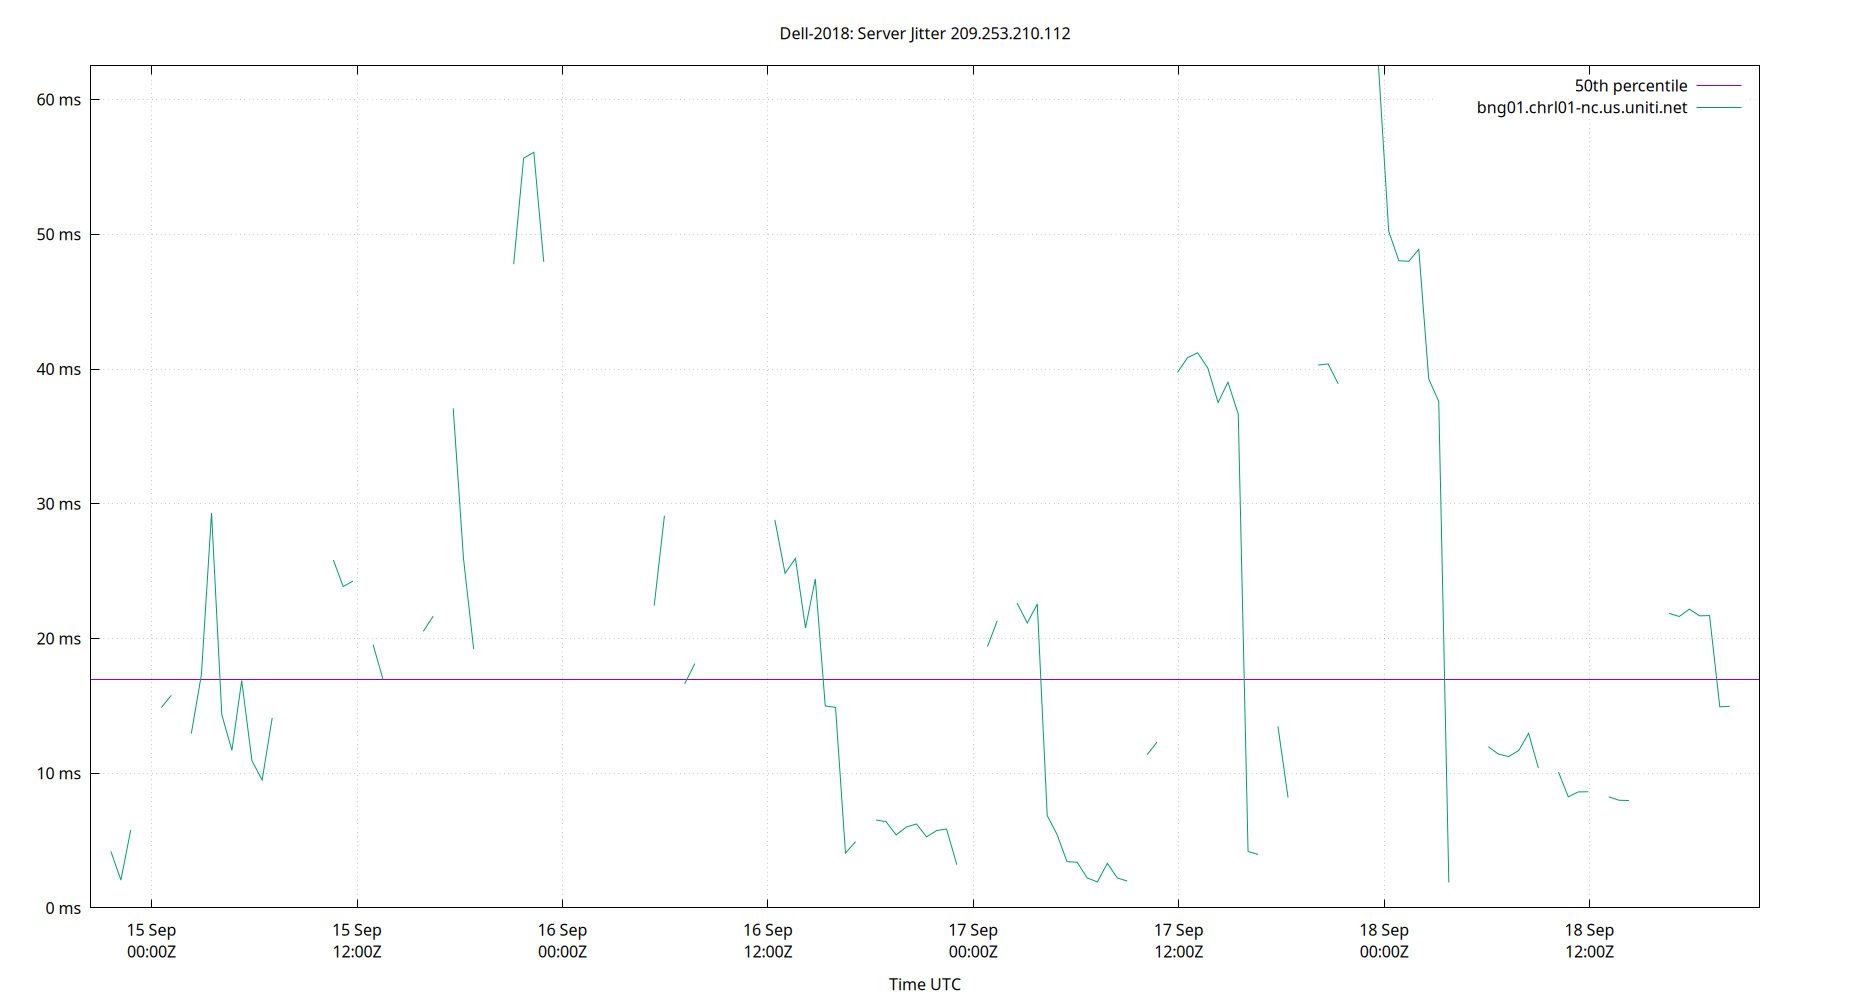
| Percentiles...... | Ranges...... | Skew- | Kurt- | |||||||||||||
| Name | Min | 1% | 5% | 50% | 95% | 99% | Max | 90% | 98% | StdDev | Mean | Units | ness | osis | ||
| Server Jitter 209.253.210.112 | 0.000 | 1.893 | 2.233 | 18.138 | 48.038 | 56.088 | 62.499 | 45.805 | 54.195 | 14.503 | 20.120 | ms | 0.811 | 2.847 | ||
The RMS Jitter of a server. Jitter is the current estimated dispersion, in other words the variation in offset between samples.
Closer to 0s is better. An ideal system would be a horizontal line at 0s.
RMS Jitter is field 8 in the peerstats log file.
Server Jitter 209.51.161.238
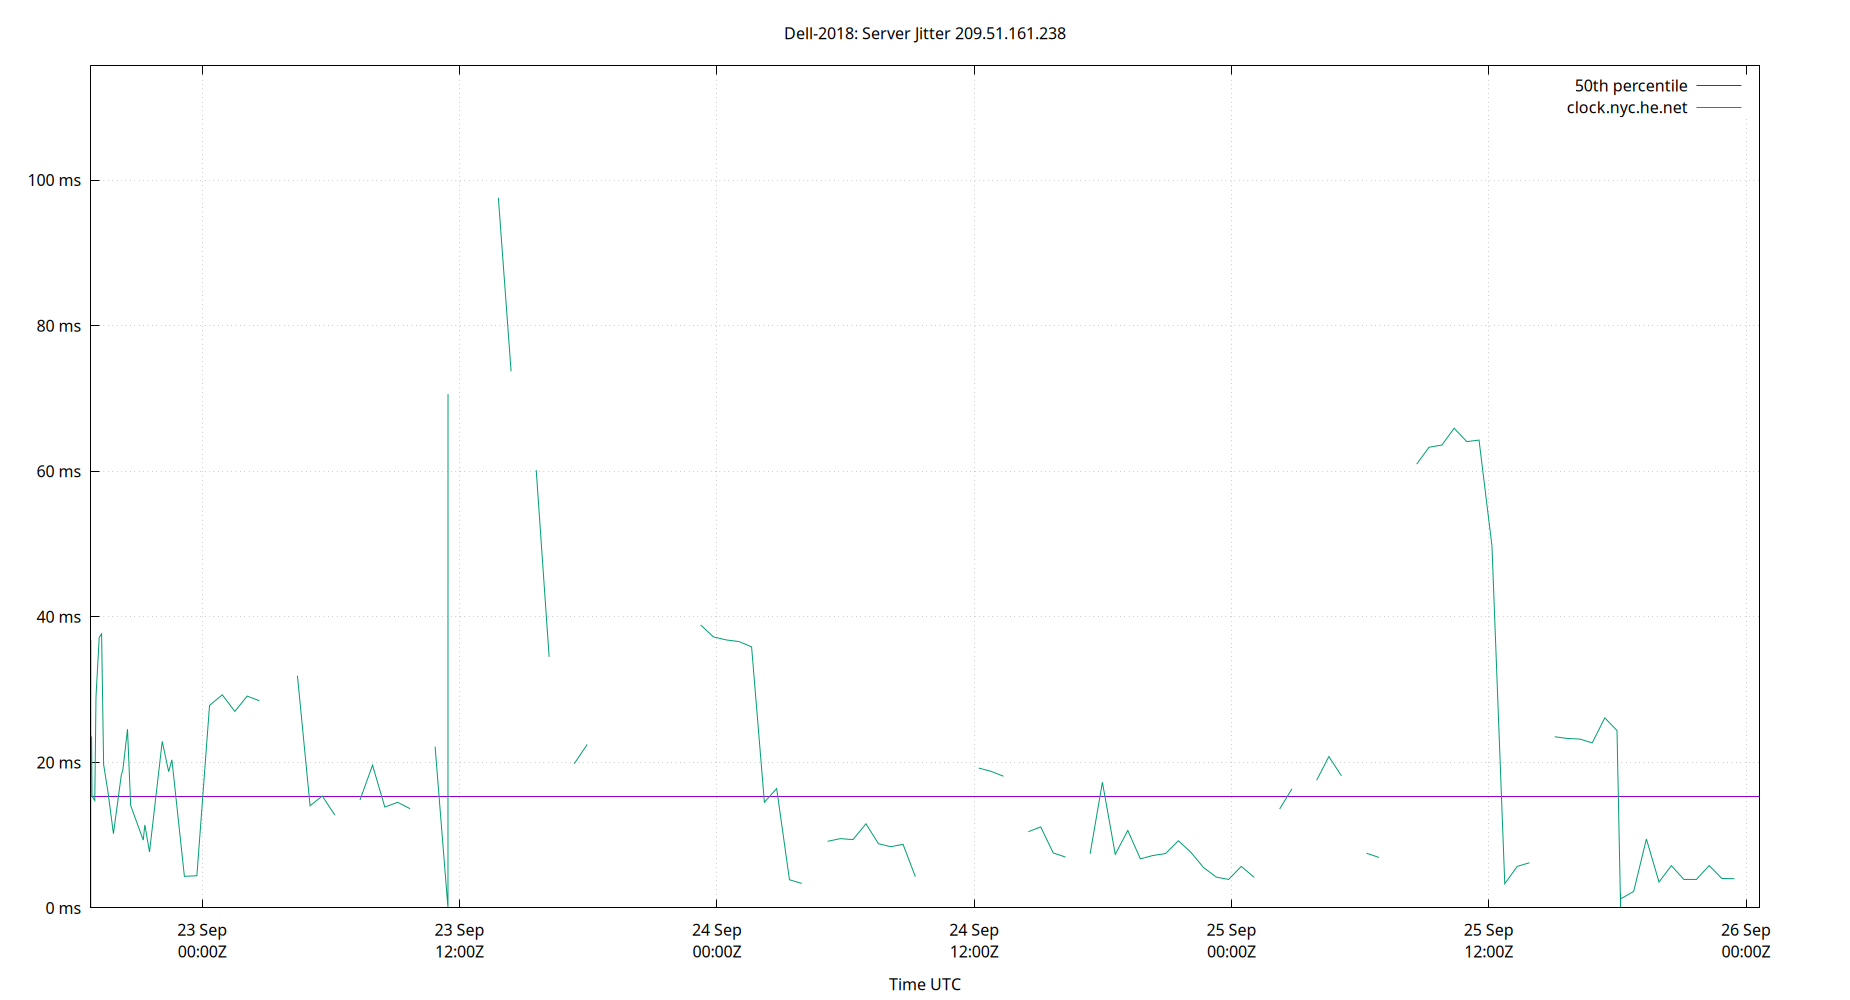
| Percentiles...... | Ranges...... | Skew- | Kurt- | |||||||||||||
| Name | Min | 1% | 5% | 50% | 95% | 99% | Max | 90% | 98% | StdDev | Mean | Units | ness | osis | ||
| Server Jitter 209.51.161.238 | 0.000 | 0.000 | 1.680 | 15.367 | 64.068 | 97.556 | 115.689 | 62.388 | 97.556 | 19.899 | 20.779 | ms | 1.928 | 7.566 | ||
The RMS Jitter of a server. Jitter is the current estimated dispersion, in other words the variation in offset between samples.
Closer to 0s is better. An ideal system would be a horizontal line at 0s.
RMS Jitter is field 8 in the peerstats log file.
Server Jitter 212.227.240.160

| Percentiles...... | Ranges...... | Skew- | Kurt- | |||||||||||||
| Name | Min | 1% | 5% | 50% | 95% | 99% | Max | 90% | 98% | StdDev | Mean | Units | ness | osis | ||
| Server Jitter 212.227.240.160 | 0.000 | 0.000 | 1.327 | 4.654 | 37.570 | 39.142 | 39.142 | 36.243 | 39.142 | 12.540 | 10.553 | ms | 1.465 | 3.395 | ||
The RMS Jitter of a server. Jitter is the current estimated dispersion, in other words the variation in offset between samples.
Closer to 0s is better. An ideal system would be a horizontal line at 0s.
RMS Jitter is field 8 in the peerstats log file.
Server Jitter 213.108.170.26
| Percentiles...... | Ranges...... | Skew- | Kurt- | |||||||||||||
| Name | Min | 1% | 5% | 50% | 95% | 99% | Max | 90% | 98% | StdDev | Mean | Units | ness | osis | ||
| Server Jitter 213.108.170.26 | 0.000 | 0.000 | 0.000 | 23.112 | 39.710 | 39.710 | 39.710 | 39.710 | 39.710 | 14.142 | 18.806 | ms | 0.06097 | 1.708 | ||
The RMS Jitter of a server. Jitter is the current estimated dispersion, in other words the variation in offset between samples.
Closer to 0s is better. An ideal system would be a horizontal line at 0s.
RMS Jitter is field 8 in the peerstats log file.
Server Jitter 216.229.0.50
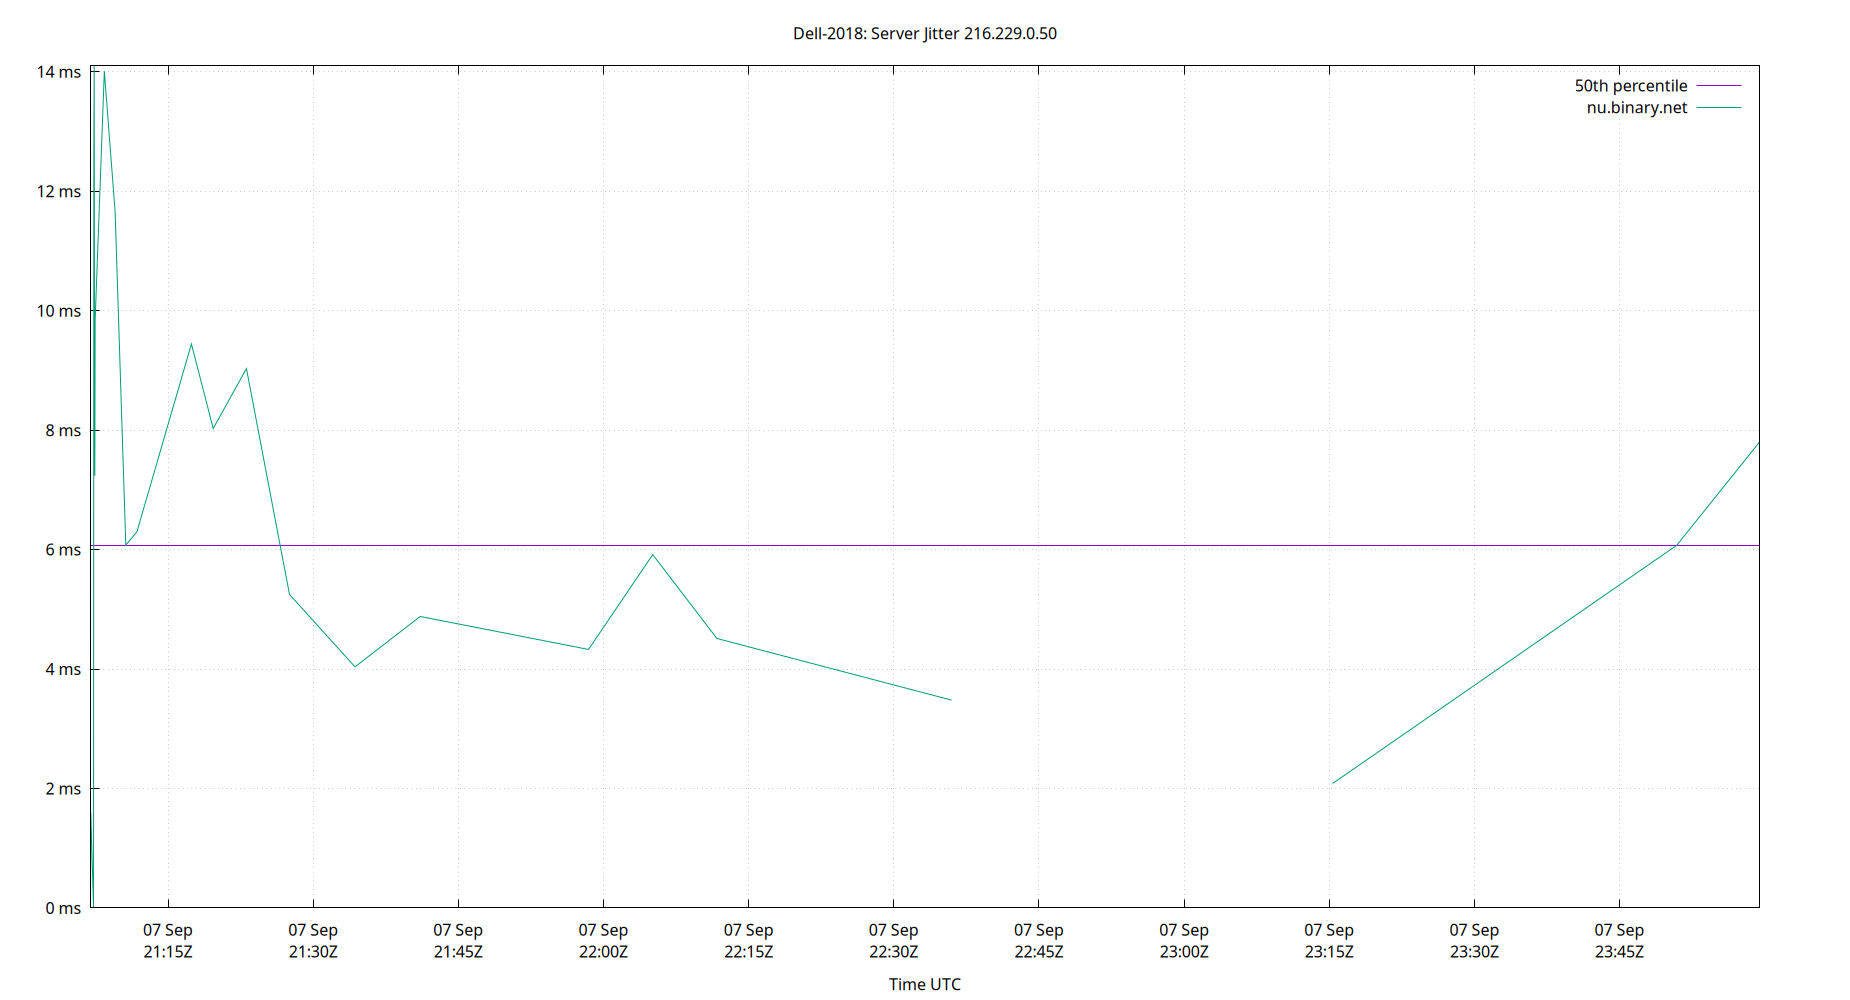
| Percentiles...... | Ranges...... | Skew- | Kurt- | |||||||||||||
| Name | Min | 1% | 5% | 50% | 95% | 99% | Max | 90% | 98% | StdDev | Mean | Units | ness | osis | ||
| Server Jitter 216.229.0.50 | 0.000 | 0.000 | 0.000 | 6.077 | 14.009 | 14.099 | 14.099 | 14.009 | 14.099 | 3.875 | 6.718 | ms | 0.1996 | 2.38 | ||
The RMS Jitter of a server. Jitter is the current estimated dispersion, in other words the variation in offset between samples.
Closer to 0s is better. An ideal system would be a horizontal line at 0s.
RMS Jitter is field 8 in the peerstats log file.
Server Jitter 216.229.4.66

| Percentiles...... | Ranges...... | Skew- | Kurt- | |||||||||||||
| Name | Min | 1% | 5% | 50% | 95% | 99% | Max | 90% | 98% | StdDev | Mean | Units | ness | osis | ||
| Server Jitter 216.229.4.66 | 0.000 | 0.000 | 0.992 | 3.058 | 10.014 | 18.864 | 19.868 | 9.021 | 18.864 | 3.422 | 3.917 | ms | 2.487 | 10.06 | ||
The RMS Jitter of a server. Jitter is the current estimated dispersion, in other words the variation in offset between samples.
Closer to 0s is better. An ideal system would be a horizontal line at 0s.
RMS Jitter is field 8 in the peerstats log file.
Server Jitter 216.250.115.174

| Percentiles...... | Ranges...... | Skew- | Kurt- | |||||||||||||
| Name | Min | 1% | 5% | 50% | 95% | 99% | Max | 90% | 98% | StdDev | Mean | Units | ness | osis | ||
| Server Jitter 216.250.115.174 | 0.000 | 0.000 | 1.073 | 19.436 | 53.936 | 81.386 | 83.847 | 52.863 | 81.386 | 17.176 | 23.147 | ms | 1.115 | 4.292 | ||
The RMS Jitter of a server. Jitter is the current estimated dispersion, in other words the variation in offset between samples.
Closer to 0s is better. An ideal system would be a horizontal line at 0s.
RMS Jitter is field 8 in the peerstats log file.
Server Jitter 216.66.48.42

| Percentiles...... | Ranges...... | Skew- | Kurt- | |||||||||||||
| Name | Min | 1% | 5% | 50% | 95% | 99% | Max | 90% | 98% | StdDev | Mean | Units | ness | osis | ||
| Server Jitter 216.66.48.42 | 0.000 | 0.000 | 2.641 | 25.978 | 59.408 | 65.378 | 72.744 | 56.767 | 65.378 | 15.554 | 27.857 | ms | 0.5488 | 2.961 | ||
The RMS Jitter of a server. Jitter is the current estimated dispersion, in other words the variation in offset between samples.
Closer to 0s is better. An ideal system would be a horizontal line at 0s.
RMS Jitter is field 8 in the peerstats log file.
Server Jitter 216.82.35.115

| Percentiles...... | Ranges...... | Skew- | Kurt- | |||||||||||||
| Name | Min | 1% | 5% | 50% | 95% | 99% | Max | 90% | 98% | StdDev | Mean | Units | ness | osis | ||
| Server Jitter 216.82.35.115 | 0.000 | 0.000 | 0.000 | 17.805 | 45.013 | 45.013 | 45.013 | 45.013 | 45.013 | 13.064 | 18.801 | ms | 0.1825 | 1.945 | ||
The RMS Jitter of a server. Jitter is the current estimated dispersion, in other words the variation in offset between samples.
Closer to 0s is better. An ideal system would be a horizontal line at 0s.
RMS Jitter is field 8 in the peerstats log file.
Server Jitter 217.197.83.230
| Percentiles...... | Ranges...... | Skew- | Kurt- | |||||||||||||
| Name | Min | 1% | 5% | 50% | 95% | 99% | Max | 90% | 98% | StdDev | Mean | Units | ness | osis | ||
| Server Jitter 217.197.83.230 | 0.000 | 0.000 | 4.956 | 46.750 | 84.140 | 255.815 | 572.672 | 79.184 | 255.815 | 48.779 | 49.959 | ms | 6.93 | 67.75 | ||
The RMS Jitter of a server. Jitter is the current estimated dispersion, in other words the variation in offset between samples.
Closer to 0s is better. An ideal system would be a horizontal line at 0s.
RMS Jitter is field 8 in the peerstats log file.
Server Jitter 23.111.186.186

| Percentiles...... | Ranges...... | Skew- | Kurt- | |||||||||||||
| Name | Min | 1% | 5% | 50% | 95% | 99% | Max | 90% | 98% | StdDev | Mean | Units | ness | osis | ||
| Server Jitter 23.111.186.186 | 0.000 | 0.000 | 0.000 | 1.132 | 1.974 | 1.974 | 1.974 | 1.974 | 1.974 | 0.537 | 1.129 | ms | -0.4905 | 3.028 | ||
The RMS Jitter of a server. Jitter is the current estimated dispersion, in other words the variation in offset between samples.
Closer to 0s is better. An ideal system would be a horizontal line at 0s.
RMS Jitter is field 8 in the peerstats log file.
Server Jitter 23.141.40.123

| Percentiles...... | Ranges...... | Skew- | Kurt- | |||||||||||||
| Name | Min | 1% | 5% | 50% | 95% | 99% | Max | 90% | 98% | StdDev | Mean | Units | ness | osis | ||
| Server Jitter 23.141.40.123 | 0.000 | 0.000 | 0.000 | 3.979 | 5.911 | 5.911 | 5.911 | 5.911 | 5.911 | 1.921 | 3.290 | ms | -0.4708 | 2.11 | ||
The RMS Jitter of a server. Jitter is the current estimated dispersion, in other words the variation in offset between samples.
Closer to 0s is better. An ideal system would be a horizontal line at 0s.
RMS Jitter is field 8 in the peerstats log file.
Server Jitter 23.142.248.8

| Percentiles...... | Ranges...... | Skew- | Kurt- | |||||||||||||
| Name | Min | 1% | 5% | 50% | 95% | 99% | Max | 90% | 98% | StdDev | Mean | Units | ness | osis | ||
| Server Jitter 23.142.248.8 | 0.000 | 0.697 | 1.158 | 4.634 | 17.883 | 23.569 | 194.491 | 16.725 | 22.872 | 8.013 | 6.998 | ms | 11.92 | 270.9 | ||
The RMS Jitter of a server. Jitter is the current estimated dispersion, in other words the variation in offset between samples.
Closer to 0s is better. An ideal system would be a horizontal line at 0s.
RMS Jitter is field 8 in the peerstats log file.
Server Jitter 23.142.248.9

| Percentiles...... | Ranges...... | Skew- | Kurt- | |||||||||||||
| Name | Min | 1% | 5% | 50% | 95% | 99% | Max | 90% | 98% | StdDev | Mean | Units | ness | osis | ||
| Server Jitter 23.142.248.9 | 0.000 | 0.000 | 0.000 | 2.025 | 187.757 | 223.573 | 223.573 | 187.757 | 223.573 | 59.842 | 25.642 | ms | 2.394 | 7.022 | ||
The RMS Jitter of a server. Jitter is the current estimated dispersion, in other words the variation in offset between samples.
Closer to 0s is better. An ideal system would be a horizontal line at 0s.
RMS Jitter is field 8 in the peerstats log file.
Server Jitter 23.143.196.199

| Percentiles...... | Ranges...... | Skew- | Kurt- | |||||||||||||
| Name | Min | 1% | 5% | 50% | 95% | 99% | Max | 90% | 98% | StdDev | Mean | Units | ness | osis | ||
| Server Jitter 23.143.196.199 | 0.000 | 0.000 | 0.000 | 1.033 | 2.250 | 2.250 | 2.250 | 2.250 | 2.250 | 0.756 | 1.094 | ms | -0.06783 | 1.795 | ||
The RMS Jitter of a server. Jitter is the current estimated dispersion, in other words the variation in offset between samples.
Closer to 0s is better. An ideal system would be a horizontal line at 0s.
RMS Jitter is field 8 in the peerstats log file.
Server Jitter 23.143.196.201
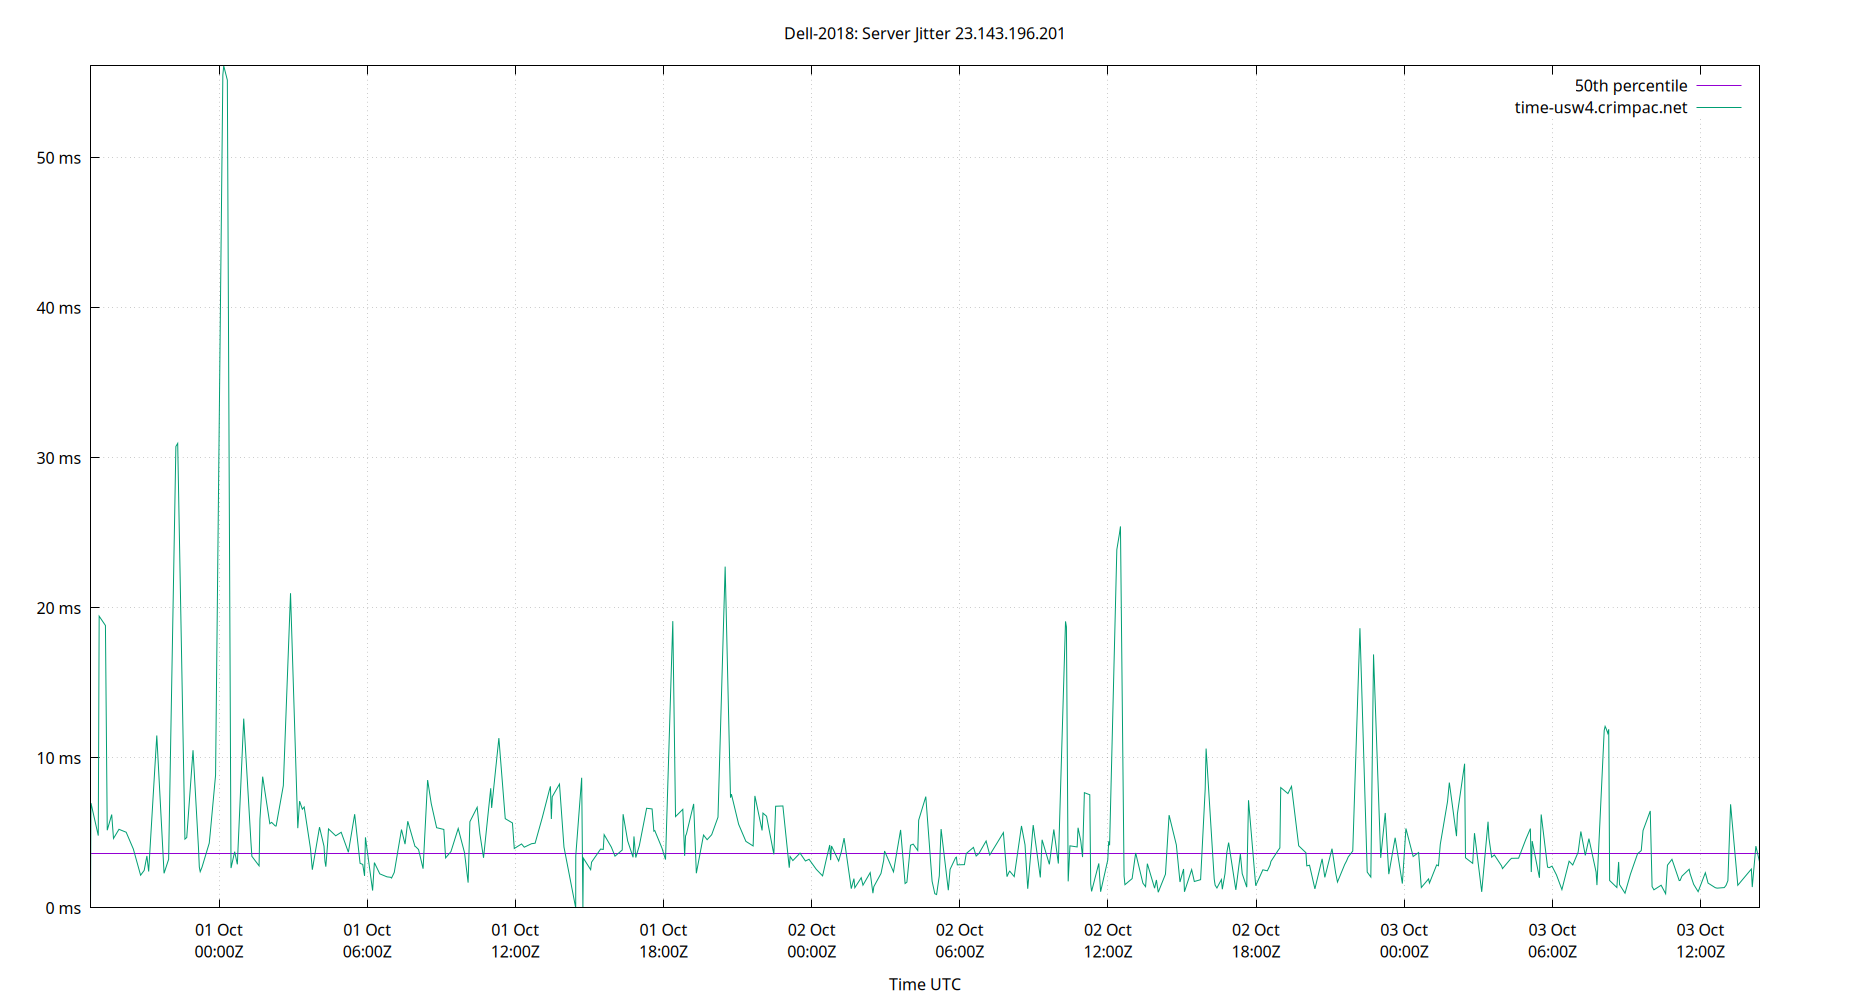
| Percentiles...... | Ranges...... | Skew- | Kurt- | |||||||||||||
| Name | Min | 1% | 5% | 50% | 95% | 99% | Max | 90% | 98% | StdDev | Mean | Units | ness | osis | ||
| Server Jitter 23.143.196.201 | 0.000 | 0.947 | 1.274 | 3.631 | 11.912 | 30.762 | 56.127 | 10.638 | 29.814 | 5.955 | 4.936 | ms | 5.525 | 42.13 | ||
The RMS Jitter of a server. Jitter is the current estimated dispersion, in other words the variation in offset between samples.
Closer to 0s is better. An ideal system would be a horizontal line at 0s.
RMS Jitter is field 8 in the peerstats log file.
Server Jitter 23.143.196.204
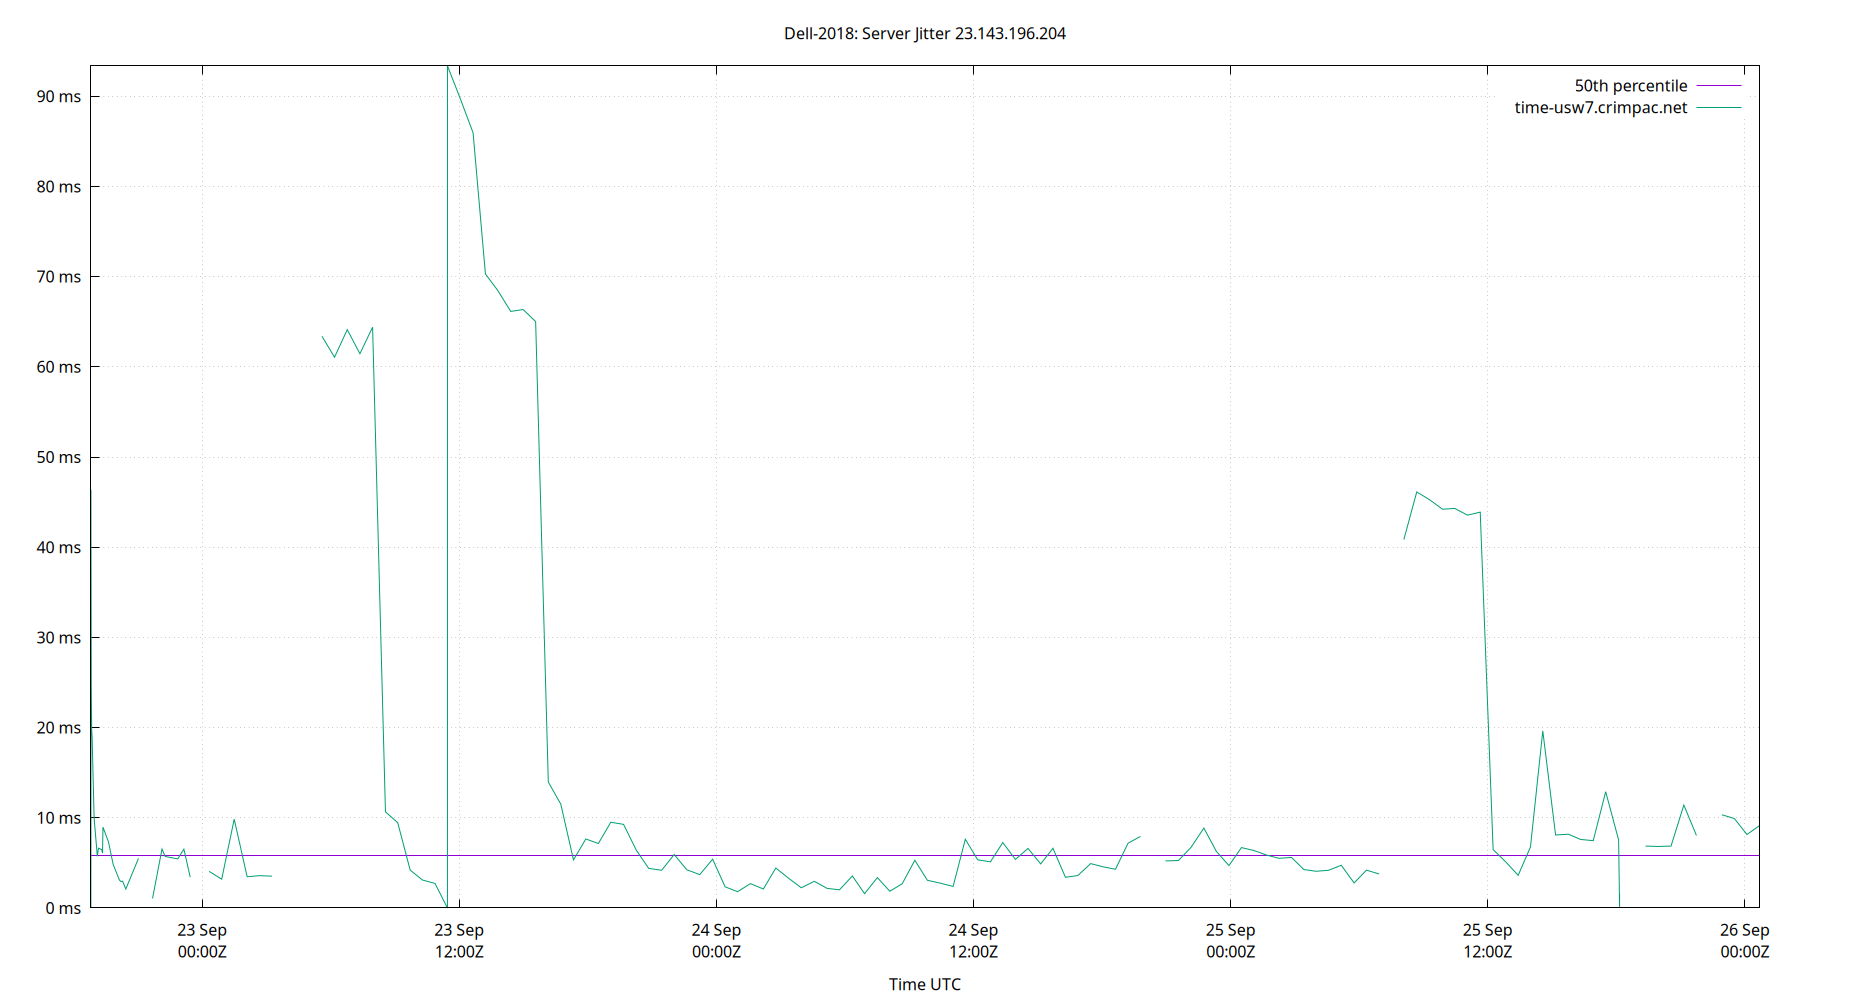
| Percentiles...... | Ranges...... | Skew- | Kurt- | |||||||||||||
| Name | Min | 1% | 5% | 50% | 95% | 99% | Max | 90% | 98% | StdDev | Mean | Units | ness | osis | ||
| Server Jitter 23.143.196.204 | 0.000 | 0.000 | 1.619 | 5.871 | 65.017 | 89.728 | 93.365 | 63.399 | 89.728 | 20.442 | 13.760 | ms | 2.255 | 6.963 | ||
The RMS Jitter of a server. Jitter is the current estimated dispersion, in other words the variation in offset between samples.
Closer to 0s is better. An ideal system would be a horizontal line at 0s.
RMS Jitter is field 8 in the peerstats log file.
Server Jitter 23.150.40.242

| Percentiles...... | Ranges...... | Skew- | Kurt- | |||||||||||||
| Name | Min | 1% | 5% | 50% | 95% | 99% | Max | 90% | 98% | StdDev | Mean | Units | ness | osis | ||
| Server Jitter 23.150.40.242 | 0.000 | 0.000 | 0.000 | 7.670 | 312.076 | 312.076 | 312.076 | 312.076 | 312.076 | 113.085 | 95.475 | ms | 0.6106 | 1.686 | ||
The RMS Jitter of a server. Jitter is the current estimated dispersion, in other words the variation in offset between samples.
Closer to 0s is better. An ideal system would be a horizontal line at 0s.
RMS Jitter is field 8 in the peerstats log file.
Server Jitter 23.150.41.122

| Percentiles...... | Ranges...... | Skew- | Kurt- | |||||||||||||
| Name | Min | 1% | 5% | 50% | 95% | 99% | Max | 90% | 98% | StdDev | Mean | Units | ness | osis | ||
| Server Jitter 23.150.41.122 | 0.000 | 0.796 | 1.190 | 3.307 | 13.542 | 32.912 | 36.946 | 12.352 | 32.116 | 4.892 | 4.685 | ms | 3.705 | 20.28 | ||
The RMS Jitter of a server. Jitter is the current estimated dispersion, in other words the variation in offset between samples.
Closer to 0s is better. An ideal system would be a horizontal line at 0s.
RMS Jitter is field 8 in the peerstats log file.
Server Jitter 23.150.41.123

| Percentiles...... | Ranges...... | Skew- | Kurt- | |||||||||||||
| Name | Min | 1% | 5% | 50% | 95% | 99% | Max | 90% | 98% | StdDev | Mean | Units | ness | osis | ||
| Server Jitter 23.150.41.123 | 0.000 | 0.009 | 1.435 | 5.520 | 30.447 | 57.773 | 89.122 | 29.012 | 57.764 | 11.424 | 10.055 | ms | 2.747 | 13.72 | ||
The RMS Jitter of a server. Jitter is the current estimated dispersion, in other words the variation in offset between samples.
Closer to 0s is better. An ideal system would be a horizontal line at 0s.
RMS Jitter is field 8 in the peerstats log file.
Server Jitter 23.155.40.38

| Percentiles...... | Ranges...... | Skew- | Kurt- | |||||||||||||
| Name | Min | 1% | 5% | 50% | 95% | 99% | Max | 90% | 98% | StdDev | Mean | Units | ness | osis | ||
| Server Jitter 23.155.40.38 | 0.000 | 0.000 | 1.128 | 3.297 | 25.833 | 117.881 | 142.893 | 24.705 | 117.881 | 18.570 | 8.072 | ms | 5.348 | 34.09 | ||
The RMS Jitter of a server. Jitter is the current estimated dispersion, in other words the variation in offset between samples.
Closer to 0s is better. An ideal system would be a horizontal line at 0s.
RMS Jitter is field 8 in the peerstats log file.
Server Jitter 23.155.72.147

| Percentiles...... | Ranges...... | Skew- | Kurt- | |||||||||||||
| Name | Min | 1% | 5% | 50% | 95% | 99% | Max | 90% | 98% | StdDev | Mean | Units | ness | osis | ||
| Server Jitter 23.155.72.147 | 0.000 | 0.000 | 1.155 | 3.406 | 36.728 | 38.286 | 43.030 | 35.574 | 38.286 | 9.343 | 6.981 | ms | 2.473 | 8.282 | ||
The RMS Jitter of a server. Jitter is the current estimated dispersion, in other words the variation in offset between samples.
Closer to 0s is better. An ideal system would be a horizontal line at 0s.
RMS Jitter is field 8 in the peerstats log file.
Server Jitter 23.157.100.123
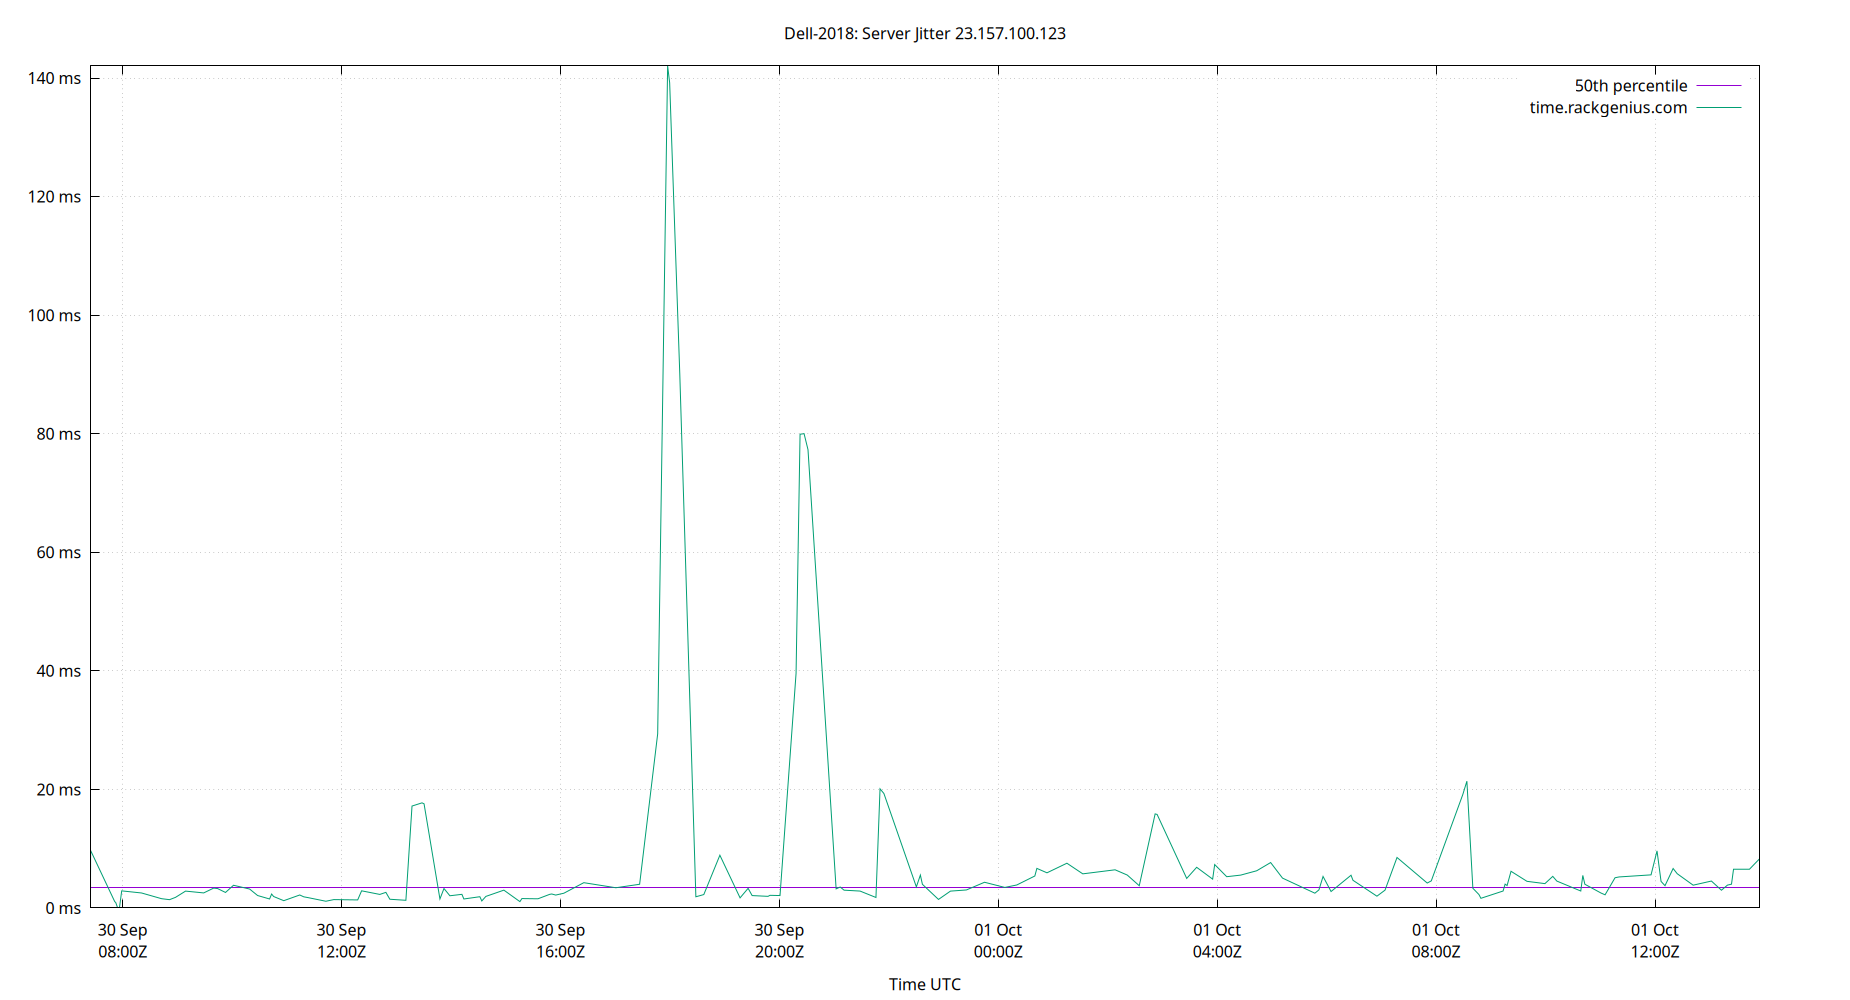
| Percentiles...... | Ranges...... | Skew- | Kurt- | |||||||||||||
| Name | Min | 1% | 5% | 50% | 95% | 99% | Max | 90% | 98% | StdDev | Mean | Units | ness | osis | ||
| Server Jitter 23.157.100.123 | 0.000 | 0.000 | 1.185 | 3.466 | 29.380 | 139.189 | 142.047 | 28.195 | 139.189 | 20.111 | 8.629 | ms | 4.929 | 28.67 | ||
The RMS Jitter of a server. Jitter is the current estimated dispersion, in other words the variation in offset between samples.
Closer to 0s is better. An ideal system would be a horizontal line at 0s.
RMS Jitter is field 8 in the peerstats log file.
Server Jitter 23.157.160.168

| Percentiles...... | Ranges...... | Skew- | Kurt- | |||||||||||||
| Name | Min | 1% | 5% | 50% | 95% | 99% | Max | 90% | 98% | StdDev | Mean | Units | ness | osis | ||
| Server Jitter 23.157.160.168 | 0.000 | 0.810 | 1.174 | 3.957 | 23.987 | 41.434 | 53.568 | 22.813 | 40.624 | 8.446 | 7.290 | ms | 2.463 | 9.675 | ||
The RMS Jitter of a server. Jitter is the current estimated dispersion, in other words the variation in offset between samples.
Closer to 0s is better. An ideal system would be a horizontal line at 0s.
RMS Jitter is field 8 in the peerstats log file.
Server Jitter 23.159.16.194

| Percentiles...... | Ranges...... | Skew- | Kurt- | |||||||||||||
| Name | Min | 1% | 5% | 50% | 95% | 99% | Max | 90% | 98% | StdDev | Mean | Units | ness | osis | ||
| Server Jitter 23.159.16.194 | 0.000 | 1.045 | 2.467 | 16.809 | 27.390 | 32.850 | 58.053 | 24.924 | 31.805 | 7.442 | 16.306 | ms | 0.07263 | 4.257 | ||
The RMS Jitter of a server. Jitter is the current estimated dispersion, in other words the variation in offset between samples.
Closer to 0s is better. An ideal system would be a horizontal line at 0s.
RMS Jitter is field 8 in the peerstats log file.
Server Jitter 23.161.104.133

| Percentiles...... | Ranges...... | Skew- | Kurt- | |||||||||||||
| Name | Min | 1% | 5% | 50% | 95% | 99% | Max | 90% | 98% | StdDev | Mean | Units | ness | osis | ||
| Server Jitter 23.161.104.133 | 0.000 | 0.000 | 11.096 | 45.164 | 77.776 | 95.911 | 152.099 | 66.680 | 95.911 | 19.945 | 45.733 | ms | 0.294 | 4.67 | ||
The RMS Jitter of a server. Jitter is the current estimated dispersion, in other words the variation in offset between samples.
Closer to 0s is better. An ideal system would be a horizontal line at 0s.
RMS Jitter is field 8 in the peerstats log file.
Server Jitter 23.168.24.210

| Percentiles...... | Ranges...... | Skew- | Kurt- | |||||||||||||
| Name | Min | 1% | 5% | 50% | 95% | 99% | Max | 90% | 98% | StdDev | Mean | Units | ness | osis | ||
| Server Jitter 23.168.24.210 | 0.000 | 0.000 | 1.329 | 6.287 | 36.844 | 40.675 | 48.121 | 35.515 | 40.675 | 10.711 | 11.315 | ms | 1.333 | 4.184 | ||
The RMS Jitter of a server. Jitter is the current estimated dispersion, in other words the variation in offset between samples.
Closer to 0s is better. An ideal system would be a horizontal line at 0s.
RMS Jitter is field 8 in the peerstats log file.
Server Jitter 23.172.120.58
| Percentiles...... | Ranges...... | Skew- | Kurt- | |||||||||||||
| Name | Min | 1% | 5% | 50% | 95% | 99% | Max | 90% | 98% | StdDev | Mean | Units | ness | osis | ||
| Server Jitter 23.172.120.58 | 0.000 | 0.000 | 0.000 | 36.865 | 82.693 | 82.693 | 82.693 | 82.693 | 82.693 | 28.106 | 36.432 | ms | -0.003439 | 1.781 | ||
The RMS Jitter of a server. Jitter is the current estimated dispersion, in other words the variation in offset between samples.
Closer to 0s is better. An ideal system would be a horizontal line at 0s.
RMS Jitter is field 8 in the peerstats log file.
Server Jitter 23.186.168.123

| Percentiles...... | Ranges...... | Skew- | Kurt- | |||||||||||||
| Name | Min | 1% | 5% | 50% | 95% | 99% | Max | 90% | 98% | StdDev | Mean | Units | ness | osis | ||
| Server Jitter 23.186.168.123 | 0.000 | 0.768 | 1.169 | 3.370 | 13.260 | 22.807 | 113.039 | 12.091 | 22.039 | 5.636 | 4.767 | ms | 7.959 | 113.9 | ||
The RMS Jitter of a server. Jitter is the current estimated dispersion, in other words the variation in offset between samples.
Closer to 0s is better. An ideal system would be a horizontal line at 0s.
RMS Jitter is field 8 in the peerstats log file.
Server Jitter 23.186.168.124

| Percentiles...... | Ranges...... | Skew- | Kurt- | |||||||||||||
| Name | Min | 1% | 5% | 50% | 95% | 99% | Max | 90% | 98% | StdDev | Mean | Units | ness | osis | ||
| Server Jitter 23.186.168.124 | 0.000 | 0.892 | 1.418 | 4.435 | 8.722 | 18.808 | 19.308 | 7.305 | 17.916 | 3.049 | 4.889 | ms | 2.312 | 11.25 | ||
The RMS Jitter of a server. Jitter is the current estimated dispersion, in other words the variation in offset between samples.
Closer to 0s is better. An ideal system would be a horizontal line at 0s.
RMS Jitter is field 8 in the peerstats log file.
Server Jitter 23.186.168.125

| Percentiles...... | Ranges...... | Skew- | Kurt- | |||||||||||||
| Name | Min | 1% | 5% | 50% | 95% | 99% | Max | 90% | 98% | StdDev | Mean | Units | ness | osis | ||
| Server Jitter 23.186.168.125 | 0.000 | 0.751 | 1.211 | 3.565 | 12.663 | 22.694 | 103.846 | 11.453 | 21.942 | 4.992 | 4.802 | ms | 6.042 | 72.89 | ||
The RMS Jitter of a server. Jitter is the current estimated dispersion, in other words the variation in offset between samples.
Closer to 0s is better. An ideal system would be a horizontal line at 0s.
RMS Jitter is field 8 in the peerstats log file.
Server Jitter 23.186.168.126

| Percentiles...... | Ranges...... | Skew- | Kurt- | |||||||||||||
| Name | Min | 1% | 5% | 50% | 95% | 99% | Max | 90% | 98% | StdDev | Mean | Units | ness | osis | ||
| Server Jitter 23.186.168.126 | 0.000 | 0.000 | 1.234 | 3.537 | 11.616 | 69.160 | 106.510 | 10.382 | 69.160 | 9.898 | 5.244 | ms | 7.723 | 68.17 | ||
The RMS Jitter of a server. Jitter is the current estimated dispersion, in other words the variation in offset between samples.
Closer to 0s is better. An ideal system would be a horizontal line at 0s.
RMS Jitter is field 8 in the peerstats log file.
Server Jitter 23.186.168.127

| Percentiles...... | Ranges...... | Skew- | Kurt- | |||||||||||||
| Name | Min | 1% | 5% | 50% | 95% | 99% | Max | 90% | 98% | StdDev | Mean | Units | ness | osis | ||
| Server Jitter 23.186.168.127 | 0.000 | 0.806 | 1.185 | 3.261 | 12.174 | 34.485 | 68.429 | 10.988 | 33.679 | 6.198 | 4.701 | ms | 5.297 | 38.76 | ||
The RMS Jitter of a server. Jitter is the current estimated dispersion, in other words the variation in offset between samples.
Closer to 0s is better. An ideal system would be a horizontal line at 0s.
RMS Jitter is field 8 in the peerstats log file.
Server Jitter 23.186.168.128

| Percentiles...... | Ranges...... | Skew- | Kurt- | |||||||||||||
| Name | Min | 1% | 5% | 50% | 95% | 99% | Max | 90% | 98% | StdDev | Mean | Units | ness | osis | ||
| Server Jitter 23.186.168.128 | 0.000 | 0.000 | 1.026 | 3.387 | 13.509 | 75.954 | 160.767 | 12.483 | 75.954 | 12.677 | 5.698 | ms | 8.692 | 89.98 | ||
The RMS Jitter of a server. Jitter is the current estimated dispersion, in other words the variation in offset between samples.
Closer to 0s is better. An ideal system would be a horizontal line at 0s.
RMS Jitter is field 8 in the peerstats log file.
Server Jitter 23.186.168.129

| Percentiles...... | Ranges...... | Skew- | Kurt- | |||||||||||||
| Name | Min | 1% | 5% | 50% | 95% | 99% | Max | 90% | 98% | StdDev | Mean | Units | ness | osis | ||
| Server Jitter 23.186.168.129 | 0.000 | 0.000 | 1.314 | 3.634 | 11.765 | 82.480 | 281.407 | 10.451 | 82.480 | 14.206 | 5.835 | ms | 10.45 | 138.7 | ||
The RMS Jitter of a server. Jitter is the current estimated dispersion, in other words the variation in offset between samples.
Closer to 0s is better. An ideal system would be a horizontal line at 0s.
RMS Jitter is field 8 in the peerstats log file.
Server Jitter 23.186.168.130

| Percentiles...... | Ranges...... | Skew- | Kurt- | |||||||||||||
| Name | Min | 1% | 5% | 50% | 95% | 99% | Max | 90% | 98% | StdDev | Mean | Units | ness | osis | ||
| Server Jitter 23.186.168.130 | 0.000 | 0.000 | 1.145 | 3.203 | 14.747 | 65.293 | 73.994 | 13.602 | 65.293 | 8.665 | 5.087 | ms | 5.7 | 39.24 | ||
The RMS Jitter of a server. Jitter is the current estimated dispersion, in other words the variation in offset between samples.
Closer to 0s is better. An ideal system would be a horizontal line at 0s.
RMS Jitter is field 8 in the peerstats log file.
Server Jitter 23.186.168.131

| Percentiles...... | Ranges...... | Skew- | Kurt- | |||||||||||||
| Name | Min | 1% | 5% | 50% | 95% | 99% | Max | 90% | 98% | StdDev | Mean | Units | ness | osis | ||
| Server Jitter 23.186.168.131 | 0.000 | 0.000 | 1.503 | 5.139 | 49.244 | 94.071 | 100.094 | 47.740 | 94.071 | 18.147 | 10.984 | ms | 3.177 | 12.72 | ||
The RMS Jitter of a server. Jitter is the current estimated dispersion, in other words the variation in offset between samples.
Closer to 0s is better. An ideal system would be a horizontal line at 0s.
RMS Jitter is field 8 in the peerstats log file.
Server Jitter 23.186.168.132

| Percentiles...... | Ranges...... | Skew- | Kurt- | |||||||||||||
| Name | Min | 1% | 5% | 50% | 95% | 99% | Max | 90% | 98% | StdDev | Mean | Units | ness | osis | ||
| Server Jitter 23.186.168.132 | 0.000 | 0.768 | 1.232 | 3.180 | 8.166 | 19.139 | 28.348 | 6.934 | 18.371 | 3.378 | 3.859 | ms | 4.121 | 25.48 | ||
The RMS Jitter of a server. Jitter is the current estimated dispersion, in other words the variation in offset between samples.
Closer to 0s is better. An ideal system would be a horizontal line at 0s.
RMS Jitter is field 8 in the peerstats log file.
Server Jitter 23.186.168.133

| Percentiles...... | Ranges...... | Skew- | Kurt- | |||||||||||||
| Name | Min | 1% | 5% | 50% | 95% | 99% | Max | 90% | 98% | StdDev | Mean | Units | ness | osis | ||
| Server Jitter 23.186.168.133 | 0.000 | 1.512 | 1.823 | 5.300 | 16.896 | 23.032 | 23.906 | 15.073 | 21.520 | 4.392 | 6.131 | ms | 2.111 | 8.042 | ||
The RMS Jitter of a server. Jitter is the current estimated dispersion, in other words the variation in offset between samples.
Closer to 0s is better. An ideal system would be a horizontal line at 0s.
RMS Jitter is field 8 in the peerstats log file.
Server Jitter 23.93.251.54
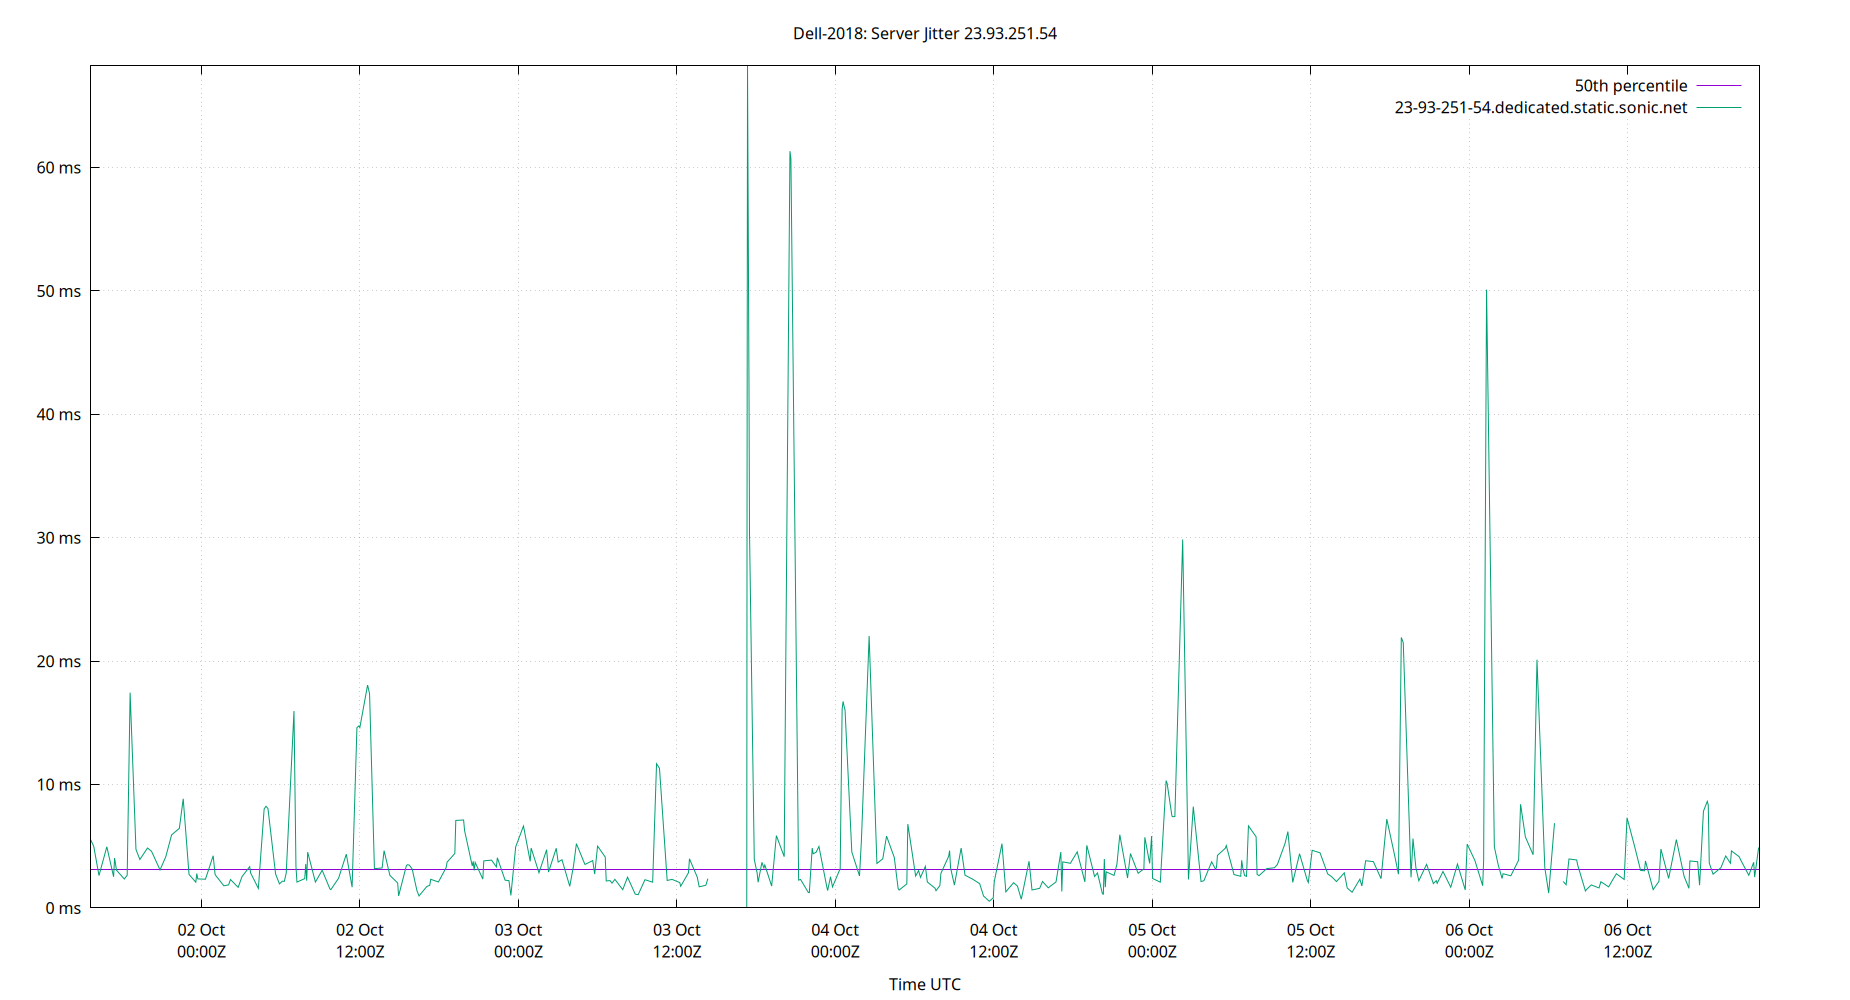
| Percentiles...... | Ranges...... | Skew- | Kurt- | |||||||||||||
| Name | Min | 1% | 5% | 50% | 95% | 99% | Max | 90% | 98% | StdDev | Mean | Units | ness | osis | ||
| Server Jitter 23.93.251.54 | 0.000 | 0.606 | 1.336 | 3.156 | 16.052 | 50.104 | 68.236 | 14.716 | 49.497 | 7.284 | 4.836 | ms | 5.676 | 41.06 | ||
The RMS Jitter of a server. Jitter is the current estimated dispersion, in other words the variation in offset between samples.
Closer to 0s is better. An ideal system would be a horizontal line at 0s.
RMS Jitter is field 8 in the peerstats log file.
Server Jitter 23.95.35.34

| Percentiles...... | Ranges...... | Skew- | Kurt- | |||||||||||||
| Name | Min | 1% | 5% | 50% | 95% | 99% | Max | 90% | 98% | StdDev | Mean | Units | ness | osis | ||
| Server Jitter 23.95.35.34 | 0.000 | 0.829 | 1.232 | 4.064 | 17.053 | 36.772 | 53.916 | 15.821 | 35.942 | 6.495 | 5.868 | ms | 3.639 | 19.9 | ||
The RMS Jitter of a server. Jitter is the current estimated dispersion, in other words the variation in offset between samples.
Closer to 0s is better. An ideal system would be a horizontal line at 0s.
RMS Jitter is field 8 in the peerstats log file.
Server Jitter 23.95.49.216

| Percentiles...... | Ranges...... | Skew- | Kurt- | |||||||||||||
| Name | Min | 1% | 5% | 50% | 95% | 99% | Max | 90% | 98% | StdDev | Mean | Units | ness | osis | ||
| Server Jitter 23.95.49.216 | 0.000 | 0.000 | 0.000 | 1.232 | 2.989 | 2.989 | 2.989 | 2.989 | 2.989 | 0.868 | 1.357 | ms | 0.08276 | 2.173 | ||
The RMS Jitter of a server. Jitter is the current estimated dispersion, in other words the variation in offset between samples.
Closer to 0s is better. An ideal system would be a horizontal line at 0s.
RMS Jitter is field 8 in the peerstats log file.
Server Jitter 2401:c080:3000:2945:5400:4ff:fe69:f923 (ntpd-rs.sidnlabs.nl)

| Percentiles...... | Ranges...... | Skew- | Kurt- | |||||||||||||
| Name | Min | 1% | 5% | 50% | 95% | 99% | Max | 90% | 98% | StdDev | Mean | Units | ness | osis | ||
| Server Jitter 2401:c080:3000:2945:5400:4ff:fe69:f923 (ntpd-rs.sidnlabs.nl) | 0.000 | 1.826 | 4.716 | 29.461 | 72.915 | 89.395 | 159.685 | 68.200 | 87.569 | 21.838 | 33.133 | ms | 0.7116 | 3.169 | ||
The RMS Jitter of a server. Jitter is the current estimated dispersion, in other words the variation in offset between samples.
Closer to 0s is better. An ideal system would be a horizontal line at 0s.
RMS Jitter is field 8 in the peerstats log file.
Server Jitter 2402:1f00:8101:d6::1

| Percentiles...... | Ranges...... | Skew- | Kurt- | |||||||||||||
| Name | Min | 1% | 5% | 50% | 95% | 99% | Max | 90% | 98% | StdDev | Mean | Units | ness | osis | ||
| Server Jitter 2402:1f00:8101:d6::1 | 0.000 | 1.122 | 1.876 | 18.931 | 65.466 | 79.704 | 169.795 | 63.590 | 78.581 | 21.450 | 25.074 | ms | 1.025 | 4.123 | ||
The RMS Jitter of a server. Jitter is the current estimated dispersion, in other words the variation in offset between samples.
Closer to 0s is better. An ideal system would be a horizontal line at 0s.
RMS Jitter is field 8 in the peerstats log file.
Server Jitter 240b:4004:108:200:8314:1a08:4cee:26d8

| Percentiles...... | Ranges...... | Skew- | Kurt- | |||||||||||||
| Name | Min | 1% | 5% | 50% | 95% | 99% | Max | 90% | 98% | StdDev | Mean | Units | ness | osis | ||
| Server Jitter 240b:4004:108:200:8314:1a08:4cee:26d8 | 0.000 | 0.000 | 0.000 | 3.953 | 46.649 | 52.232 | 52.232 | 46.649 | 52.232 | 15.473 | 10.747 | ms | 1.58 | 4.101 | ||
The RMS Jitter of a server. Jitter is the current estimated dispersion, in other words the variation in offset between samples.
Closer to 0s is better. An ideal system would be a horizontal line at 0s.
RMS Jitter is field 8 in the peerstats log file.
Server Jitter 240b:4004:108:200:8314:1a08:4cee:26d9

| Percentiles...... | Ranges...... | Skew- | Kurt- | |||||||||||||
| Name | Min | 1% | 5% | 50% | 95% | 99% | Max | 90% | 98% | StdDev | Mean | Units | ness | osis | ||
| Server Jitter 240b:4004:108:200:8314:1a08:4cee:26d9 | 0.000 | 0.000 | 0.000 | 19.678 | 21.828 | 21.828 | 21.828 | 21.828 | 21.828 | 8.593 | 13.132 | ms | -0.5264 | 1.711 | ||
The RMS Jitter of a server. Jitter is the current estimated dispersion, in other words the variation in offset between samples.
Closer to 0s is better. An ideal system would be a horizontal line at 0s.
RMS Jitter is field 8 in the peerstats log file.
Server Jitter 240b:4004:108:200:8314:1a08:4cee:2acf

| Percentiles...... | Ranges...... | Skew- | Kurt- | |||||||||||||
| Name | Min | 1% | 5% | 50% | 95% | 99% | Max | 90% | 98% | StdDev | Mean | Units | ness | osis | ||
| Server Jitter 240b:4004:108:200:8314:1a08:4cee:2acf | 0.000 | 0.000 | 0.000 | 1.911 | 56.765 | 56.765 | 56.765 | 56.765 | 56.765 | 17.704 | 9.838 | ms | 2.016 | 5.544 | ||
The RMS Jitter of a server. Jitter is the current estimated dispersion, in other words the variation in offset between samples.
Closer to 0s is better. An ideal system would be a horizontal line at 0s.
RMS Jitter is field 8 in the peerstats log file.
Server Jitter 2600:1702:80c0:9a80:1ee4:b0a2:44bc:c606

| Percentiles...... | Ranges...... | Skew- | Kurt- | |||||||||||||
| Name | Min | 1% | 5% | 50% | 95% | 99% | Max | 90% | 98% | StdDev | Mean | Units | ness | osis | ||
| Server Jitter 2600:1702:80c0:9a80:1ee4:b0a2:44bc:c606 | 0.000 | 0.000 | 0.000 | 5.087 | 22.009 | 22.009 | 22.009 | 22.009 | 22.009 | 8.471 | 7.694 | ms | 0.9852 | 2.224 | ||
The RMS Jitter of a server. Jitter is the current estimated dispersion, in other words the variation in offset between samples.
Closer to 0s is better. An ideal system would be a horizontal line at 0s.
RMS Jitter is field 8 in the peerstats log file.
Server Jitter 2600:1900:4060:2e7:: (0.0.0.0.0.0.0.0.0.0.0.0.0.0.0.0.7.e.2.0.0.6.0.4.0.0.9.1.0.0.6.2.bc.googleusercontent.com)

| Percentiles...... | Ranges...... | Skew- | Kurt- | |||||||||||||
| Name | Min | 1% | 5% | 50% | 95% | 99% | Max | 90% | 98% | StdDev | Mean | Units | ness | osis | ||
| Server Jitter 2600:1900:4060:2e7:: (0.0.0.0.0.0.0.0.0.0.0.0.0.0.0.0.7.e.2.0.0.6.0.4.0.0.9.1.0.0.6.2.bc.googleusercontent.com) | 0.000 | 1.432 | 2.735 | 23.981 | 80.125 | 100.086 | 260.324 | 77.390 | 98.655 | 25.098 | 30.934 | ms | 1.012 | 4.009 | ||
The RMS Jitter of a server. Jitter is the current estimated dispersion, in other words the variation in offset between samples.
Closer to 0s is better. An ideal system would be a horizontal line at 0s.
RMS Jitter is field 8 in the peerstats log file.
Server Jitter 2600:1f13:2c1:2e00::be00:5

| Percentiles...... | Ranges...... | Skew- | Kurt- | |||||||||||||
| Name | Min | 1% | 5% | 50% | 95% | 99% | Max | 90% | 98% | StdDev | Mean | Units | ness | osis | ||
| Server Jitter 2600:1f13:2c1:2e00::be00:5 | 0.000 | 0.000 | 0.000 | 2.102 | 15.060 | 15.060 | 15.060 | 15.060 | 15.060 | 4.508 | 4.272 | ms | 1.493 | 3.915 | ||
The RMS Jitter of a server. Jitter is the current estimated dispersion, in other words the variation in offset between samples.
Closer to 0s is better. An ideal system would be a horizontal line at 0s.
RMS Jitter is field 8 in the peerstats log file.
Server Jitter 2600:1f13:eda:9800:bcd8:839c:9b40:25b2 (oregon.time.system76.com)

| Percentiles...... | Ranges...... | Skew- | Kurt- | |||||||||||||
| Name | Min | 1% | 5% | 50% | 95% | 99% | Max | 90% | 98% | StdDev | Mean | Units | ness | osis | ||
| Server Jitter 2600:1f13:eda:9800:bcd8:839c:9b40:25b2 (oregon.time.system76.com) | 0.000 | 0.823 | 1.165 | 3.318 | 22.269 | 50.170 | 185.361 | 21.104 | 49.347 | 10.019 | 6.281 | ms | 5.659 | 54.72 | ||
The RMS Jitter of a server. Jitter is the current estimated dispersion, in other words the variation in offset between samples.
Closer to 0s is better. An ideal system would be a horizontal line at 0s.
RMS Jitter is field 8 in the peerstats log file.
Server Jitter 2600:1f16:42a:1d00:2169:fe07:2acc:6002 (ohio.time.system76.com)

| Percentiles...... | Ranges...... | Skew- | Kurt- | |||||||||||||
| Name | Min | 1% | 5% | 50% | 95% | 99% | Max | 90% | 98% | StdDev | Mean | Units | ness | osis | ||
| Server Jitter 2600:1f16:42a:1d00:2169:fe07:2acc:6002 (ohio.time.system76.com) | 0.000 | 0.830 | 1.200 | 3.525 | 39.618 | 69.663 | 282.893 | 38.418 | 68.833 | 14.537 | 9.155 | ms | 4.102 | 32.37 | ||
The RMS Jitter of a server. Jitter is the current estimated dispersion, in other words the variation in offset between samples.
Closer to 0s is better. An ideal system would be a horizontal line at 0s.
RMS Jitter is field 8 in the peerstats log file.
Server Jitter 2600:1f18:4c51:e200:e142:210a:306d:4872 (virginia.time.system76.com)

| Percentiles...... | Ranges...... | Skew- | Kurt- | |||||||||||||
| Name | Min | 1% | 5% | 50% | 95% | 99% | Max | 90% | 98% | StdDev | Mean | Units | ness | osis | ||
| Server Jitter 2600:1f18:4c51:e200:e142:210a:306d:4872 (virginia.time.system76.com) | 0.000 | 0.835 | 1.260 | 7.006 | 52.457 | 78.690 | 168.874 | 51.197 | 77.855 | 17.492 | 14.301 | ms | 2.254 | 9.588 | ||
The RMS Jitter of a server. Jitter is the current estimated dispersion, in other words the variation in offset between samples.
Closer to 0s is better. An ideal system would be a horizontal line at 0s.
RMS Jitter is field 8 in the peerstats log file.
Server Jitter 2600:1f18:7927:8b00:123::

| Percentiles...... | Ranges...... | Skew- | Kurt- | |||||||||||||
| Name | Min | 1% | 5% | 50% | 95% | 99% | Max | 90% | 98% | StdDev | Mean | Units | ness | osis | ||
| Server Jitter 2600:1f18:7927:8b00:123:: | 0.000 | 0.000 | 0.000 | 0.873 | 2.440 | 2.440 | 2.440 | 2.440 | 2.440 | 0.788 | 1.166 | ms | 0.2839 | 1.935 | ||
The RMS Jitter of a server. Jitter is the current estimated dispersion, in other words the variation in offset between samples.
Closer to 0s is better. An ideal system would be a horizontal line at 0s.
RMS Jitter is field 8 in the peerstats log file.
Server Jitter 2600:3c00:e000:318::1 (jane.qotw.net)

| Percentiles...... | Ranges...... | Skew- | Kurt- | |||||||||||||
| Name | Min | 1% | 5% | 50% | 95% | 99% | Max | 90% | 98% | StdDev | Mean | Units | ness | osis | ||
| Server Jitter 2600:3c00:e000:318::1 (jane.qotw.net) | 0.000 | 0.000 | 0.000 | 2.575 | 8.084 | 8.084 | 8.084 | 8.084 | 8.084 | 2.699 | 3.189 | ms | 0.7252 | 2.226 | ||
The RMS Jitter of a server. Jitter is the current estimated dispersion, in other words the variation in offset between samples.
Closer to 0s is better. An ideal system would be a horizontal line at 0s.
RMS Jitter is field 8 in the peerstats log file.
Server Jitter 2600:3c01::f03c:93ff:fe5b:8a7d (us-west-1.clearnet.pw)

| Percentiles...... | Ranges...... | Skew- | Kurt- | |||||||||||||
| Name | Min | 1% | 5% | 50% | 95% | 99% | Max | 90% | 98% | StdDev | Mean | Units | ness | osis | ||
| Server Jitter 2600:3c01::f03c:93ff:fe5b:8a7d (us-west-1.clearnet.pw) | 0.000 | 0.000 | 0.000 | 6.110 | 10.609 | 10.609 | 10.609 | 10.609 | 10.609 | 3.299 | 4.985 | ms | 0.1951 | 2.331 | ||
The RMS Jitter of a server. Jitter is the current estimated dispersion, in other words the variation in offset between samples.
Closer to 0s is better. An ideal system would be a horizontal line at 0s.
RMS Jitter is field 8 in the peerstats log file.
Server Jitter 2600:3c01::f03c:93ff:fedd:5a1f (sensei.ruselabs.com)

| Percentiles...... | Ranges...... | Skew- | Kurt- | |||||||||||||
| Name | Min | 1% | 5% | 50% | 95% | 99% | Max | 90% | 98% | StdDev | Mean | Units | ness | osis | ||
| Server Jitter 2600:3c01::f03c:93ff:fedd:5a1f (sensei.ruselabs.com) | 0.000 | 0.000 | 0.000 | 7.022 | 69.185 | 74.278 | 74.278 | 69.185 | 74.278 | 19.927 | 15.358 | ms | 1.999 | 5.824 | ||
The RMS Jitter of a server. Jitter is the current estimated dispersion, in other words the variation in offset between samples.
Closer to 0s is better. An ideal system would be a horizontal line at 0s.
RMS Jitter is field 8 in the peerstats log file.
Server Jitter 2600:3c01:e000:7e6::123 (time1.sigi.net)

| Percentiles...... | Ranges...... | Skew- | Kurt- | |||||||||||||
| Name | Min | 1% | 5% | 50% | 95% | 99% | Max | 90% | 98% | StdDev | Mean | Units | ness | osis | ||
| Server Jitter 2600:3c01:e000:7e6::123 (time1.sigi.net) | 0.000 | 0.000 | 0.000 | 2.687 | 8.376 | 8.381 | 8.381 | 8.376 | 8.381 | 2.133 | 3.108 | ms | 1.166 | 3.985 | ||
The RMS Jitter of a server. Jitter is the current estimated dispersion, in other words the variation in offset between samples.
Closer to 0s is better. An ideal system would be a horizontal line at 0s.
RMS Jitter is field 8 in the peerstats log file.
Server Jitter 2600:3c02::f03c:94ff:fe59:f411

| Percentiles...... | Ranges...... | Skew- | Kurt- | |||||||||||||
| Name | Min | 1% | 5% | 50% | 95% | 99% | Max | 90% | 98% | StdDev | Mean | Units | ness | osis | ||
| Server Jitter 2600:3c02::f03c:94ff:fe59:f411 | 0.000 | 0.000 | 0.000 | 5.394 | 7.516 | 7.516 | 7.516 | 7.516 | 7.516 | 2.647 | 4.557 | ms | -0.5602 | 1.96 | ||
The RMS Jitter of a server. Jitter is the current estimated dispersion, in other words the variation in offset between samples.
Closer to 0s is better. An ideal system would be a horizontal line at 0s.
RMS Jitter is field 8 in the peerstats log file.
Server Jitter 2600:3c03::f03c:91ff:fedf:1e98 (li1.forfun.net)

| Percentiles...... | Ranges...... | Skew- | Kurt- | |||||||||||||
| Name | Min | 1% | 5% | 50% | 95% | 99% | Max | 90% | 98% | StdDev | Mean | Units | ness | osis | ||
| Server Jitter 2600:3c03::f03c:91ff:fedf:1e98 (li1.forfun.net) | 0.000 | 0.000 | 0.000 | 11.029 | 94.476 | 94.476 | 94.476 | 94.476 | 94.476 | 27.639 | 20.489 | ms | 1.645 | 4.285 | ||
The RMS Jitter of a server. Jitter is the current estimated dispersion, in other words the variation in offset between samples.
Closer to 0s is better. An ideal system would be a horizontal line at 0s.
RMS Jitter is field 8 in the peerstats log file.
Server Jitter 2600:3c06::f03c:94ff:fee2:9c28

| Percentiles...... | Ranges...... | Skew- | Kurt- | |||||||||||||
| Name | Min | 1% | 5% | 50% | 95% | 99% | Max | 90% | 98% | StdDev | Mean | Units | ness | osis | ||
| Server Jitter 2600:3c06::f03c:94ff:fee2:9c28 | 0.000 | 0.000 | 0.000 | 9.325 | 30.736 | 30.736 | 30.736 | 30.736 | 30.736 | 11.553 | 11.593 | ms | 0.8589 | 2.149 | ||
The RMS Jitter of a server. Jitter is the current estimated dispersion, in other words the variation in offset between samples.
Closer to 0s is better. An ideal system would be a horizontal line at 0s.
RMS Jitter is field 8 in the peerstats log file.
Server Jitter 2600:3c06::f03c:94ff:fee2:c53a

| Percentiles...... | Ranges...... | Skew- | Kurt- | |||||||||||||
| Name | Min | 1% | 5% | 50% | 95% | 99% | Max | 90% | 98% | StdDev | Mean | Units | ness | osis | ||
| Server Jitter 2600:3c06::f03c:94ff:fee2:c53a | 0.000 | 0.000 | 0.000 | 15.615 | 24.117 | 24.117 | 24.117 | 24.117 | 24.117 | 9.987 | 13.244 | ms | -0.3427 | 1.5 | ||
The RMS Jitter of a server. Jitter is the current estimated dispersion, in other words the variation in offset between samples.
Closer to 0s is better. An ideal system would be a horizontal line at 0s.
RMS Jitter is field 8 in the peerstats log file.
Server Jitter 2602:2b7:d11:f4::122 (s2-b.time.mci1.us.rozint.net)

| Percentiles...... | Ranges...... | Skew- | Kurt- | |||||||||||||
| Name | Min | 1% | 5% | 50% | 95% | 99% | Max | 90% | 98% | StdDev | Mean | Units | ness | osis | ||
| Server Jitter 2602:2b7:d11:f4::122 (s2-b.time.mci1.us.rozint.net) | 0.000 | 0.000 | 0.000 | 3.886 | 12.153 | 12.153 | 12.153 | 12.153 | 12.153 | 3.374 | 4.505 | ms | 0.7652 | 3.068 | ||
The RMS Jitter of a server. Jitter is the current estimated dispersion, in other words the variation in offset between samples.
Closer to 0s is better. An ideal system would be a horizontal line at 0s.
RMS Jitter is field 8 in the peerstats log file.
Server Jitter 2602:80b:5000::36 (time.meme.holdings)

| Percentiles...... | Ranges...... | Skew- | Kurt- | |||||||||||||
| Name | Min | 1% | 5% | 50% | 95% | 99% | Max | 90% | 98% | StdDev | Mean | Units | ness | osis | ||
| Server Jitter 2602:80b:5000::36 (time.meme.holdings) | 0.000 | 0.000 | 4.621 | 20.856 | 76.477 | 84.174 | 87.838 | 71.856 | 84.174 | 21.252 | 27.684 | ms | 0.9659 | 3.216 | ||
The RMS Jitter of a server. Jitter is the current estimated dispersion, in other words the variation in offset between samples.
Closer to 0s is better. An ideal system would be a horizontal line at 0s.
RMS Jitter is field 8 in the peerstats log file.
Server Jitter 2602:81b:9000::c10c (time.sea.ordinaladvisors.com)

| Percentiles...... | Ranges...... | Skew- | Kurt- | |||||||||||||
| Name | Min | 1% | 5% | 50% | 95% | 99% | Max | 90% | 98% | StdDev | Mean | Units | ness | osis | ||
| Server Jitter 2602:81b:9000::c10c (time.sea.ordinaladvisors.com) | 0.000 | 0.000 | 0.000 | 3.625 | 9.349 | 9.349 | 9.349 | 9.349 | 9.349 | 2.588 | 4.147 | ms | 0.2659 | 2.467 | ||
The RMS Jitter of a server. Jitter is the current estimated dispersion, in other words the variation in offset between samples.
Closer to 0s is better. An ideal system would be a horizontal line at 0s.
RMS Jitter is field 8 in the peerstats log file.
Server Jitter 2602:f590::23:161:104:133 (isere.sd.ysun.co)

| Percentiles...... | Ranges...... | Skew- | Kurt- | |||||||||||||
| Name | Min | 1% | 5% | 50% | 95% | 99% | Max | 90% | 98% | StdDev | Mean | Units | ness | osis | ||
| Server Jitter 2602:f590::23:161:104:133 (isere.sd.ysun.co) | 0.000 | 0.000 | 7.038 | 40.173 | 63.744 | 78.005 | 83.945 | 56.706 | 78.005 | 17.076 | 39.669 | ms | -0.2518 | 2.788 | ||
The RMS Jitter of a server. Jitter is the current estimated dispersion, in other words the variation in offset between samples.
Closer to 0s is better. An ideal system would be a horizontal line at 0s.
RMS Jitter is field 8 in the peerstats log file.
Server Jitter 2602:f9ba:69::210 (as393746.mci.trtnw.net)

| Percentiles...... | Ranges...... | Skew- | Kurt- | |||||||||||||
| Name | Min | 1% | 5% | 50% | 95% | 99% | Max | 90% | 98% | StdDev | Mean | Units | ness | osis | ||
| Server Jitter 2602:f9ba:69::210 (as393746.mci.trtnw.net) | 0.000 | 0.000 | 1.448 | 9.790 | 67.645 | 87.579 | 97.607 | 66.198 | 87.579 | 21.576 | 19.008 | ms | 1.617 | 4.947 | ||
The RMS Jitter of a server. Jitter is the current estimated dispersion, in other words the variation in offset between samples.
Closer to 0s is better. An ideal system would be a horizontal line at 0s.
RMS Jitter is field 8 in the peerstats log file.
Server Jitter 2602:fb95:16::123 (time5.sigi.net)

| Percentiles...... | Ranges...... | Skew- | Kurt- | |||||||||||||
| Name | Min | 1% | 5% | 50% | 95% | 99% | Max | 90% | 98% | StdDev | Mean | Units | ness | osis | ||
| Server Jitter 2602:fb95:16::123 (time5.sigi.net) | 0.000 | 0.000 | 0.000 | 2.945 | 6.744 | 6.744 | 6.744 | 6.744 | 6.744 | 1.680 | 2.843 | ms | 0.7474 | 3.802 | ||
The RMS Jitter of a server. Jitter is the current estimated dispersion, in other words the variation in offset between samples.
Closer to 0s is better. An ideal system would be a horizontal line at 0s.
RMS Jitter is field 8 in the peerstats log file.
Server Jitter 2602:fd50:100:108:3491:d3b2:eef8:f324 (ntp.netlinkify.com)

| Percentiles...... | Ranges...... | Skew- | Kurt- | |||||||||||||
| Name | Min | 1% | 5% | 50% | 95% | 99% | Max | 90% | 98% | StdDev | Mean | Units | ness | osis | ||
| Server Jitter 2602:fd50:100:108:3491:d3b2:eef8:f324 (ntp.netlinkify.com) | 0.000 | 0.000 | 0.000 | 1.961 | 5.599 | 9.370 | 9.370 | 5.599 | 9.370 | 2.184 | 2.731 | ms | 1.202 | 4.547 | ||
The RMS Jitter of a server. Jitter is the current estimated dispersion, in other words the variation in offset between samples.
Closer to 0s is better. An ideal system would be a horizontal line at 0s.
RMS Jitter is field 8 in the peerstats log file.
Server Jitter 2602:fe2e:3:d:f9:c7ff:fef5:379c (ntp.ny1.neptunenetworks.net)

| Percentiles...... | Ranges...... | Skew- | Kurt- | |||||||||||||
| Name | Min | 1% | 5% | 50% | 95% | 99% | Max | 90% | 98% | StdDev | Mean | Units | ness | osis | ||
| Server Jitter 2602:fe2e:3:d:f9:c7ff:fef5:379c (ntp.ny1.neptunenetworks.net) | 0.000 | 0.000 | 0.000 | 2.011 | 3.424 | 3.424 | 3.424 | 3.424 | 3.424 | 0.929 | 1.786 | ms | -0.1796 | 2.962 | ||
The RMS Jitter of a server. Jitter is the current estimated dispersion, in other words the variation in offset between samples.
Closer to 0s is better. An ideal system would be a horizontal line at 0s.
RMS Jitter is field 8 in the peerstats log file.
Server Jitter 2603:c020:0:8369:1111:1111:1111:1112

| Percentiles...... | Ranges...... | Skew- | Kurt- | |||||||||||||
| Name | Min | 1% | 5% | 50% | 95% | 99% | Max | 90% | 98% | StdDev | Mean | Units | ness | osis | ||
| Server Jitter 2603:c020:0:8369:1111:1111:1111:1112 | 0.000 | 0.000 | 0.000 | 2.207 | 40.655 | 40.655 | 40.655 | 40.655 | 40.655 | 12.543 | 9.364 | ms | 1.256 | 3.23 | ||
The RMS Jitter of a server. Jitter is the current estimated dispersion, in other words the variation in offset between samples.
Closer to 0s is better. An ideal system would be a horizontal line at 0s.
RMS Jitter is field 8 in the peerstats log file.
Server Jitter 2603:c020:0:8369::bad:beef

| Percentiles...... | Ranges...... | Skew- | Kurt- | |||||||||||||
| Name | Min | 1% | 5% | 50% | 95% | 99% | Max | 90% | 98% | StdDev | Mean | Units | ness | osis | ||
| Server Jitter 2603:c020:0:8369::bad:beef | 0.000 | 0.000 | 0.000 | 3.940 | 3.991 | 3.991 | 3.991 | 3.991 | 3.991 | 1.645 | 2.811 | ms | -1.067 | 2.256 | ||
The RMS Jitter of a server. Jitter is the current estimated dispersion, in other words the variation in offset between samples.
Closer to 0s is better. An ideal system would be a horizontal line at 0s.
RMS Jitter is field 8 in the peerstats log file.
Server Jitter 2603:c020:0:8369:feed:feed:feed:feed

| Percentiles...... | Ranges...... | Skew- | Kurt- | |||||||||||||
| Name | Min | 1% | 5% | 50% | 95% | 99% | Max | 90% | 98% | StdDev | Mean | Units | ness | osis | ||
| Server Jitter 2603:c020:0:8369:feed:feed:feed:feed | 0.000 | 0.000 | 0.000 | 7.366 | 13.323 | 13.323 | 13.323 | 13.323 | 13.323 | 5.449 | 6.896 | ms | -0.1286 | 1.5 | ||
The RMS Jitter of a server. Jitter is the current estimated dispersion, in other words the variation in offset between samples.
Closer to 0s is better. An ideal system would be a horizontal line at 0s.
RMS Jitter is field 8 in the peerstats log file.
Server Jitter 2603:c024:c005:a600:efb6:d213:cad8:251d

| Percentiles...... | Ranges...... | Skew- | Kurt- | |||||||||||||
| Name | Min | 1% | 5% | 50% | 95% | 99% | Max | 90% | 98% | StdDev | Mean | Units | ness | osis | ||
| Server Jitter 2603:c024:c005:a600:efb6:d213:cad8:251d | 0.000 | 0.000 | 0.000 | 14.820 | 57.595 | 57.595 | 57.595 | 57.595 | 57.595 | 17.229 | 20.244 | ms | 1.209 | 3.457 | ||
The RMS Jitter of a server. Jitter is the current estimated dispersion, in other words the variation in offset between samples.
Closer to 0s is better. An ideal system would be a horizontal line at 0s.
RMS Jitter is field 8 in the peerstats log file.
Server Jitter 2604:8800:52:81:38:229:52:9 (ntp08.cymru.com)

| Percentiles...... | Ranges...... | Skew- | Kurt- | |||||||||||||
| Name | Min | 1% | 5% | 50% | 95% | 99% | Max | 90% | 98% | StdDev | Mean | Units | ness | osis | ||
| Server Jitter 2604:8800:52:81:38:229:52:9 (ntp08.cymru.com) | 0.000 | 0.000 | 0.000 | 21.487 | 31.405 | 31.405 | 31.405 | 31.405 | 31.405 | 13.108 | 17.631 | ms | -0.4158 | 1.5 | ||
The RMS Jitter of a server. Jitter is the current estimated dispersion, in other words the variation in offset between samples.
Closer to 0s is better. An ideal system would be a horizontal line at 0s.
RMS Jitter is field 8 in the peerstats log file.
Server Jitter 2604:a880:400:d0::4ed:f001 (unifi.versadns.com)

| Percentiles...... | Ranges...... | Skew- | Kurt- | |||||||||||||
| Name | Min | 1% | 5% | 50% | 95% | 99% | Max | 90% | 98% | StdDev | Mean | Units | ness | osis | ||
| Server Jitter 2604:a880:400:d0::4ed:f001 (unifi.versadns.com) | 0.000 | 0.000 | 0.000 | 11.421 | 25.574 | 25.574 | 25.574 | 25.574 | 25.574 | 7.238 | 12.934 | ms | -0.04102 | 2.807 | ||
The RMS Jitter of a server. Jitter is the current estimated dispersion, in other words the variation in offset between samples.
Closer to 0s is better. An ideal system would be a horizontal line at 0s.
RMS Jitter is field 8 in the peerstats log file.
Server Jitter 2604:a880:800:10::70f:b001 (ellone.fdisk.io)

| Percentiles...... | Ranges...... | Skew- | Kurt- | |||||||||||||
| Name | Min | 1% | 5% | 50% | 95% | 99% | Max | 90% | 98% | StdDev | Mean | Units | ness | osis | ||
| Server Jitter 2604:a880:800:10::70f:b001 (ellone.fdisk.io) | 0.000 | 0.000 | 0.000 | 1.765 | 3.857 | 3.857 | 3.857 | 3.857 | 3.857 | 1.036 | 1.790 | ms | 0.1052 | 2.65 | ||
The RMS Jitter of a server. Jitter is the current estimated dispersion, in other words the variation in offset between samples.
Closer to 0s is better. An ideal system would be a horizontal line at 0s.
RMS Jitter is field 8 in the peerstats log file.
Server Jitter 2604:a880:800:a1::ec9:5001

| Percentiles...... | Ranges...... | Skew- | Kurt- | |||||||||||||
| Name | Min | 1% | 5% | 50% | 95% | 99% | Max | 90% | 98% | StdDev | Mean | Units | ness | osis | ||
| Server Jitter 2604:a880:800:a1::ec9:5001 | 0.000 | 0.000 | 0.000 | 37.963 | 144.987 | 144.987 | 144.987 | 144.987 | 144.987 | 42.386 | 45.567 | ms | 0.8191 | 2.927 | ||
The RMS Jitter of a server. Jitter is the current estimated dispersion, in other words the variation in offset between samples.
Closer to 0s is better. An ideal system would be a horizontal line at 0s.
RMS Jitter is field 8 in the peerstats log file.
Server Jitter 2604:d200::39 (white.web-ster.com)

| Percentiles...... | Ranges...... | Skew- | Kurt- | |||||||||||||
| Name | Min | 1% | 5% | 50% | 95% | 99% | Max | 90% | 98% | StdDev | Mean | Units | ness | osis | ||
| Server Jitter 2604:d200::39 (white.web-ster.com) | 0.000 | 0.000 | 0.000 | 1.801 | 12.238 | 25.815 | 25.815 | 12.238 | 25.815 | 5.414 | 3.117 | ms | 3.361 | 13.81 | ||
The RMS Jitter of a server. Jitter is the current estimated dispersion, in other words the variation in offset between samples.
Closer to 0s is better. An ideal system would be a horizontal line at 0s.
RMS Jitter is field 8 in the peerstats log file.
Server Jitter 2605:4840:3:fb19::1 (chi3.us.ntp.li)

| Percentiles...... | Ranges...... | Skew- | Kurt- | |||||||||||||
| Name | Min | 1% | 5% | 50% | 95% | 99% | Max | 90% | 98% | StdDev | Mean | Units | ness | osis | ||
| Server Jitter 2605:4840:3:fb19::1 (chi3.us.ntp.li) | 0.000 | 0.000 | 0.000 | 3.562 | 6.209 | 6.209 | 6.209 | 6.209 | 6.209 | 2.544 | 3.257 | ms | -0.178 | 1.5 | ||
The RMS Jitter of a server. Jitter is the current estimated dispersion, in other words the variation in offset between samples.
Closer to 0s is better. An ideal system would be a horizontal line at 0s.
RMS Jitter is field 8 in the peerstats log file.
Server Jitter 2605:6400:488d:2eda:eee9:fe8d:4543:d471

| Percentiles...... | Ranges...... | Skew- | Kurt- | |||||||||||||
| Name | Min | 1% | 5% | 50% | 95% | 99% | Max | 90% | 98% | StdDev | Mean | Units | ness | osis | ||
| Server Jitter 2605:6400:488d:2eda:eee9:fe8d:4543:d471 | 0.000 | 0.000 | 0.000 | 0.000 | 0.000 | 0.000 | 0.000 | 0.000 | 0.000 | 0.000 | 0.000 | ns | nan | nan | ||
The RMS Jitter of a server. Jitter is the current estimated dispersion, in other words the variation in offset between samples.
Closer to 0s is better. An ideal system would be a horizontal line at 0s.
RMS Jitter is field 8 in the peerstats log file.
Server Jitter 2605:6400:488d:3686:546d:c03c:1689:20c

| Percentiles...... | Ranges...... | Skew- | Kurt- | |||||||||||||
| Name | Min | 1% | 5% | 50% | 95% | 99% | Max | 90% | 98% | StdDev | Mean | Units | ness | osis | ||
| Server Jitter 2605:6400:488d:3686:546d:c03c:1689:20c | 0.000 | 0.000 | 0.000 | 0.000 | 0.000 | 0.000 | 0.000 | 0.000 | 0.000 | 0.000 | 0.000 | ns | nan | nan | ||
The RMS Jitter of a server. Jitter is the current estimated dispersion, in other words the variation in offset between samples.
Closer to 0s is better. An ideal system would be a horizontal line at 0s.
RMS Jitter is field 8 in the peerstats log file.
Server Jitter 2605:6f01:2000:18::94ee:fcbe (vps-buf1.orleans.ddnss.de)

| Percentiles...... | Ranges...... | Skew- | Kurt- | |||||||||||||
| Name | Min | 1% | 5% | 50% | 95% | 99% | Max | 90% | 98% | StdDev | Mean | Units | ness | osis | ||
| Server Jitter 2605:6f01:2000:18::94ee:fcbe (vps-buf1.orleans.ddnss.de) | 0.000 | 0.000 | 0.000 | 3.793 | 7.878 | 7.878 | 7.878 | 7.878 | 7.878 | 2.024 | 4.070 | ms | 0.0771 | 3.251 | ||
The RMS Jitter of a server. Jitter is the current estimated dispersion, in other words the variation in offset between samples.
Closer to 0s is better. An ideal system would be a horizontal line at 0s.
RMS Jitter is field 8 in the peerstats log file.
Server Jitter 2606:4700:f1::1 (time.cloudflare.com)

| Percentiles...... | Ranges...... | Skew- | Kurt- | |||||||||||||
| Name | Min | 1% | 5% | 50% | 95% | 99% | Max | 90% | 98% | StdDev | Mean | Units | ness | osis | ||
| Server Jitter 2606:4700:f1::1 (time.cloudflare.com) | 0.000 | 0.821 | 1.167 | 3.388 | 21.569 | 51.700 | 196.069 | 20.402 | 50.879 | 9.851 | 6.217 | ms | 6.195 | 69.95 | ||
The RMS Jitter of a server. Jitter is the current estimated dispersion, in other words the variation in offset between samples.
Closer to 0s is better. An ideal system would be a horizontal line at 0s.
RMS Jitter is field 8 in the peerstats log file.
Server Jitter 2606:4700:f1::123 (time.cloudflare.com)

| Percentiles...... | Ranges...... | Skew- | Kurt- | |||||||||||||
| Name | Min | 1% | 5% | 50% | 95% | 99% | Max | 90% | 98% | StdDev | Mean | Units | ness | osis | ||
| Server Jitter 2606:4700:f1::123 (time.cloudflare.com) | 0.000 | 0.818 | 1.158 | 3.327 | 20.620 | 59.531 | 162.685 | 19.461 | 58.714 | 10.424 | 6.152 | ms | 5.858 | 51.75 | ||
The RMS Jitter of a server. Jitter is the current estimated dispersion, in other words the variation in offset between samples.
Closer to 0s is better. An ideal system would be a horizontal line at 0s.
RMS Jitter is field 8 in the peerstats log file.
Server Jitter 2606:82c0:21::e (time1.lshiy.com)

| Percentiles...... | Ranges...... | Skew- | Kurt- | |||||||||||||
| Name | Min | 1% | 5% | 50% | 95% | 99% | Max | 90% | 98% | StdDev | Mean | Units | ness | osis | ||
| Server Jitter 2606:82c0:21::e (time1.lshiy.com) | 0.000 | 0.000 | 0.000 | 1.883 | 3.565 | 3.565 | 3.565 | 3.565 | 3.565 | 1.027 | 1.940 | ms | -0.3172 | 2.792 | ||
The RMS Jitter of a server. Jitter is the current estimated dispersion, in other words the variation in offset between samples.
Closer to 0s is better. An ideal system would be a horizontal line at 0s.
RMS Jitter is field 8 in the peerstats log file.
Server Jitter 2606:82c0:22::e (time2.lshiy.com)

| Percentiles...... | Ranges...... | Skew- | Kurt- | |||||||||||||
| Name | Min | 1% | 5% | 50% | 95% | 99% | Max | 90% | 98% | StdDev | Mean | Units | ness | osis | ||
| Server Jitter 2606:82c0:22::e (time2.lshiy.com) | 0.000 | 0.000 | 0.000 | 24.326 | 24.843 | 24.843 | 24.843 | 24.843 | 24.843 | 11.591 | 16.390 | ms | -0.7061 | 1.5 | ||
The RMS Jitter of a server. Jitter is the current estimated dispersion, in other words the variation in offset between samples.
Closer to 0s is better. An ideal system would be a horizontal line at 0s.
RMS Jitter is field 8 in the peerstats log file.
Server Jitter 2606:82c0:23::e (time3.lshiy.com)

| Percentiles...... | Ranges...... | Skew- | Kurt- | |||||||||||||
| Name | Min | 1% | 5% | 50% | 95% | 99% | Max | 90% | 98% | StdDev | Mean | Units | ness | osis | ||
| Server Jitter 2606:82c0:23::e (time3.lshiy.com) | 0.000 | 0.000 | 0.000 | 3.337 | 8.248 | 8.248 | 8.248 | 8.248 | 8.248 | 2.270 | 3.415 | ms | 0.3181 | 2.67 | ||
The RMS Jitter of a server. Jitter is the current estimated dispersion, in other words the variation in offset between samples.
Closer to 0s is better. An ideal system would be a horizontal line at 0s.
RMS Jitter is field 8 in the peerstats log file.
Server Jitter 2607:7c80:54:3::32

| Percentiles...... | Ranges...... | Skew- | Kurt- | |||||||||||||
| Name | Min | 1% | 5% | 50% | 95% | 99% | Max | 90% | 98% | StdDev | Mean | Units | ness | osis | ||
| Server Jitter 2607:7c80:54:3::32 | 0.000 | 0.000 | 0.000 | 3.603 | 11.499 | 11.499 | 11.499 | 11.499 | 11.499 | 3.098 | 4.294 | ms | 1.035 | 3.383 | ||
The RMS Jitter of a server. Jitter is the current estimated dispersion, in other words the variation in offset between samples.
Closer to 0s is better. An ideal system would be a horizontal line at 0s.
RMS Jitter is field 8 in the peerstats log file.
Server Jitter 2607:9000:7000:23:216:3cff:fe25:38d7

| Percentiles...... | Ranges...... | Skew- | Kurt- | |||||||||||||
| Name | Min | 1% | 5% | 50% | 95% | 99% | Max | 90% | 98% | StdDev | Mean | Units | ness | osis | ||
| Server Jitter 2607:9000:7000:23:216:3cff:fe25:38d7 | 0.000 | 0.000 | 0.000 | 7.179 | 57.684 | 57.684 | 57.684 | 57.684 | 57.684 | 16.210 | 10.235 | ms | 2.43 | 7.385 | ||
The RMS Jitter of a server. Jitter is the current estimated dispersion, in other words the variation in offset between samples.
Closer to 0s is better. An ideal system would be a horizontal line at 0s.
RMS Jitter is field 8 in the peerstats log file.
Server Jitter 2607:9d00:2000:16::9269:208a (vps-lax1.orleans.ddnss.de)

| Percentiles...... | Ranges...... | Skew- | Kurt- | |||||||||||||
| Name | Min | 1% | 5% | 50% | 95% | 99% | Max | 90% | 98% | StdDev | Mean | Units | ness | osis | ||
| Server Jitter 2607:9d00:2000:16::9269:208a (vps-lax1.orleans.ddnss.de) | 0.000 | 0.000 | 0.000 | 3.585 | 32.658 | 32.768 | 32.768 | 32.658 | 32.768 | 8.863 | 6.355 | ms | 2.336 | 7.193 | ||
The RMS Jitter of a server. Jitter is the current estimated dispersion, in other words the variation in offset between samples.
Closer to 0s is better. An ideal system would be a horizontal line at 0s.
RMS Jitter is field 8 in the peerstats log file.
Server Jitter 2607:f1c0:f06b:5000::1 (ntp11.kernfusion.at)

| Percentiles...... | Ranges...... | Skew- | Kurt- | |||||||||||||
| Name | Min | 1% | 5% | 50% | 95% | 99% | Max | 90% | 98% | StdDev | Mean | Units | ness | osis | ||
| Server Jitter 2607:f1c0:f06b:5000::1 (ntp11.kernfusion.at) | 0.000 | 0.000 | 0.000 | 2.585 | 3.939 | 3.939 | 3.939 | 3.939 | 3.939 | 1.251 | 2.204 | ms | -0.4741 | 2.288 | ||
The RMS Jitter of a server. Jitter is the current estimated dispersion, in other words the variation in offset between samples.
Closer to 0s is better. An ideal system would be a horizontal line at 0s.
RMS Jitter is field 8 in the peerstats log file.
Server Jitter 2607:f1c0:f06b:5000::3 (ntp11.kernfusion.at)

| Percentiles...... | Ranges...... | Skew- | Kurt- | |||||||||||||
| Name | Min | 1% | 5% | 50% | 95% | 99% | Max | 90% | 98% | StdDev | Mean | Units | ness | osis | ||
| Server Jitter 2607:f1c0:f06b:5000::3 (ntp11.kernfusion.at) | 0.000 | 0.000 | 0.000 | 6.053 | 20.902 | 20.902 | 20.902 | 20.902 | 20.902 | 5.847 | 6.566 | ms | 1.063 | 3.708 | ||
The RMS Jitter of a server. Jitter is the current estimated dispersion, in other words the variation in offset between samples.
Closer to 0s is better. An ideal system would be a horizontal line at 0s.
RMS Jitter is field 8 in the peerstats log file.
Server Jitter 2607:f1c0:f06b:5000::4 (ntp11.kernfusion.at)

| Percentiles...... | Ranges...... | Skew- | Kurt- | |||||||||||||
| Name | Min | 1% | 5% | 50% | 95% | 99% | Max | 90% | 98% | StdDev | Mean | Units | ness | osis | ||
| Server Jitter 2607:f1c0:f06b:5000::4 (ntp11.kernfusion.at) | 0.000 | 0.000 | 0.000 | 3.713 | 17.103 | 17.166 | 17.166 | 17.103 | 17.166 | 4.236 | 4.518 | ms | 1.905 | 6.172 | ||
The RMS Jitter of a server. Jitter is the current estimated dispersion, in other words the variation in offset between samples.
Closer to 0s is better. An ideal system would be a horizontal line at 0s.
RMS Jitter is field 8 in the peerstats log file.
Server Jitter 2607:f1c0:f075:9900::1

| Percentiles...... | Ranges...... | Skew- | Kurt- | |||||||||||||
| Name | Min | 1% | 5% | 50% | 95% | 99% | Max | 90% | 98% | StdDev | Mean | Units | ness | osis | ||
| Server Jitter 2607:f1c0:f075:9900::1 | 0.000 | 0.000 | 0.000 | 3.194 | 62.537 | 70.431 | 70.431 | 62.537 | 70.431 | 17.930 | 9.867 | ms | 2.624 | 8.577 | ||
The RMS Jitter of a server. Jitter is the current estimated dispersion, in other words the variation in offset between samples.
Closer to 0s is better. An ideal system would be a horizontal line at 0s.
RMS Jitter is field 8 in the peerstats log file.
Server Jitter 2607:f298:5:101d:f816:3eff:fefd:8817

| Percentiles...... | Ranges...... | Skew- | Kurt- | |||||||||||||
| Name | Min | 1% | 5% | 50% | 95% | 99% | Max | 90% | 98% | StdDev | Mean | Units | ness | osis | ||
| Server Jitter 2607:f298:5:101d:f816:3eff:fefd:8817 | 0.000 | 0.000 | 0.000 | 2.720 | 5.235 | 5.235 | 5.235 | 5.235 | 5.235 | 1.474 | 2.934 | ms | -0.2774 | 2.751 | ||
The RMS Jitter of a server. Jitter is the current estimated dispersion, in other words the variation in offset between samples.
Closer to 0s is better. An ideal system would be a horizontal line at 0s.
RMS Jitter is field 8 in the peerstats log file.
Server Jitter 2607:f5b7:1:44::123 (ntp.wdc2.us.leaseweb.net)

| Percentiles...... | Ranges...... | Skew- | Kurt- | |||||||||||||
| Name | Min | 1% | 5% | 50% | 95% | 99% | Max | 90% | 98% | StdDev | Mean | Units | ness | osis | ||
| Server Jitter 2607:f5b7:1:44::123 (ntp.wdc2.us.leaseweb.net) | 0.000 | 0.000 | 0.000 | 22.421 | 42.881 | 42.881 | 42.881 | 42.881 | 42.881 | 15.424 | 20.144 | ms | 0.2368 | 1.91 | ||
The RMS Jitter of a server. Jitter is the current estimated dispersion, in other words the variation in offset between samples.
Closer to 0s is better. An ideal system would be a horizontal line at 0s.
RMS Jitter is field 8 in the peerstats log file.
Server Jitter 2607:f710:35::29c:0:5

| Percentiles...... | Ranges...... | Skew- | Kurt- | |||||||||||||
| Name | Min | 1% | 5% | 50% | 95% | 99% | Max | 90% | 98% | StdDev | Mean | Units | ness | osis | ||
| Server Jitter 2607:f710:35::29c:0:5 | 0.000 | 0.000 | 0.000 | 4.556 | 7.900 | 7.900 | 7.900 | 7.900 | 7.900 | 2.166 | 4.553 | ms | -0.3058 | 2.962 | ||
The RMS Jitter of a server. Jitter is the current estimated dispersion, in other words the variation in offset between samples.
Closer to 0s is better. An ideal system would be a horizontal line at 0s.
RMS Jitter is field 8 in the peerstats log file.
Server Jitter 2607:ff50:0:1a::10 (ntpool0.603.newcontinuum.net)

| Percentiles...... | Ranges...... | Skew- | Kurt- | |||||||||||||
| Name | Min | 1% | 5% | 50% | 95% | 99% | Max | 90% | 98% | StdDev | Mean | Units | ness | osis | ||
| Server Jitter 2607:ff50:0:1a::10 (ntpool0.603.newcontinuum.net) | 0.000 | 0.000 | 0.000 | 4.417 | 9.460 | 9.460 | 9.460 | 9.460 | 9.460 | 2.696 | 4.546 | ms | -0.0246 | 2.498 | ||
The RMS Jitter of a server. Jitter is the current estimated dispersion, in other words the variation in offset between samples.
Closer to 0s is better. An ideal system would be a horizontal line at 0s.
RMS Jitter is field 8 in the peerstats log file.
Server Jitter 2620:8d:c000::f (blotch.image1tech.net)

| Percentiles...... | Ranges...... | Skew- | Kurt- | |||||||||||||
| Name | Min | 1% | 5% | 50% | 95% | 99% | Max | 90% | 98% | StdDev | Mean | Units | ness | osis | ||
| Server Jitter 2620:8d:c000::f (blotch.image1tech.net) | 0.000 | 0.000 | 0.000 | 11.399 | 23.001 | 23.001 | 23.001 | 23.001 | 23.001 | 6.886 | 11.933 | ms | -0.1456 | 2.635 | ||
The RMS Jitter of a server. Jitter is the current estimated dispersion, in other words the variation in offset between samples.
Closer to 0s is better. An ideal system would be a horizontal line at 0s.
RMS Jitter is field 8 in the peerstats log file.
Server Jitter 2620:b0:2000:102::2:123 (time-he.den.codehof.net)

| Percentiles...... | Ranges...... | Skew- | Kurt- | |||||||||||||
| Name | Min | 1% | 5% | 50% | 95% | 99% | Max | 90% | 98% | StdDev | Mean | Units | ness | osis | ||
| Server Jitter 2620:b0:2000:102::2:123 (time-he.den.codehof.net) | 0.000 | 0.000 | 0.000 | 5.132 | 67.520 | 67.520 | 67.520 | 67.520 | 67.520 | 21.171 | 12.422 | ms | 2.131 | 5.771 | ||
The RMS Jitter of a server. Jitter is the current estimated dispersion, in other words the variation in offset between samples.
Closer to 0s is better. An ideal system would be a horizontal line at 0s.
RMS Jitter is field 8 in the peerstats log file.
Server Jitter 2a00:d78:0:712:94:198:159:11 (nts1.time.nl)

| Percentiles...... | Ranges...... | Skew- | Kurt- | |||||||||||||
| Name | Min | 1% | 5% | 50% | 95% | 99% | Max | 90% | 98% | StdDev | Mean | Units | ness | osis | ||
| Server Jitter 2a00:d78:0:712:94:198:159:11 (nts1.time.nl) | 0.000 | 1.584 | 2.966 | 20.836 | 77.601 | 99.042 | 530.168 | 74.635 | 97.459 | 26.838 | 29.328 | ms | 3.305 | 41.99 | ||
The RMS Jitter of a server. Jitter is the current estimated dispersion, in other words the variation in offset between samples.
Closer to 0s is better. An ideal system would be a horizontal line at 0s.
RMS Jitter is field 8 in the peerstats log file.
Server Jitter 2a01:3f7:2:44::8 (sth1-ts.nts.netnod.se)

| Percentiles...... | Ranges...... | Skew- | Kurt- | |||||||||||||
| Name | Min | 1% | 5% | 50% | 95% | 99% | Max | 90% | 98% | StdDev | Mean | Units | ness | osis | ||
| Server Jitter 2a01:3f7:2:44::8 (sth1-ts.nts.netnod.se) | 0.000 | 1.586 | 4.549 | 39.612 | 91.882 | 108.273 | 271.797 | 87.333 | 106.687 | 26.974 | 42.094 | ms | 0.8193 | 4.845 | ||
The RMS Jitter of a server. Jitter is the current estimated dispersion, in other words the variation in offset between samples.
Closer to 0s is better. An ideal system would be a horizontal line at 0s.
RMS Jitter is field 8 in the peerstats log file.
Server Jitter 2a01:3f7:2:44::9 (sth2-ts.nts.netnod.se)

| Percentiles...... | Ranges...... | Skew- | Kurt- | |||||||||||||
| Name | Min | 1% | 5% | 50% | 95% | 99% | Max | 90% | 98% | StdDev | Mean | Units | ness | osis | ||
| Server Jitter 2a01:3f7:2:44::9 (sth2-ts.nts.netnod.se) | 0.000 | 1.946 | 4.236 | 38.471 | 92.191 | 110.399 | 234.358 | 87.955 | 108.453 | 28.207 | 41.565 | ms | 0.7071 | 3.664 | ||
The RMS Jitter of a server. Jitter is the current estimated dispersion, in other words the variation in offset between samples.
Closer to 0s is better. An ideal system would be a horizontal line at 0s.
RMS Jitter is field 8 in the peerstats log file.
Server Jitter 2a01:4f8:c012:1afb:123:123:123:123

| Percentiles...... | Ranges...... | Skew- | Kurt- | |||||||||||||
| Name | Min | 1% | 5% | 50% | 95% | 99% | Max | 90% | 98% | StdDev | Mean | Units | ness | osis | ||
| Server Jitter 2a01:4f8:c012:1afb:123:123:123:123 | 0.000 | 2.107 | 4.538 | 29.415 | 67.555 | 89.560 | 458.532 | 63.018 | 87.453 | 23.919 | 32.258 | ms | 4.77 | 70.42 | ||
The RMS Jitter of a server. Jitter is the current estimated dispersion, in other words the variation in offset between samples.
Closer to 0s is better. An ideal system would be a horizontal line at 0s.
RMS Jitter is field 8 in the peerstats log file.
Server Jitter 2a01:4f9:c013:fa27:123:123:123:123

| Percentiles...... | Ranges...... | Skew- | Kurt- | |||||||||||||
| Name | Min | 1% | 5% | 50% | 95% | 99% | Max | 90% | 98% | StdDev | Mean | Units | ness | osis | ||
| Server Jitter 2a01:4f9:c013:fa27:123:123:123:123 | 0.000 | 1.942 | 3.997 | 36.742 | 92.861 | 109.042 | 178.690 | 88.864 | 107.100 | 29.597 | 40.764 | ms | 0.5627 | 2.58 | ||
The RMS Jitter of a server. Jitter is the current estimated dispersion, in other words the variation in offset between samples.
Closer to 0s is better. An ideal system would be a horizontal line at 0s.
RMS Jitter is field 8 in the peerstats log file.
Server Jitter 2a01:4ff:f0:7300:123:123:123:123

| Percentiles...... | Ranges...... | Skew- | Kurt- | |||||||||||||
| Name | Min | 1% | 5% | 50% | 95% | 99% | Max | 90% | 98% | StdDev | Mean | Units | ness | osis | ||
| Server Jitter 2a01:4ff:f0:7300:123:123:123:123 | 0.000 | 1.015 | 1.606 | 5.227 | 35.666 | 58.999 | 390.666 | 34.060 | 57.984 | 15.078 | 10.007 | ms | 10.55 | 228.5 | ||
The RMS Jitter of a server. Jitter is the current estimated dispersion, in other words the variation in offset between samples.
Closer to 0s is better. An ideal system would be a horizontal line at 0s.
RMS Jitter is field 8 in the peerstats log file.
Server Jitter 2a01:4ff:f0:ebce::1

| Percentiles...... | Ranges...... | Skew- | Kurt- | |||||||||||||
| Name | Min | 1% | 5% | 50% | 95% | 99% | Max | 90% | 98% | StdDev | Mean | Units | ness | osis | ||
| Server Jitter 2a01:4ff:f0:ebce::1 | 0.000 | 0.000 | 0.000 | 25.847 | 25.847 | 25.847 | 25.847 | 25.847 | 25.847 | 12.924 | 12.924 | ms | 0 | 1 | ||
The RMS Jitter of a server. Jitter is the current estimated dispersion, in other words the variation in offset between samples.
Closer to 0s is better. An ideal system would be a horizontal line at 0s.
RMS Jitter is field 8 in the peerstats log file.
Server Jitter 2a01:7e03::f03c:95ff:fef8:ac8c (sushi.ruselabs.com)

| Percentiles...... | Ranges...... | Skew- | Kurt- | |||||||||||||
| Name | Min | 1% | 5% | 50% | 95% | 99% | Max | 90% | 98% | StdDev | Mean | Units | ness | osis | ||
| Server Jitter 2a01:7e03::f03c:95ff:fef8:ac8c (sushi.ruselabs.com) | 0.000 | 0.000 | 0.000 | 32.068 | 70.288 | 70.288 | 70.288 | 70.288 | 70.288 | 19.572 | 34.261 | ms | 0.1428 | 3.002 | ||
The RMS Jitter of a server. Jitter is the current estimated dispersion, in other words the variation in offset between samples.
Closer to 0s is better. An ideal system would be a horizontal line at 0s.
RMS Jitter is field 8 in the peerstats log file.
Server Jitter 2a01:7e04::f03c:94ff:fee2:cba5

| Percentiles...... | Ranges...... | Skew- | Kurt- | |||||||||||||
| Name | Min | 1% | 5% | 50% | 95% | 99% | Max | 90% | 98% | StdDev | Mean | Units | ness | osis | ||
| Server Jitter 2a01:7e04::f03c:94ff:fee2:cba5 | 0.000 | 0.000 | 0.000 | 1.794 | 29.750 | 29.750 | 29.750 | 29.750 | 29.750 | 9.167 | 5.895 | ms | 1.677 | 4.108 | ||
The RMS Jitter of a server. Jitter is the current estimated dispersion, in other words the variation in offset between samples.
Closer to 0s is better. An ideal system would be a horizontal line at 0s.
RMS Jitter is field 8 in the peerstats log file.
Server Jitter 2a0a:e5c0:2:2:0:c8ff:fe68:beb7 (42-2a0a-e5c0-2-2-0-c8ff-fe68-beb7.loves.ipv6.at.ungleich.ch)

| Percentiles...... | Ranges...... | Skew- | Kurt- | |||||||||||||
| Name | Min | 1% | 5% | 50% | 95% | 99% | Max | 90% | 98% | StdDev | Mean | Units | ness | osis | ||
| Server Jitter 2a0a:e5c0:2:2:0:c8ff:fe68:beb7 (42-2a0a-e5c0-2-2-0-c8ff-fe68-beb7.loves.ipv6.at.ungleich.ch) | 0.960 | 1.460 | 2.257 | 13.905 | 74.907 | 99.253 | 114.435 | 72.649 | 97.793 | 24.920 | 24.749 | ms | 1.308 | 3.834 | ||
The RMS Jitter of a server. Jitter is the current estimated dispersion, in other words the variation in offset between samples.
Closer to 0s is better. An ideal system would be a horizontal line at 0s.
RMS Jitter is field 8 in the peerstats log file.
Server Jitter 34.147.28.4

| Percentiles...... | Ranges...... | Skew- | Kurt- | |||||||||||||
| Name | Min | 1% | 5% | 50% | 95% | 99% | Max | 90% | 98% | StdDev | Mean | Units | ness | osis | ||
| Server Jitter 34.147.28.4 | 0.000 | 0.803 | 1.807 | 18.567 | 78.066 | 98.914 | 166.058 | 76.259 | 98.112 | 25.574 | 27.639 | ms | 1.086 | 3.847 | ||
The RMS Jitter of a server. Jitter is the current estimated dispersion, in other words the variation in offset between samples.
Closer to 0s is better. An ideal system would be a horizontal line at 0s.
RMS Jitter is field 8 in the peerstats log file.
Server Jitter 37.27.11.4

| Percentiles...... | Ranges...... | Skew- | Kurt- | |||||||||||||
| Name | Min | 1% | 5% | 50% | 95% | 99% | Max | 90% | 98% | StdDev | Mean | Units | ness | osis | ||
| Server Jitter 37.27.11.4 | 0.000 | 0.000 | 1.780 | 14.020 | 76.180 | 81.696 | 81.940 | 74.400 | 81.696 | 20.637 | 20.684 | ms | 1.598 | 4.786 | ||
The RMS Jitter of a server. Jitter is the current estimated dispersion, in other words the variation in offset between samples.
Closer to 0s is better. An ideal system would be a horizontal line at 0s.
RMS Jitter is field 8 in the peerstats log file.
Server Jitter 38.45.64.130

| Percentiles...... | Ranges...... | Skew- | Kurt- | |||||||||||||
| Name | Min | 1% | 5% | 50% | 95% | 99% | Max | 90% | 98% | StdDev | Mean | Units | ness | osis | ||
| Server Jitter 38.45.64.130 | 0.000 | 0.000 | 7.571 | 29.546 | 64.425 | 166.492 | 263.171 | 56.855 | 166.492 | 23.853 | 34.485 | ms | 4.369 | 34.53 | ||
The RMS Jitter of a server. Jitter is the current estimated dispersion, in other words the variation in offset between samples.
Closer to 0s is better. An ideal system would be a horizontal line at 0s.
RMS Jitter is field 8 in the peerstats log file.
Server Jitter 40.160.28.79

| Percentiles...... | Ranges...... | Skew- | Kurt- | |||||||||||||
| Name | Min | 1% | 5% | 50% | 95% | 99% | Max | 90% | 98% | StdDev | Mean | Units | ness | osis | ||
| Server Jitter 40.160.28.79 | 0.000 | 1.801 | 6.063 | 24.301 | 44.703 | 52.503 | 53.020 | 38.640 | 50.702 | 10.983 | 25.335 | ms | 0.2798 | 2.796 | ||
The RMS Jitter of a server. Jitter is the current estimated dispersion, in other words the variation in offset between samples.
Closer to 0s is better. An ideal system would be a horizontal line at 0s.
RMS Jitter is field 8 in the peerstats log file.
Server Jitter 44.190.5.123

| Percentiles...... | Ranges...... | Skew- | Kurt- | |||||||||||||
| Name | Min | 1% | 5% | 50% | 95% | 99% | Max | 90% | 98% | StdDev | Mean | Units | ness | osis | ||
| Server Jitter 44.190.5.123 | 0.000 | 0.690 | 1.041 | 2.749 | 11.266 | 21.652 | 606.922 | 10.225 | 20.962 | 13.385 | 4.233 | ms | 36.76 | 1584 | ||
The RMS Jitter of a server. Jitter is the current estimated dispersion, in other words the variation in offset between samples.
Closer to 0s is better. An ideal system would be a horizontal line at 0s.
RMS Jitter is field 8 in the peerstats log file.
Server Jitter 45.33.53.84

| Percentiles...... | Ranges...... | Skew- | Kurt- | |||||||||||||
| Name | Min | 1% | 5% | 50% | 95% | 99% | Max | 90% | 98% | StdDev | Mean | Units | ness | osis | ||
| Server Jitter 45.33.53.84 | 0.000 | 0.831 | 1.241 | 3.939 | 13.487 | 24.803 | 53.423 | 12.247 | 23.971 | 5.057 | 5.138 | ms | 4.216 | 30.01 | ||
The RMS Jitter of a server. Jitter is the current estimated dispersion, in other words the variation in offset between samples.
Closer to 0s is better. An ideal system would be a horizontal line at 0s.
RMS Jitter is field 8 in the peerstats log file.
Server Jitter 45.45.184.14

| Percentiles...... | Ranges...... | Skew- | Kurt- | |||||||||||||
| Name | Min | 1% | 5% | 50% | 95% | 99% | Max | 90% | 98% | StdDev | Mean | Units | ness | osis | ||
| Server Jitter 45.45.184.14 | 0.000 | 0.000 | 1.110 | 4.697 | 21.496 | 34.599 | 34.599 | 20.386 | 34.599 | 7.191 | 6.851 | ms | 2.344 | 8.455 | ||
The RMS Jitter of a server. Jitter is the current estimated dispersion, in other words the variation in offset between samples.
Closer to 0s is better. An ideal system would be a horizontal line at 0s.
RMS Jitter is field 8 in the peerstats log file.
Server Jitter 45.55.58.103

| Percentiles...... | Ranges...... | Skew- | Kurt- | |||||||||||||
| Name | Min | 1% | 5% | 50% | 95% | 99% | Max | 90% | 98% | StdDev | Mean | Units | ness | osis | ||
| Server Jitter 45.55.58.103 | 0.000 | 0.000 | 0.000 | 85.863 | 108.041 | 108.041 | 108.041 | 108.041 | 108.041 | 46.518 | 50.518 | ms | 0.04903 | 1.088 | ||
The RMS Jitter of a server. Jitter is the current estimated dispersion, in other words the variation in offset between samples.
Closer to 0s is better. An ideal system would be a horizontal line at 0s.
RMS Jitter is field 8 in the peerstats log file.
Server Jitter 45.63.54.13

| Percentiles...... | Ranges...... | Skew- | Kurt- | |||||||||||||
| Name | Min | 1% | 5% | 50% | 95% | 99% | Max | 90% | 98% | StdDev | Mean | Units | ness | osis | ||
| Server Jitter 45.63.54.13 | 0.000 | 0.000 | 0.926 | 3.219 | 11.454 | 24.347 | 79.311 | 10.528 | 24.347 | 6.984 | 4.593 | ms | 7.316 | 68.66 | ||
The RMS Jitter of a server. Jitter is the current estimated dispersion, in other words the variation in offset between samples.
Closer to 0s is better. An ideal system would be a horizontal line at 0s.
RMS Jitter is field 8 in the peerstats log file.
Server Jitter 45.77.126.122

| Percentiles...... | Ranges...... | Skew- | Kurt- | |||||||||||||
| Name | Min | 1% | 5% | 50% | 95% | 99% | Max | 90% | 98% | StdDev | Mean | Units | ness | osis | ||
| Server Jitter 45.77.126.122 | 0.000 | 0.000 | 0.000 | 1.241 | 5.704 | 5.704 | 5.704 | 5.704 | 5.704 | 1.667 | 1.809 | ms | 1.009 | 2.758 | ||
The RMS Jitter of a server. Jitter is the current estimated dispersion, in other words the variation in offset between samples.
Closer to 0s is better. An ideal system would be a horizontal line at 0s.
RMS Jitter is field 8 in the peerstats log file.
Server Jitter 45.79.111.167
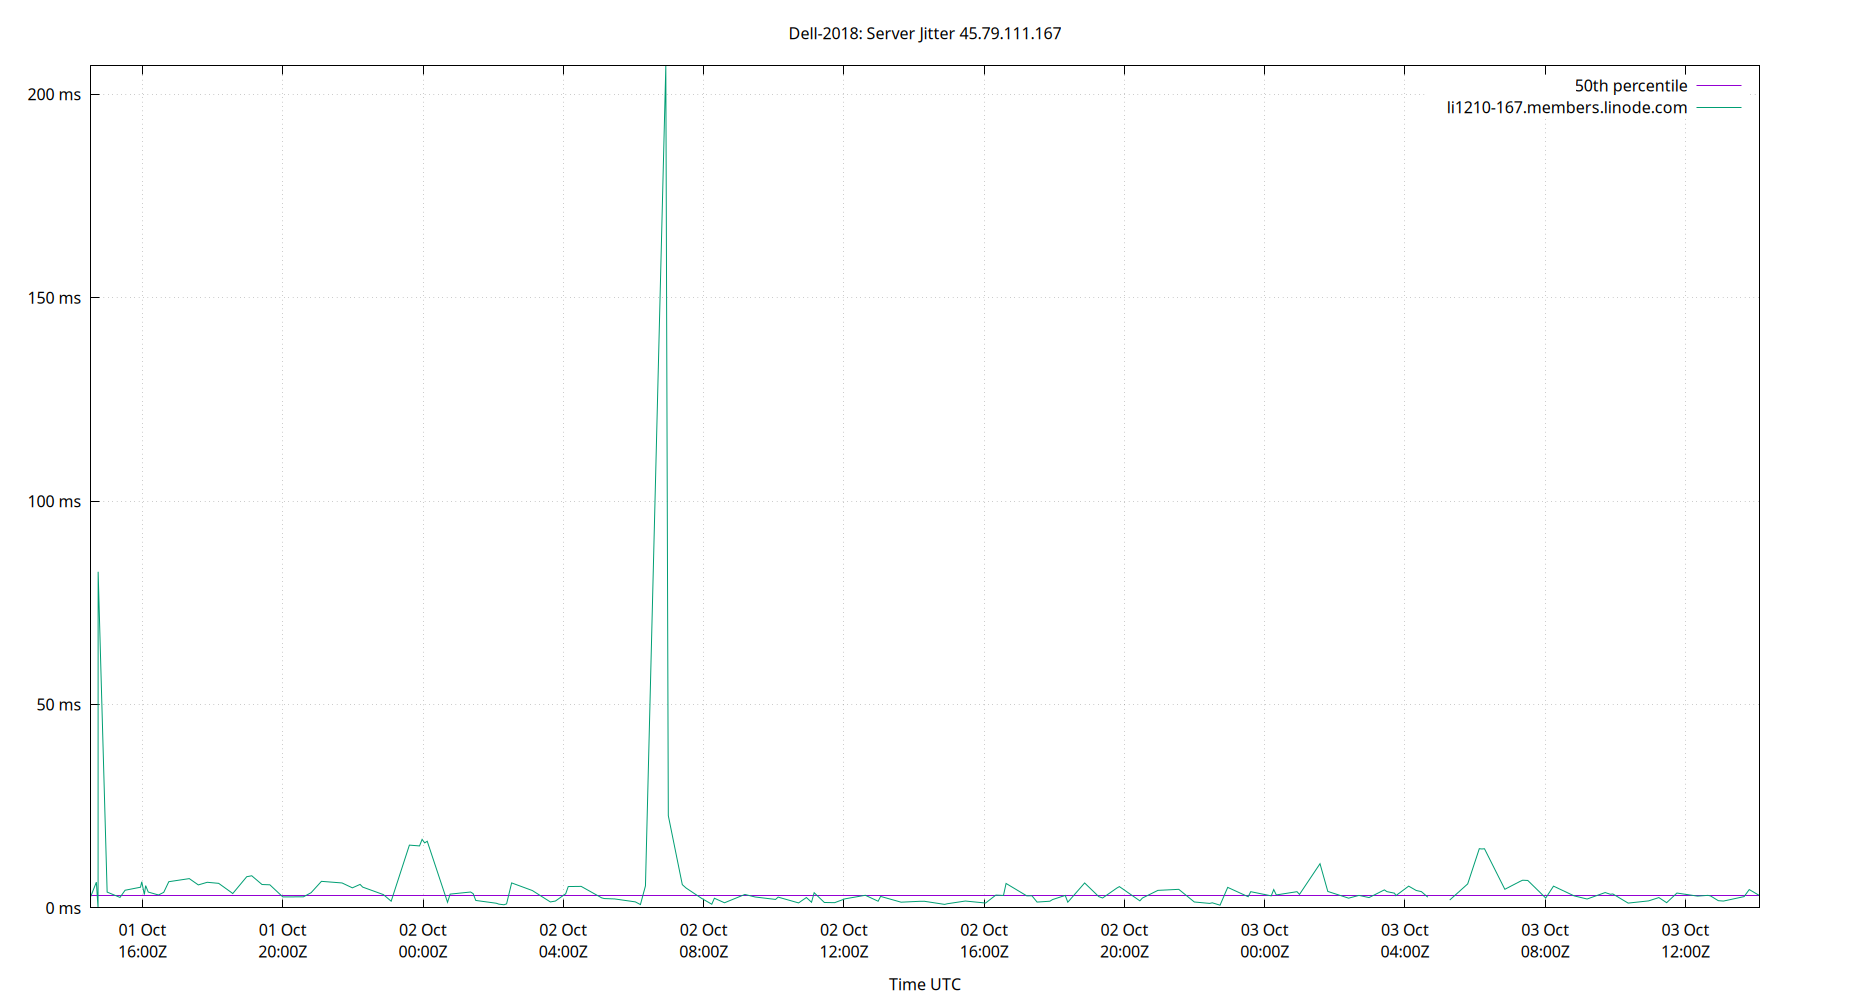
| Percentiles...... | Ranges...... | Skew- | Kurt- | |||||||||||||
| Name | Min | 1% | 5% | 50% | 95% | 99% | Max | 90% | 98% | StdDev | Mean | Units | ness | osis | ||
| Server Jitter 45.79.111.167 | 0.000 | 0.000 | 0.953 | 3.169 | 15.255 | 82.645 | 207.001 | 14.303 | 82.645 | 17.209 | 6.044 | ms | 9.837 | 110.1 | ||
The RMS Jitter of a server. Jitter is the current estimated dispersion, in other words the variation in offset between samples.
Closer to 0s is better. An ideal system would be a horizontal line at 0s.
RMS Jitter is field 8 in the peerstats log file.
Server Jitter 45.79.13.35
| Percentiles...... | Ranges...... | Skew- | Kurt- | |||||||||||||
| Name | Min | 1% | 5% | 50% | 95% | 99% | Max | 90% | 98% | StdDev | Mean | Units | ness | osis | ||
| Server Jitter 45.79.13.35 | 0.000 | 0.000 | 0.000 | 2.016 | 2.016 | 2.016 | 2.016 | 2.016 | 2.016 | 1.008 | 1.008 | ms | 0 | 1 | ||
The RMS Jitter of a server. Jitter is the current estimated dispersion, in other words the variation in offset between samples.
Closer to 0s is better. An ideal system would be a horizontal line at 0s.
RMS Jitter is field 8 in the peerstats log file.
Server Jitter 45.79.227.165
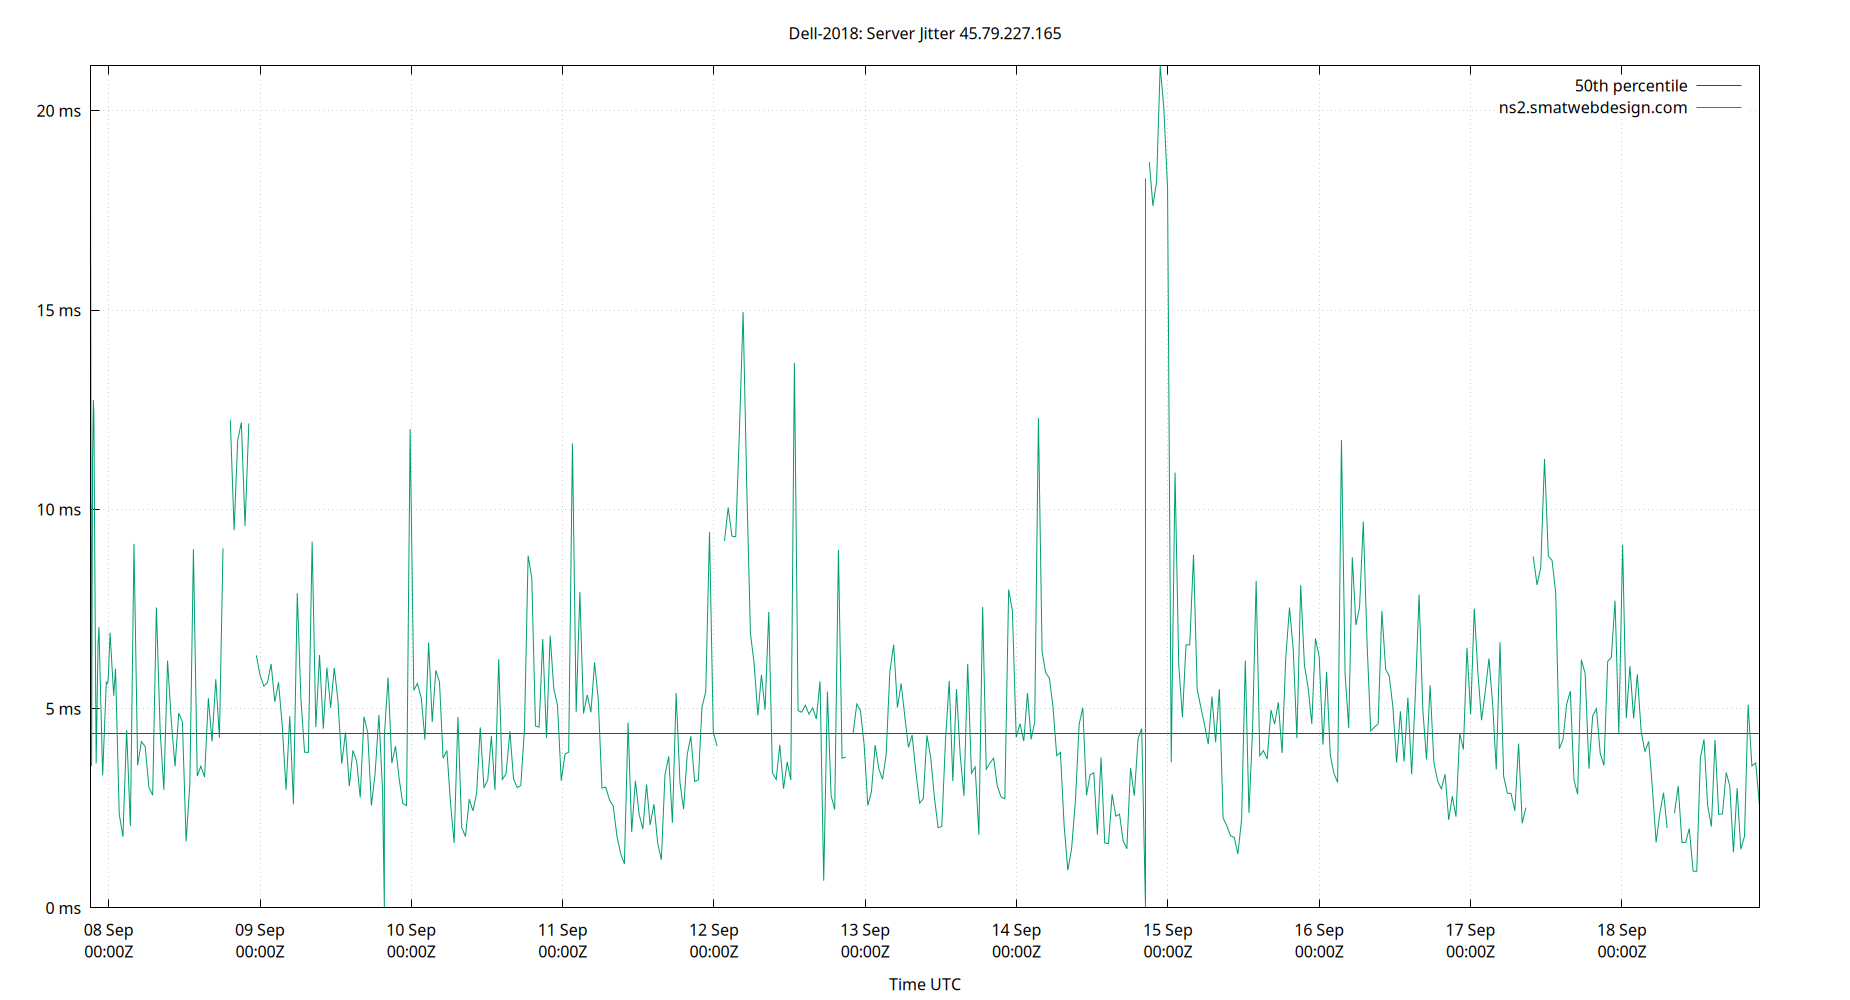
| Percentiles...... | Ranges...... | Skew- | Kurt- | |||||||||||||
| Name | Min | 1% | 5% | 50% | 95% | 99% | Max | 90% | 98% | StdDev | Mean | Units | ness | osis | ||
| Server Jitter 45.79.227.165 | 0.000 | 0.920 | 1.500 | 4.176 | 11.740 | 18.714 | 21.129 | 10.241 | 17.793 | 3.267 | 4.857 | ms | 2.142 | 9.049 | ||
The RMS Jitter of a server. Jitter is the current estimated dispersion, in other words the variation in offset between samples.
Closer to 0s is better. An ideal system would be a horizontal line at 0s.
RMS Jitter is field 8 in the peerstats log file.
Server Jitter 45.79.82.45
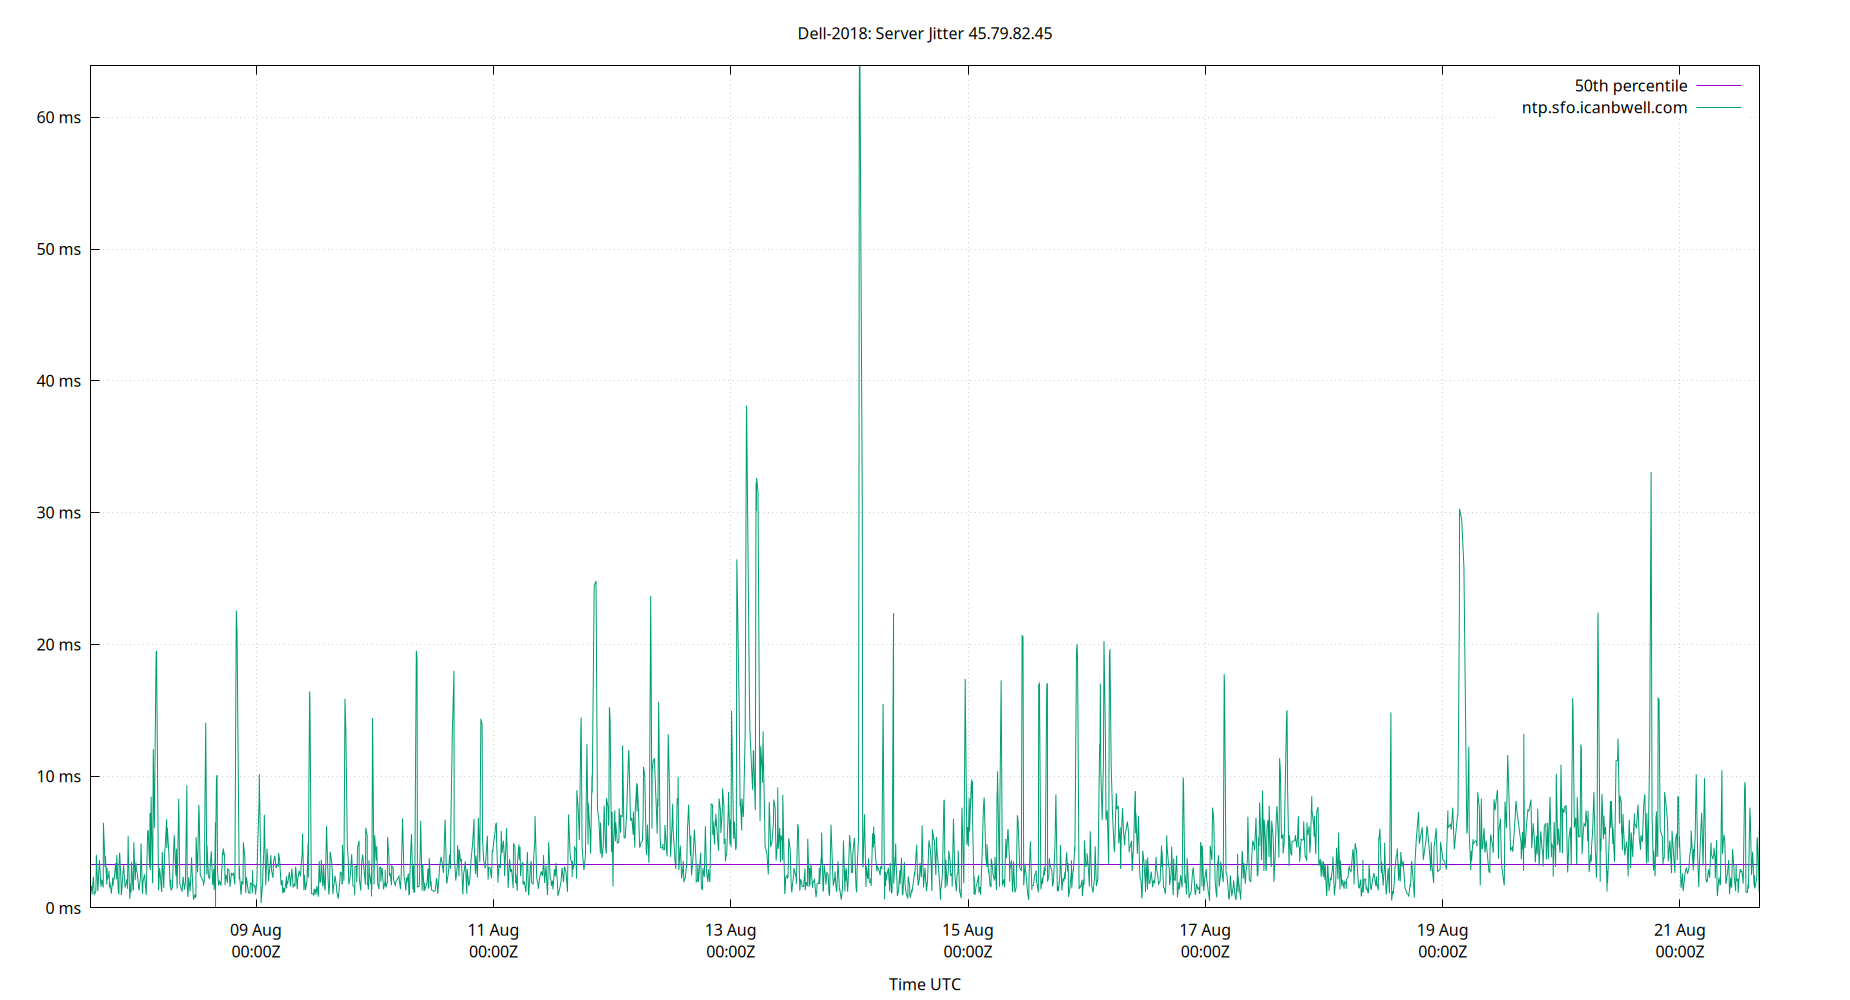
| Percentiles...... | Ranges...... | Skew- | Kurt- | |||||||||||||
| Name | Min | 1% | 5% | 50% | 95% | 99% | Max | 90% | 98% | StdDev | Mean | Units | ness | osis | ||
| Server Jitter 45.79.82.45 | 0.000 | 0.754 | 1.102 | 3.321 | 12.050 | 24.480 | 63.897 | 10.948 | 23.726 | 4.900 | 4.561 | ms | 5.374 | 50.29 | ||
The RMS Jitter of a server. Jitter is the current estimated dispersion, in other words the variation in offset between samples.
Closer to 0s is better. An ideal system would be a horizontal line at 0s.
RMS Jitter is field 8 in the peerstats log file.
Server Jitter 45.83.234.123

| Percentiles...... | Ranges...... | Skew- | Kurt- | |||||||||||||
| Name | Min | 1% | 5% | 50% | 95% | 99% | Max | 90% | 98% | StdDev | Mean | Units | ness | osis | ||
| Server Jitter 45.83.234.123 | 0.000 | 1.483 | 4.387 | 42.939 | 82.952 | 103.588 | 180.284 | 78.565 | 102.105 | 25.149 | 41.908 | ms | 0.5962 | 4.49 | ||
The RMS Jitter of a server. Jitter is the current estimated dispersion, in other words the variation in offset between samples.
Closer to 0s is better. An ideal system would be a horizontal line at 0s.
RMS Jitter is field 8 in the peerstats log file.
Server Jitter 47.85.203.40

| Percentiles...... | Ranges...... | Skew- | Kurt- | |||||||||||||
| Name | Min | 1% | 5% | 50% | 95% | 99% | Max | 90% | 98% | StdDev | Mean | Units | ness | osis | ||
| Server Jitter 47.85.203.40 | 0.000 | 0.848 | 1.598 | 5.948 | 28.308 | 42.271 | 42.446 | 26.710 | 41.422 | 9.054 | 9.477 | ms | 1.937 | 6.968 | ||
The RMS Jitter of a server. Jitter is the current estimated dispersion, in other words the variation in offset between samples.
Closer to 0s is better. An ideal system would be a horizontal line at 0s.
RMS Jitter is field 8 in the peerstats log file.
Server Jitter 49.12.103.123

| Percentiles...... | Ranges...... | Skew- | Kurt- | |||||||||||||
| Name | Min | 1% | 5% | 50% | 95% | 99% | Max | 90% | 98% | StdDev | Mean | Units | ness | osis | ||
| Server Jitter 49.12.103.123 | 0.000 | 0.000 | 7.178 | 50.984 | 95.543 | 105.971 | 112.348 | 88.364 | 105.971 | 24.549 | 51.635 | ms | 0.01243 | 2.627 | ||
The RMS Jitter of a server. Jitter is the current estimated dispersion, in other words the variation in offset between samples.
Closer to 0s is better. An ideal system would be a horizontal line at 0s.
RMS Jitter is field 8 in the peerstats log file.
Server Jitter 5.161.111.190

| Percentiles...... | Ranges...... | Skew- | Kurt- | |||||||||||||
| Name | Min | 1% | 5% | 50% | 95% | 99% | Max | 90% | 98% | StdDev | Mean | Units | ness | osis | ||
| Server Jitter 5.161.111.190 | 0.000 | 0.887 | 1.554 | 4.668 | 21.349 | 37.015 | 37.112 | 19.795 | 36.128 | 7.669 | 8.606 | ms | 1.358 | 4.999 | ||
The RMS Jitter of a server. Jitter is the current estimated dispersion, in other words the variation in offset between samples.
Closer to 0s is better. An ideal system would be a horizontal line at 0s.
RMS Jitter is field 8 in the peerstats log file.
Server Jitter 5.161.65.34

| Percentiles...... | Ranges...... | Skew- | Kurt- | |||||||||||||
| Name | Min | 1% | 5% | 50% | 95% | 99% | Max | 90% | 98% | StdDev | Mean | Units | ness | osis | ||
| Server Jitter 5.161.65.34 | 0.000 | 0.000 | 0.000 | 4.473 | 17.184 | 17.184 | 17.184 | 17.184 | 17.184 | 4.658 | 5.050 | ms | 0.938 | 3.169 | ||
The RMS Jitter of a server. Jitter is the current estimated dispersion, in other words the variation in offset between samples.
Closer to 0s is better. An ideal system would be a horizontal line at 0s.
RMS Jitter is field 8 in the peerstats log file.
Server Jitter 5.161.94.12

| Percentiles...... | Ranges...... | Skew- | Kurt- | |||||||||||||
| Name | Min | 1% | 5% | 50% | 95% | 99% | Max | 90% | 98% | StdDev | Mean | Units | ness | osis | ||
| Server Jitter 5.161.94.12 | 0.000 | 0.726 | 1.107 | 5.319 | 32.339 | 56.965 | 81.956 | 31.232 | 56.239 | 10.938 | 9.475 | ms | 2.697 | 13.19 | ||
The RMS Jitter of a server. Jitter is the current estimated dispersion, in other words the variation in offset between samples.
Closer to 0s is better. An ideal system would be a horizontal line at 0s.
RMS Jitter is field 8 in the peerstats log file.
Server Jitter 5.57.11.195
| Percentiles...... | Ranges...... | Skew- | Kurt- | |||||||||||||
| Name | Min | 1% | 5% | 50% | 95% | 99% | Max | 90% | 98% | StdDev | Mean | Units | ness | osis | ||
| Server Jitter 5.57.11.195 | 0.000 | 0.000 | 0.000 | 1.528 | 1.528 | 1.528 | 1.528 | 1.528 | 1.528 | 0.764 | 0.764 | ms | 0 | 1 | ||
The RMS Jitter of a server. Jitter is the current estimated dispersion, in other words the variation in offset between samples.
Closer to 0s is better. An ideal system would be a horizontal line at 0s.
RMS Jitter is field 8 in the peerstats log file.
Server Jitter 50.117.3.52

| Percentiles...... | Ranges...... | Skew- | Kurt- | |||||||||||||
| Name | Min | 1% | 5% | 50% | 95% | 99% | Max | 90% | 98% | StdDev | Mean | Units | ness | osis | ||
| Server Jitter 50.117.3.52 | 0.000 | 0.000 | 0.000 | 1.241 | 1.948 | 1.948 | 1.948 | 1.948 | 1.948 | 0.616 | 1.028 | ms | -0.1887 | 2.181 | ||
The RMS Jitter of a server. Jitter is the current estimated dispersion, in other words the variation in offset between samples.
Closer to 0s is better. An ideal system would be a horizontal line at 0s.
RMS Jitter is field 8 in the peerstats log file.
Server Jitter 50.117.3.95

| Percentiles...... | Ranges...... | Skew- | Kurt- | |||||||||||||
| Name | Min | 1% | 5% | 50% | 95% | 99% | Max | 90% | 98% | StdDev | Mean | Units | ness | osis | ||
| Server Jitter 50.117.3.95 | 0.000 | 0.000 | 0.096 | 3.528 | 22.835 | 29.378 | 30.209 | 22.739 | 29.378 | 7.966 | 7.859 | ms | 1.051 | 2.928 | ||
The RMS Jitter of a server. Jitter is the current estimated dispersion, in other words the variation in offset between samples.
Closer to 0s is better. An ideal system would be a horizontal line at 0s.
RMS Jitter is field 8 in the peerstats log file.
Server Jitter 50.205.57.38

| Percentiles...... | Ranges...... | Skew- | Kurt- | |||||||||||||
| Name | Min | 1% | 5% | 50% | 95% | 99% | Max | 90% | 98% | StdDev | Mean | Units | ness | osis | ||
| Server Jitter 50.205.57.38 | 0.000 | 0.000 | 0.000 | 2.064 | 12.794 | 26.867 | 26.867 | 12.794 | 26.867 | 5.655 | 3.818 | ms | 2.994 | 11.9 | ||
The RMS Jitter of a server. Jitter is the current estimated dispersion, in other words the variation in offset between samples.
Closer to 0s is better. An ideal system would be a horizontal line at 0s.
RMS Jitter is field 8 in the peerstats log file.
Server Jitter 50.218.103.254

| Percentiles...... | Ranges...... | Skew- | Kurt- | |||||||||||||
| Name | Min | 1% | 5% | 50% | 95% | 99% | Max | 90% | 98% | StdDev | Mean | Units | ness | osis | ||
| Server Jitter 50.218.103.254 | 0.000 | 0.000 | 0.163 | 9.296 | 31.573 | 43.704 | 46.371 | 31.410 | 43.704 | 9.986 | 11.553 | ms | 1.272 | 4.653 | ||
The RMS Jitter of a server. Jitter is the current estimated dispersion, in other words the variation in offset between samples.
Closer to 0s is better. An ideal system would be a horizontal line at 0s.
RMS Jitter is field 8 in the peerstats log file.
Server Jitter 51.38.58.233

| Percentiles...... | Ranges...... | Skew- | Kurt- | |||||||||||||
| Name | Min | 1% | 5% | 50% | 95% | 99% | Max | 90% | 98% | StdDev | Mean | Units | ness | osis | ||
| Server Jitter 51.38.58.233 | 0.000 | 0.627 | 1.195 | 2.758 | 18.088 | 25.470 | 29.937 | 16.893 | 24.843 | 5.518 | 4.851 | ms | 2.569 | 9.414 | ||
The RMS Jitter of a server. Jitter is the current estimated dispersion, in other words the variation in offset between samples.
Closer to 0s is better. An ideal system would be a horizontal line at 0s.
RMS Jitter is field 8 in the peerstats log file.
Server Jitter 51.81.226.229

| Percentiles...... | Ranges...... | Skew- | Kurt- | |||||||||||||
| Name | Min | 1% | 5% | 50% | 95% | 99% | Max | 90% | 98% | StdDev | Mean | Units | ness | osis | ||
| Server Jitter 51.81.226.229 | 0.000 | 0.657 | 1.042 | 3.022 | 15.578 | 21.479 | 24.923 | 14.536 | 20.822 | 4.160 | 4.314 | ms | 2.661 | 10.4 | ||
The RMS Jitter of a server. Jitter is the current estimated dispersion, in other words the variation in offset between samples.
Closer to 0s is better. An ideal system would be a horizontal line at 0s.
RMS Jitter is field 8 in the peerstats log file.
Server Jitter 64.131.47.178
| Percentiles...... | Ranges...... | Skew- | Kurt- | |||||||||||||
| Name | Min | 1% | 5% | 50% | 95% | 99% | Max | 90% | 98% | StdDev | Mean | Units | ness | osis | ||
| Server Jitter 64.131.47.178 | 0.000 | 0.000 | 0.000 | 2.618 | 40.956 | 40.956 | 40.956 | 40.956 | 40.956 | 13.476 | 8.143 | ms | 1.991 | 5.057 | ||
The RMS Jitter of a server. Jitter is the current estimated dispersion, in other words the variation in offset between samples.
Closer to 0s is better. An ideal system would be a horizontal line at 0s.
RMS Jitter is field 8 in the peerstats log file.
Server Jitter 64.251.10.152

| Percentiles...... | Ranges...... | Skew- | Kurt- | |||||||||||||
| Name | Min | 1% | 5% | 50% | 95% | 99% | Max | 90% | 98% | StdDev | Mean | Units | ness | osis | ||
| Server Jitter 64.251.10.152 | 0.000 | 0.662 | 1.310 | 2.937 | 14.783 | 23.548 | 24.751 | 13.473 | 22.886 | 4.514 | 4.810 | ms | 2.064 | 7.271 | ||
The RMS Jitter of a server. Jitter is the current estimated dispersion, in other words the variation in offset between samples.
Closer to 0s is better. An ideal system would be a horizontal line at 0s.
RMS Jitter is field 8 in the peerstats log file.
Server Jitter 64.79.100.197

| Percentiles...... | Ranges...... | Skew- | Kurt- | |||||||||||||
| Name | Min | 1% | 5% | 50% | 95% | 99% | Max | 90% | 98% | StdDev | Mean | Units | ness | osis | ||
| Server Jitter 64.79.100.197 | 0.000 | 0.000 | 0.837 | 2.598 | 8.572 | 24.806 | 29.820 | 7.735 | 24.806 | 4.184 | 3.573 | ms | 4.025 | 21.53 | ||
The RMS Jitter of a server. Jitter is the current estimated dispersion, in other words the variation in offset between samples.
Closer to 0s is better. An ideal system would be a horizontal line at 0s.
RMS Jitter is field 8 in the peerstats log file.
Server Jitter 65.182.224.39

| Percentiles...... | Ranges...... | Skew- | Kurt- | |||||||||||||
| Name | Min | 1% | 5% | 50% | 95% | 99% | Max | 90% | 98% | StdDev | Mean | Units | ness | osis | ||
| Server Jitter 65.182.224.39 | 0.000 | 0.000 | 0.862 | 2.232 | 8.548 | 15.286 | 19.717 | 7.685 | 15.286 | 2.906 | 3.164 | ms | 2.538 | 10.82 | ||
The RMS Jitter of a server. Jitter is the current estimated dispersion, in other words the variation in offset between samples.
Closer to 0s is better. An ideal system would be a horizontal line at 0s.
RMS Jitter is field 8 in the peerstats log file.
Server Jitter 65.182.224.60

| Percentiles...... | Ranges...... | Skew- | Kurt- | |||||||||||||
| Name | Min | 1% | 5% | 50% | 95% | 99% | Max | 90% | 98% | StdDev | Mean | Units | ness | osis | ||
| Server Jitter 65.182.224.60 | 0.000 | 0.000 | 2.004 | 3.445 | 7.058 | 10.501 | 10.501 | 5.054 | 10.501 | 1.855 | 3.928 | ms | 1.023 | 4.59 | ||
The RMS Jitter of a server. Jitter is the current estimated dispersion, in other words the variation in offset between samples.
Closer to 0s is better. An ideal system would be a horizontal line at 0s.
RMS Jitter is field 8 in the peerstats log file.
Server Jitter 66.118.228.14

| Percentiles...... | Ranges...... | Skew- | Kurt- | |||||||||||||
| Name | Min | 1% | 5% | 50% | 95% | 99% | Max | 90% | 98% | StdDev | Mean | Units | ness | osis | ||
| Server Jitter 66.118.228.14 | 0.000 | 1.929 | 2.939 | 6.604 | 16.232 | 40.531 | 64.782 | 13.293 | 38.601 | 6.085 | 7.807 | ms | 4.869 | 36.09 | ||
The RMS Jitter of a server. Jitter is the current estimated dispersion, in other words the variation in offset between samples.
Closer to 0s is better. An ideal system would be a horizontal line at 0s.
RMS Jitter is field 8 in the peerstats log file.
Server Jitter 66.118.229.14

| Percentiles...... | Ranges...... | Skew- | Kurt- | |||||||||||||
| Name | Min | 1% | 5% | 50% | 95% | 99% | Max | 90% | 98% | StdDev | Mean | Units | ness | osis | ||
| Server Jitter 66.118.229.14 | 0.000 | 12.905 | 17.541 | 43.034 | 69.623 | 82.562 | 91.203 | 52.082 | 69.657 | 15.534 | 43.735 | ms | 0.08592 | 3.136 | ||
The RMS Jitter of a server. Jitter is the current estimated dispersion, in other words the variation in offset between samples.
Closer to 0s is better. An ideal system would be a horizontal line at 0s.
RMS Jitter is field 8 in the peerstats log file.
Server Jitter 66.118.231.14

| Percentiles...... | Ranges...... | Skew- | Kurt- | |||||||||||||
| Name | Min | 1% | 5% | 50% | 95% | 99% | Max | 90% | 98% | StdDev | Mean | Units | ness | osis | ||
| Server Jitter 66.118.231.14 | 0.000 | 0.000 | 0.000 | 1.084 | 4.383 | 4.383 | 4.383 | 4.383 | 4.383 | 1.272 | 1.490 | ms | 1.426 | 4.099 | ||
The RMS Jitter of a server. Jitter is the current estimated dispersion, in other words the variation in offset between samples.
Closer to 0s is better. An ideal system would be a horizontal line at 0s.
RMS Jitter is field 8 in the peerstats log file.
Server Jitter 67.210.96.32
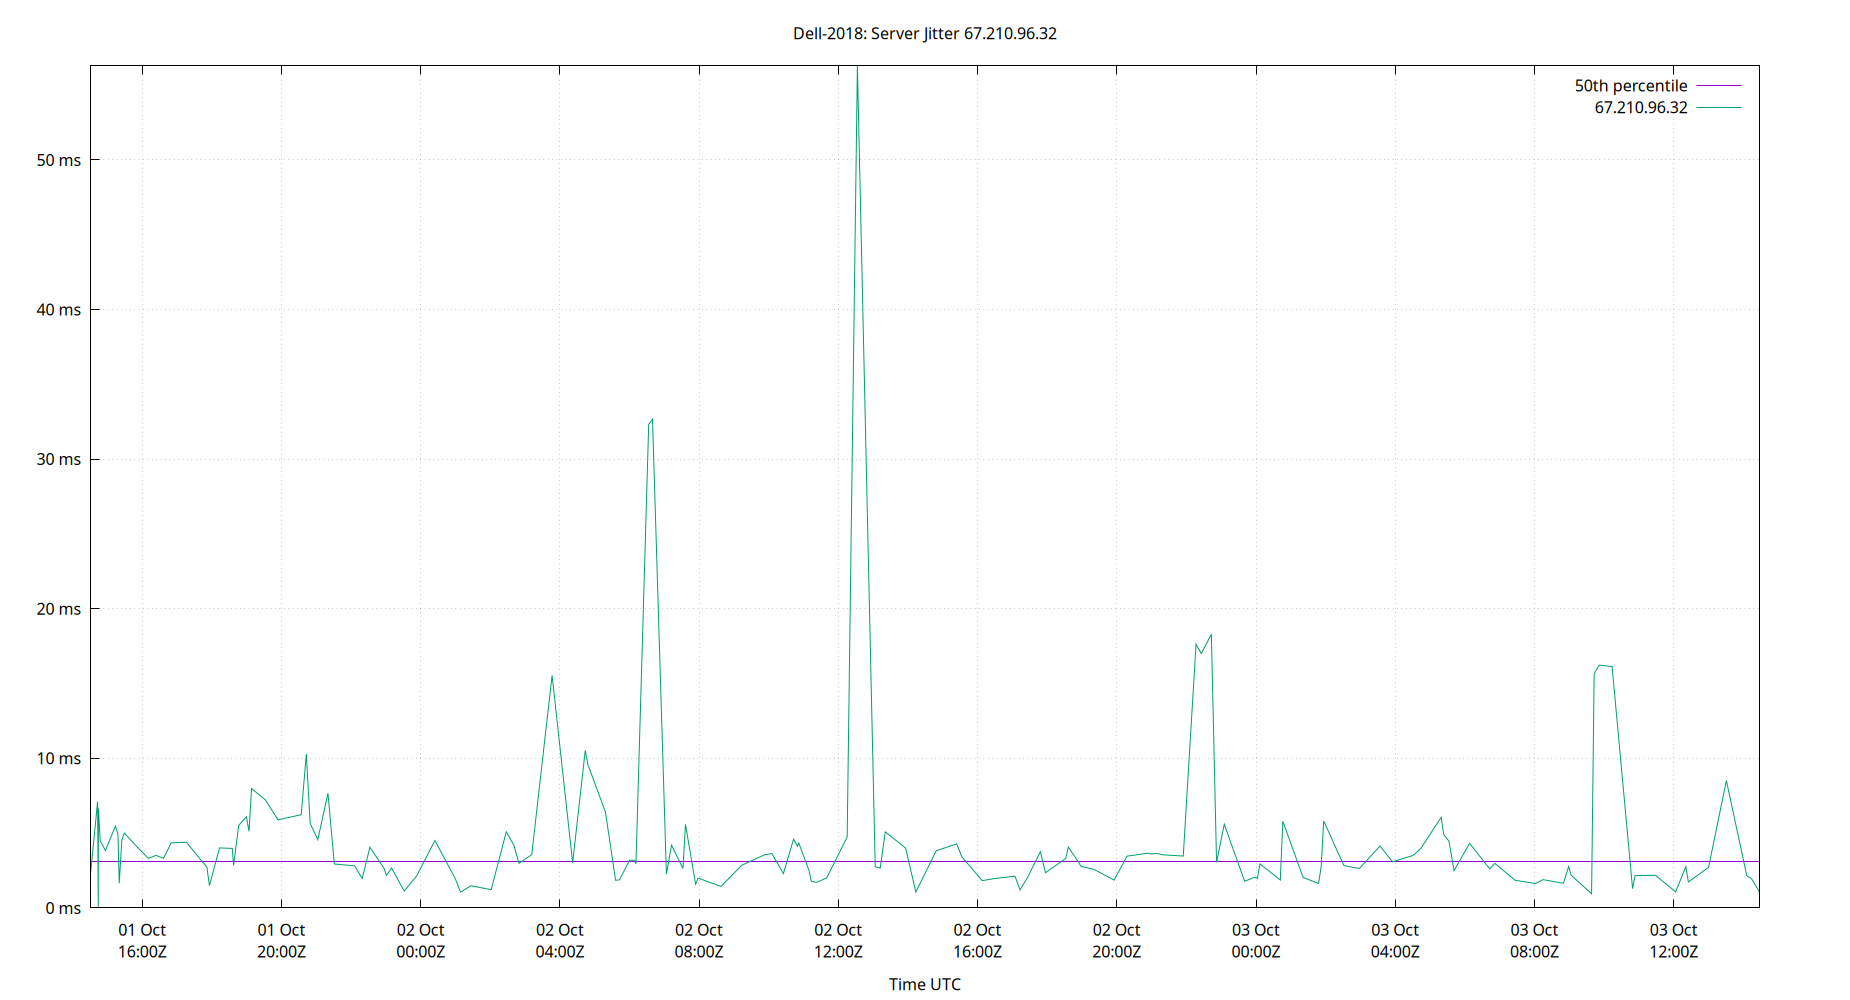
| Percentiles...... | Ranges...... | Skew- | Kurt- | |||||||||||||
| Name | Min | 1% | 5% | 50% | 95% | 99% | Max | 90% | 98% | StdDev | Mean | Units | ness | osis | ||
| Server Jitter 67.210.96.32 | 0.000 | 0.000 | 1.207 | 3.085 | 15.678 | 32.664 | 56.283 | 14.472 | 32.664 | 6.015 | 4.631 | ms | 5.327 | 39.04 | ||
The RMS Jitter of a server. Jitter is the current estimated dispersion, in other words the variation in offset between samples.
Closer to 0s is better. An ideal system would be a horizontal line at 0s.
RMS Jitter is field 8 in the peerstats log file.
Server Jitter 67.217.246.204

| Percentiles...... | Ranges...... | Skew- | Kurt- | |||||||||||||
| Name | Min | 1% | 5% | 50% | 95% | 99% | Max | 90% | 98% | StdDev | Mean | Units | ness | osis | ||
| Server Jitter 67.217.246.204 | 0.000 | 0.000 | 3.782 | 16.952 | 25.882 | 32.289 | 50.963 | 22.100 | 32.289 | 6.594 | 16.539 | ms | 0.03535 | 4.717 | ||
The RMS Jitter of a server. Jitter is the current estimated dispersion, in other words the variation in offset between samples.
Closer to 0s is better. An ideal system would be a horizontal line at 0s.
RMS Jitter is field 8 in the peerstats log file.
Server Jitter 68.183.147.240
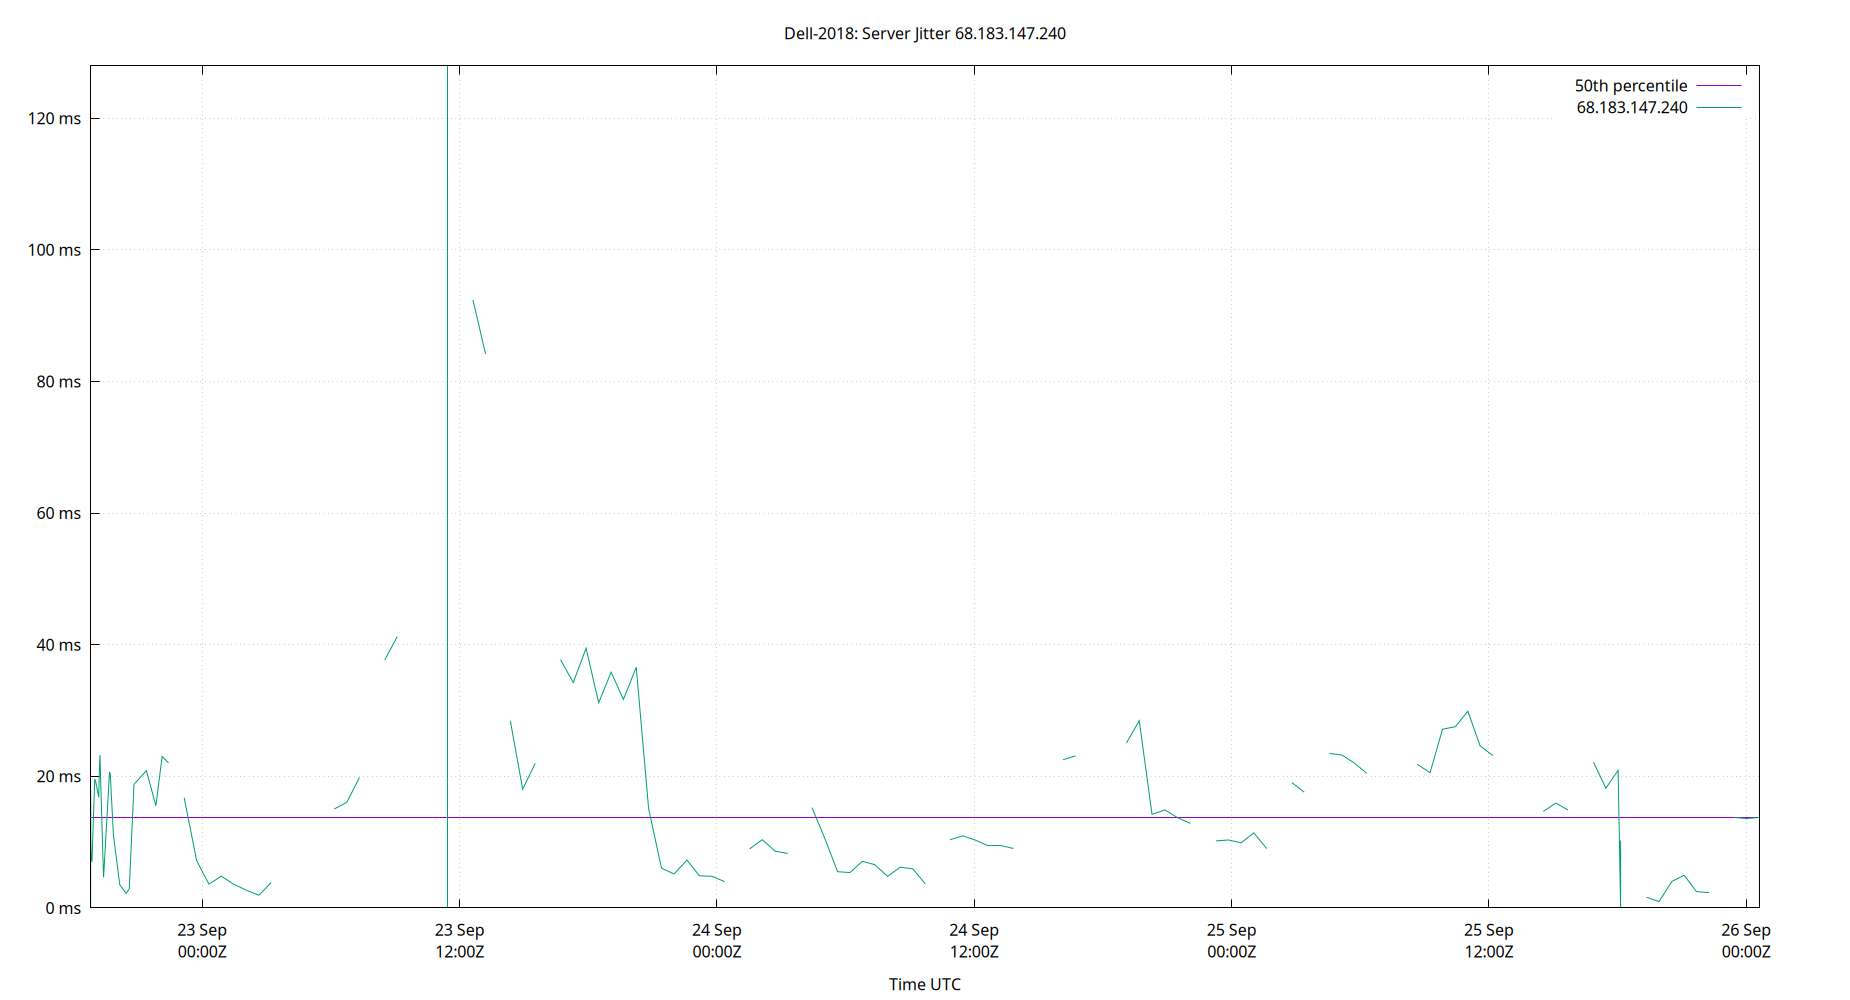
| Percentiles...... | Ranges...... | Skew- | Kurt- | |||||||||||||
| Name | Min | 1% | 5% | 50% | 95% | 99% | Max | 90% | 98% | StdDev | Mean | Units | ness | osis | ||
| Server Jitter 68.183.147.240 | 0.000 | 0.000 | 1.157 | 13.703 | 40.794 | 119.968 | 127.941 | 39.637 | 119.968 | 20.038 | 17.502 | ms | 3.439 | 17 | ||
The RMS Jitter of a server. Jitter is the current estimated dispersion, in other words the variation in offset between samples.
Closer to 0s is better. An ideal system would be a horizontal line at 0s.
RMS Jitter is field 8 in the peerstats log file.
Server Jitter 69.172.133.130

| Percentiles...... | Ranges...... | Skew- | Kurt- | |||||||||||||
| Name | Min | 1% | 5% | 50% | 95% | 99% | Max | 90% | 98% | StdDev | Mean | Units | ness | osis | ||
| Server Jitter 69.172.133.130 | 0.000 | 0.000 | 0.000 | 3.230 | 75.376 | 75.376 | 75.376 | 75.376 | 75.376 | 24.828 | 13.852 | ms | 1.682 | 4.021 | ||
The RMS Jitter of a server. Jitter is the current estimated dispersion, in other words the variation in offset between samples.
Closer to 0s is better. An ideal system would be a horizontal line at 0s.
RMS Jitter is field 8 in the peerstats log file.
Server Jitter 69.176.84.38

| Percentiles...... | Ranges...... | Skew- | Kurt- | |||||||||||||
| Name | Min | 1% | 5% | 50% | 95% | 99% | Max | 90% | 98% | StdDev | Mean | Units | ness | osis | ||
| Server Jitter 69.176.84.38 | 0.000 | 0.000 | 0.084 | 1.877 | 4.514 | 6.761 | 6.761 | 4.430 | 6.761 | 1.315 | 2.063 | ms | 1.34 | 5.848 | ||
The RMS Jitter of a server. Jitter is the current estimated dispersion, in other words the variation in offset between samples.
Closer to 0s is better. An ideal system would be a horizontal line at 0s.
RMS Jitter is field 8 in the peerstats log file.
Server Jitter 69.89.207.199

| Percentiles...... | Ranges...... | Skew- | Kurt- | |||||||||||||
| Name | Min | 1% | 5% | 50% | 95% | 99% | Max | 90% | 98% | StdDev | Mean | Units | ness | osis | ||
| Server Jitter 69.89.207.199 | 0.000 | 0.000 | 0.000 | 5.847 | 88.065 | 120.778 | 120.778 | 88.065 | 120.778 | 29.309 | 19.505 | ms | 2.034 | 6.432 | ||
The RMS Jitter of a server. Jitter is the current estimated dispersion, in other words the variation in offset between samples.
Closer to 0s is better. An ideal system would be a horizontal line at 0s.
RMS Jitter is field 8 in the peerstats log file.
Server Jitter 69.89.207.99

| Percentiles...... | Ranges...... | Skew- | Kurt- | |||||||||||||
| Name | Min | 1% | 5% | 50% | 95% | 99% | Max | 90% | 98% | StdDev | Mean | Units | ness | osis | ||
| Server Jitter 69.89.207.99 | 0.000 | 0.774 | 1.256 | 3.477 | 12.839 | 29.139 | 217.779 | 11.583 | 28.365 | 8.047 | 5.086 | ms | 12.96 | 272.4 | ||
The RMS Jitter of a server. Jitter is the current estimated dispersion, in other words the variation in offset between samples.
Closer to 0s is better. An ideal system would be a horizontal line at 0s.
RMS Jitter is field 8 in the peerstats log file.
Server Jitter 71.19.144.140

| Percentiles...... | Ranges...... | Skew- | Kurt- | |||||||||||||
| Name | Min | 1% | 5% | 50% | 95% | 99% | Max | 90% | 98% | StdDev | Mean | Units | ness | osis | ||
| Server Jitter 71.19.144.140 | 0.000 | 0.000 | 0.000 | 2.244 | 28.288 | 28.288 | 28.288 | 28.288 | 28.288 | 6.176 | 4.071 | ms | 3.331 | 13.18 | ||
The RMS Jitter of a server. Jitter is the current estimated dispersion, in other words the variation in offset between samples.
Closer to 0s is better. An ideal system would be a horizontal line at 0s.
RMS Jitter is field 8 in the peerstats log file.
Server Jitter 72.14.182.49

| Percentiles...... | Ranges...... | Skew- | Kurt- | |||||||||||||
| Name | Min | 1% | 5% | 50% | 95% | 99% | Max | 90% | 98% | StdDev | Mean | Units | ness | osis | ||
| Server Jitter 72.14.182.49 | 0.000 | 0.852 | 1.163 | 3.269 | 16.589 | 22.688 | 25.413 | 15.425 | 21.836 | 4.550 | 4.656 | ms | 2.49 | 9.16 | ||
The RMS Jitter of a server. Jitter is the current estimated dispersion, in other words the variation in offset between samples.
Closer to 0s is better. An ideal system would be a horizontal line at 0s.
RMS Jitter is field 8 in the peerstats log file.
Server Jitter 72.14.183.39

| Percentiles...... | Ranges...... | Skew- | Kurt- | |||||||||||||
| Name | Min | 1% | 5% | 50% | 95% | 99% | Max | 90% | 98% | StdDev | Mean | Units | ness | osis | ||
| Server Jitter 72.14.183.39 | 0.000 | 0.000 | 0.000 | 2.885 | 5.156 | 5.156 | 5.156 | 5.156 | 5.156 | 1.696 | 2.895 | ms | -0.4921 | 2.349 | ||
The RMS Jitter of a server. Jitter is the current estimated dispersion, in other words the variation in offset between samples.
Closer to 0s is better. An ideal system would be a horizontal line at 0s.
RMS Jitter is field 8 in the peerstats log file.
Server Jitter 72.14.186.59

| Percentiles...... | Ranges...... | Skew- | Kurt- | |||||||||||||
| Name | Min | 1% | 5% | 50% | 95% | 99% | Max | 90% | 98% | StdDev | Mean | Units | ness | osis | ||
| Server Jitter 72.14.186.59 | 0.000 | 0.000 | 0.232 | 2.515 | 7.822 | 13.480 | 13.480 | 7.590 | 13.480 | 2.909 | 3.730 | ms | 0.9794 | 3.718 | ||
The RMS Jitter of a server. Jitter is the current estimated dispersion, in other words the variation in offset between samples.
Closer to 0s is better. An ideal system would be a horizontal line at 0s.
RMS Jitter is field 8 in the peerstats log file.
Server Jitter 72.30.35.88
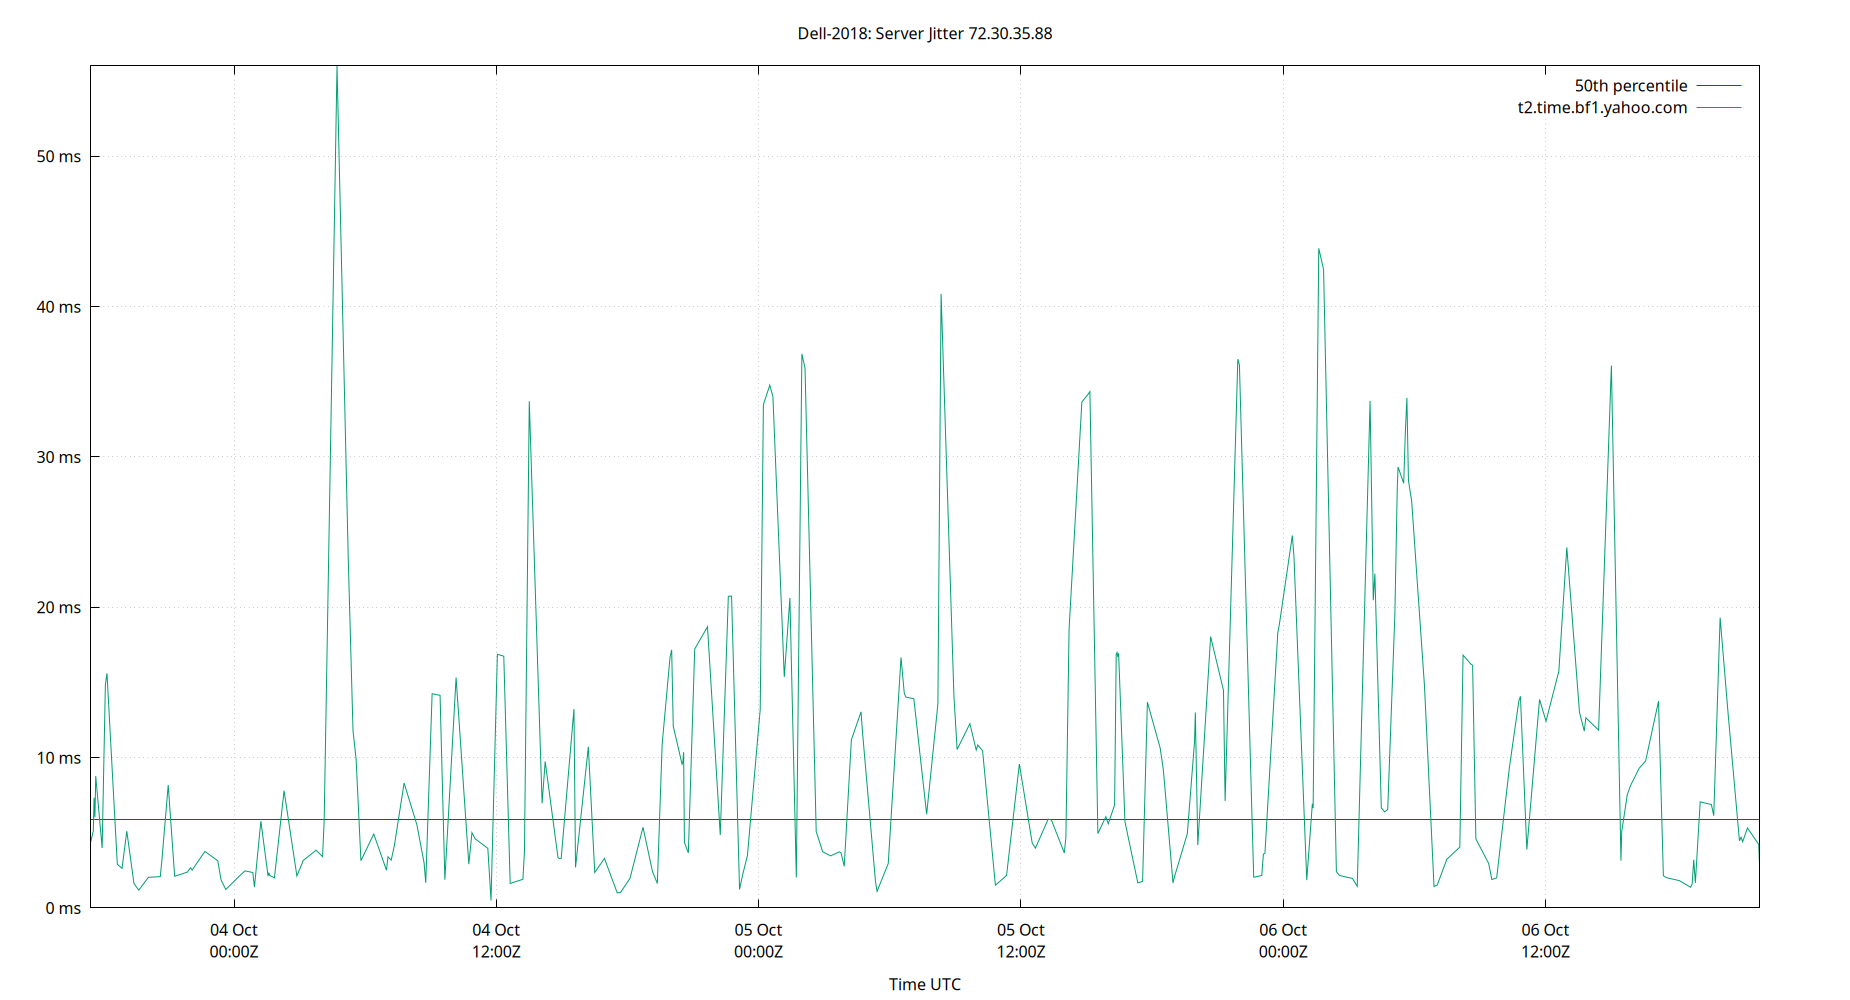
| Percentiles...... | Ranges...... | Skew- | Kurt- | |||||||||||||
| Name | Min | 1% | 5% | 50% | 95% | 99% | Max | 90% | 98% | StdDev | Mean | Units | ness | osis | ||
| Server Jitter 72.30.35.88 | 0.000 | 1.007 | 1.531 | 5.856 | 34.003 | 42.466 | 56.014 | 32.471 | 41.460 | 9.973 | 10.023 | ms | 1.675 | 5.678 | ||
The RMS Jitter of a server. Jitter is the current estimated dispersion, in other words the variation in offset between samples.
Closer to 0s is better. An ideal system would be a horizontal line at 0s.
RMS Jitter is field 8 in the peerstats log file.
Server Jitter 73.185.182.209

| Percentiles...... | Ranges...... | Skew- | Kurt- | |||||||||||||
| Name | Min | 1% | 5% | 50% | 95% | 99% | Max | 90% | 98% | StdDev | Mean | Units | ness | osis | ||
| Server Jitter 73.185.182.209 | 0.000 | 0.000 | 1.302 | 4.212 | 50.077 | 60.246 | 80.745 | 48.776 | 60.246 | 12.973 | 8.582 | ms | 3.195 | 13.04 | ||
The RMS Jitter of a server. Jitter is the current estimated dispersion, in other words the variation in offset between samples.
Closer to 0s is better. An ideal system would be a horizontal line at 0s.
RMS Jitter is field 8 in the peerstats log file.
Server Jitter 74.208.14.149

| Percentiles...... | Ranges...... | Skew- | Kurt- | |||||||||||||
| Name | Min | 1% | 5% | 50% | 95% | 99% | Max | 90% | 98% | StdDev | Mean | Units | ness | osis | ||
| Server Jitter 74.208.14.149 | 0.000 | 1.820 | 12.427 | 24.899 | 47.302 | 58.364 | 66.145 | 34.875 | 56.544 | 11.079 | 27.112 | ms | 0.5371 | 3.692 | ||
The RMS Jitter of a server. Jitter is the current estimated dispersion, in other words the variation in offset between samples.
Closer to 0s is better. An ideal system would be a horizontal line at 0s.
RMS Jitter is field 8 in the peerstats log file.
Server Jitter 77.37.97.124

| Percentiles...... | Ranges...... | Skew- | Kurt- | |||||||||||||
| Name | Min | 1% | 5% | 50% | 95% | 99% | Max | 90% | 98% | StdDev | Mean | Units | ness | osis | ||
| Server Jitter 77.37.97.124 | 0.000 | 0.000 | 2.796 | 32.332 | 77.851 | 100.698 | 150.671 | 75.056 | 100.698 | 24.623 | 34.958 | ms | 0.696 | 3.419 | ||
The RMS Jitter of a server. Jitter is the current estimated dispersion, in other words the variation in offset between samples.
Closer to 0s is better. An ideal system would be a horizontal line at 0s.
RMS Jitter is field 8 in the peerstats log file.
Server Jitter 77.42.37.85

| Percentiles...... | Ranges...... | Skew- | Kurt- | |||||||||||||
| Name | Min | 1% | 5% | 50% | 95% | 99% | Max | 90% | 98% | StdDev | Mean | Units | ness | osis | ||
| Server Jitter 77.42.37.85 | 0.000 | 0.900 | 1.851 | 19.516 | 80.597 | 96.805 | 116.085 | 78.746 | 95.905 | 26.687 | 29.693 | ms | 0.8002 | 2.536 | ||
The RMS Jitter of a server. Jitter is the current estimated dispersion, in other words the variation in offset between samples.
Closer to 0s is better. An ideal system would be a horizontal line at 0s.
RMS Jitter is field 8 in the peerstats log file.
Server Jitter 79.160.225.13

| Percentiles...... | Ranges...... | Skew- | Kurt- | |||||||||||||
| Name | Min | 1% | 5% | 50% | 95% | 99% | Max | 90% | 98% | StdDev | Mean | Units | ness | osis | ||
| Server Jitter 79.160.225.13 | 0.000 | 0.793 | 1.333 | 9.929 | 70.698 | 94.447 | 111.150 | 69.365 | 93.654 | 22.373 | 19.069 | ms | 1.697 | 5.375 | ||
The RMS Jitter of a server. Jitter is the current estimated dispersion, in other words the variation in offset between samples.
Closer to 0s is better. An ideal system would be a horizontal line at 0s.
RMS Jitter is field 8 in the peerstats log file.
Server Jitter 83.228.206.15

| Percentiles...... | Ranges...... | Skew- | Kurt- | |||||||||||||
| Name | Min | 1% | 5% | 50% | 95% | 99% | Max | 90% | 98% | StdDev | Mean | Units | ness | osis | ||
| Server Jitter 83.228.206.15 | 0.000 | 0.000 | 11.060 | 56.909 | 95.536 | 108.530 | 155.978 | 84.476 | 108.530 | 23.568 | 56.450 | ms | 0.05599 | 3.839 | ||
The RMS Jitter of a server. Jitter is the current estimated dispersion, in other words the variation in offset between samples.
Closer to 0s is better. An ideal system would be a horizontal line at 0s.
RMS Jitter is field 8 in the peerstats log file.
Server Jitter 91.224.149.196
| Percentiles...... | Ranges...... | Skew- | Kurt- | |||||||||||||
| Name | Min | 1% | 5% | 50% | 95% | 99% | Max | 90% | 98% | StdDev | Mean | Units | ness | osis | ||
| Server Jitter 91.224.149.196 | 0.000 | 0.000 | 5.567 | 42.234 | 78.395 | 110.514 | 111.344 | 72.829 | 110.514 | 21.756 | 41.560 | ms | 0.3254 | 3.369 | ||
The RMS Jitter of a server. Jitter is the current estimated dispersion, in other words the variation in offset between samples.
Closer to 0s is better. An ideal system would be a horizontal line at 0s.
RMS Jitter is field 8 in the peerstats log file.
Server Jitter 94.198.159.11

| Percentiles...... | Ranges...... | Skew- | Kurt- | |||||||||||||
| Name | Min | 1% | 5% | 50% | 95% | 99% | Max | 90% | 98% | StdDev | Mean | Units | ness | osis | ||
| Server Jitter 94.198.159.11 | 0.000 | 0.000 | 0.000 | 9.727 | 9.727 | 9.727 | 9.727 | 9.727 | 9.727 | 4.863 | 4.863 | ms | 0 | 1 | ||
The RMS Jitter of a server. Jitter is the current estimated dispersion, in other words the variation in offset between samples.
Closer to 0s is better. An ideal system would be a horizontal line at 0s.
RMS Jitter is field 8 in the peerstats log file.
Server Jitter 96.19.94.82

| Percentiles...... | Ranges...... | Skew- | Kurt- | |||||||||||||
| Name | Min | 1% | 5% | 50% | 95% | 99% | Max | 90% | 98% | StdDev | Mean | Units | ness | osis | ||
| Server Jitter 96.19.94.82 | 0.000 | 0.000 | 1.253 | 7.848 | 37.107 | 50.905 | 50.905 | 35.854 | 50.905 | 10.602 | 10.355 | ms | 1.853 | 6.49 | ||
The RMS Jitter of a server. Jitter is the current estimated dispersion, in other words the variation in offset between samples.
Closer to 0s is better. An ideal system would be a horizontal line at 0s.
RMS Jitter is field 8 in the peerstats log file.
Server Jitter 96.245.170.99
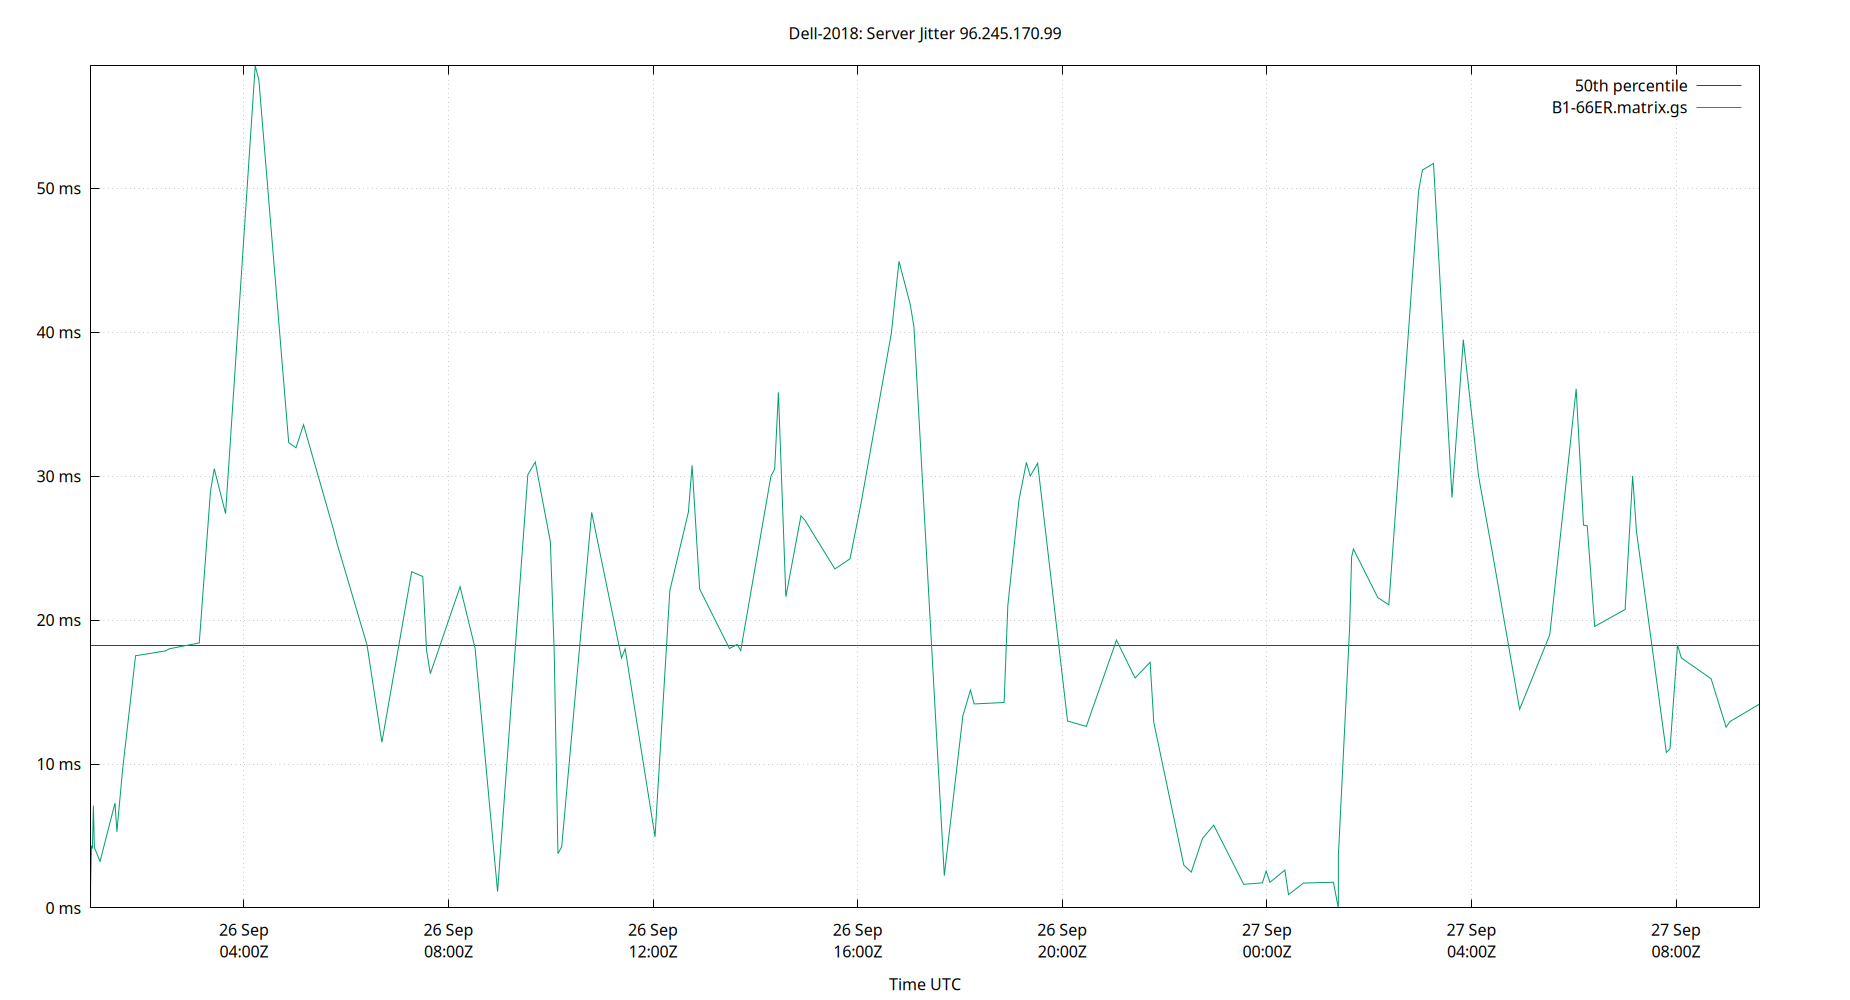
| Percentiles...... | Ranges...... | Skew- | Kurt- | |||||||||||||
| Name | Min | 1% | 5% | 50% | 95% | 99% | Max | 90% | 98% | StdDev | Mean | Units | ness | osis | ||
| Server Jitter 96.245.170.99 | 0.000 | 0.000 | 0.928 | 18.260 | 41.943 | 57.524 | 58.502 | 41.015 | 57.524 | 13.116 | 19.082 | ms | 0.5645 | 3.202 | ||
The RMS Jitter of a server. Jitter is the current estimated dispersion, in other words the variation in offset between samples.
Closer to 0s is better. An ideal system would be a horizontal line at 0s.
RMS Jitter is field 8 in the peerstats log file.
Server Jitter 99.28.14.242

| Percentiles...... | Ranges...... | Skew- | Kurt- | |||||||||||||
| Name | Min | 1% | 5% | 50% | 95% | 99% | Max | 90% | 98% | StdDev | Mean | Units | ness | osis | ||
| Server Jitter 99.28.14.242 | 0.000 | 0.830 | 1.274 | 3.858 | 18.821 | 70.147 | 200.156 | 17.547 | 69.316 | 13.898 | 6.849 | ms | 8.497 | 92.63 | ||
The RMS Jitter of a server. Jitter is the current estimated dispersion, in other words the variation in offset between samples.
Closer to 0s is better. An ideal system would be a horizontal line at 0s.
RMS Jitter is field 8 in the peerstats log file.
Server Jitter SHM(0)

| Percentiles...... | Ranges...... | Skew- | Kurt- | |||||||||||||
| Name | Min | 1% | 5% | 50% | 95% | 99% | Max | 90% | 98% | StdDev | Mean | Units | ness | osis | ||
| Server Jitter SHM(0) | 0.000 | 0.521 | 0.780 | 2.066 | 249.248 | 295.491 | 1,615.750 | 248.468 | 294.970 | 66.477 | 19.767 | ms | 3.732 | 18.07 | ||
The RMS Jitter of a server. Jitter is the current estimated dispersion, in other words the variation in offset between samples.
Closer to 0s is better. An ideal system would be a horizontal line at 0s.
RMS Jitter is field 8 in the peerstats log file.
Server Jitter SHM(1)

| Percentiles...... | Ranges...... | Skew- | Kurt- | |||||||||||||
| Name | Min | 1% | 5% | 50% | 95% | 99% | Max | 90% | 98% | StdDev | Mean | Units | ness | osis | ||
| Server Jitter SHM(1) | 0.000 | 0.158 | 0.201 | 0.311 | 0.485 | 0.649 | 1,591.279 | 0.284 | 0.491 | 9.619 | 0.453 | ms | 100 | 1.165e+04 | ||
The RMS Jitter of a server. Jitter is the current estimated dispersion, in other words the variation in offset between samples.
Closer to 0s is better. An ideal system would be a horizontal line at 0s.
RMS Jitter is field 8 in the peerstats log file.
Server Jitter SHM(2)

| Percentiles...... | Ranges...... | Skew- | Kurt- | |||||||||||||
| Name | Min | 1% | 5% | 50% | 95% | 99% | Max | 90% | 98% | StdDev | Mean | Units | ness | osis | ||
| Server Jitter SHM(2) | 0.000 | 0.689 | 1.023 | 2.503 | 5.883 | 7.760 | 2,002.029 | 4.860 | 7.071 | 21.199 | 3.181 | ms | 72.01 | 5511 | ||
The RMS Jitter of a server. Jitter is the current estimated dispersion, in other words the variation in offset between samples.
Closer to 0s is better. An ideal system would be a horizontal line at 0s.
RMS Jitter is field 8 in the peerstats log file.
Server Jitter SHM(3)

| Percentiles...... | Ranges...... | Skew- | Kurt- | |||||||||||||
| Name | Min | 1% | 5% | 50% | 95% | 99% | Max | 90% | 98% | StdDev | Mean | Units | ness | osis | ||
| Server Jitter SHM(3) | 0.000 | 0.163 | 0.203 | 0.307 | 0.472 | 0.587 | 2,001.141 | 0.270 | 0.424 | 15.613 | 0.500 | ms | 98.16 | 1.02e+04 | ||
The RMS Jitter of a server. Jitter is the current estimated dispersion, in other words the variation in offset between samples.
Closer to 0s is better. An ideal system would be a horizontal line at 0s.
RMS Jitter is field 8 in the peerstats log file.
Server Jitter SHM(4)

| Percentiles...... | Ranges...... | Skew- | Kurt- | |||||||||||||
| Name | Min | 1% | 5% | 50% | 95% | 99% | Max | 90% | 98% | StdDev | Mean | Units | ness | osis | ||
| Server Jitter SHM(4) | 0.000 | 0.462 | 0.715 | 1.781 | 4.115 | 5.613 | 9.498 | 3.400 | 5.151 | 1.084 | 2.018 | ms | 1.439 | 6.41 | ||
The RMS Jitter of a server. Jitter is the current estimated dispersion, in other words the variation in offset between samples.
Closer to 0s is better. An ideal system would be a horizontal line at 0s.
RMS Jitter is field 8 in the peerstats log file.
Server Jitter SHM(5)

| Percentiles...... | Ranges...... | Skew- | Kurt- | |||||||||||||
| Name | Min | 1% | 5% | 50% | 95% | 99% | Max | 90% | 98% | StdDev | Mean | Units | ness | osis | ||
| Server Jitter SHM(5) | 0.000 | 106.480 | 159.500 | 293.466 | 508.030 | 630.513 | 3,570.370 | 348.530 | 524.033 | 165.333 | 317.310 | µs | 8.706 | 137.8 | ||
The RMS Jitter of a server. Jitter is the current estimated dispersion, in other words the variation in offset between samples.
Closer to 0s is better. An ideal system would be a horizontal line at 0s.
RMS Jitter is field 8 in the peerstats log file.
Server Jitter SOCK(0)

| Percentiles...... | Ranges...... | Skew- | Kurt- | |||||||||||||
| Name | Min | 1% | 5% | 50% | 95% | 99% | Max | 90% | 98% | StdDev | Mean | Units | ness | osis | ||
| Server Jitter SOCK(0) | 0.000 | 0.469 | 0.676 | 1.595 | 3.766 | 5.349 | 19.068 | 3.090 | 4.880 | 1.132 | 1.850 | ms | 3.643 | 35.89 | ||
The RMS Jitter of a server. Jitter is the current estimated dispersion, in other words the variation in offset between samples.
Closer to 0s is better. An ideal system would be a horizontal line at 0s.
RMS Jitter is field 8 in the peerstats log file.
Server Jitter SOCK(1)

| Percentiles...... | Ranges...... | Skew- | Kurt- | |||||||||||||
| Name | Min | 1% | 5% | 50% | 95% | 99% | Max | 90% | 98% | StdDev | Mean | Units | ness | osis | ||
| Server Jitter SOCK(1) | 0.000 | 0.182 | 0.218 | 0.320 | 0.483 | 0.741 | 10.303 | 0.264 | 0.560 | 0.158 | 0.337 | ms | 21.81 | 1001 | ||
The RMS Jitter of a server. Jitter is the current estimated dispersion, in other words the variation in offset between samples.
Closer to 0s is better. An ideal system would be a horizontal line at 0s.
RMS Jitter is field 8 in the peerstats log file.
Server Jitter SOCK(2)

| Percentiles...... | Ranges...... | Skew- | Kurt- | |||||||||||||
| Name | Min | 1% | 5% | 50% | 95% | 99% | Max | 90% | 98% | StdDev | Mean | Units | ness | osis | ||
| Server Jitter SOCK(2) | 0.000 | 0.600 | 0.948 | 2.374 | 5.637 | 7.241 | 11.212 | 4.689 | 6.641 | 1.481 | 2.715 | ms | 1.233 | 5.001 | ||
The RMS Jitter of a server. Jitter is the current estimated dispersion, in other words the variation in offset between samples.
Closer to 0s is better. An ideal system would be a horizontal line at 0s.
RMS Jitter is field 8 in the peerstats log file.
Server Jitter SOCK(3)

| Percentiles...... | Ranges...... | Skew- | Kurt- | |||||||||||||
| Name | Min | 1% | 5% | 50% | 95% | 99% | Max | 90% | 98% | StdDev | Mean | Units | ness | osis | ||
| Server Jitter SOCK(3) | 0.000 | 0.198 | 0.221 | 0.317 | 0.445 | 0.494 | 9.633 | 0.224 | 0.296 | 0.108 | 0.324 | ms | 32.53 | 2306 | ||
The RMS Jitter of a server. Jitter is the current estimated dispersion, in other words the variation in offset between samples.
Closer to 0s is better. An ideal system would be a horizontal line at 0s.
RMS Jitter is field 8 in the peerstats log file.
Summary
| Percentiles...... | Ranges...... | Skew- | Kurt- | |||||||||||||
| Name | Min | 1% | 5% | 50% | 95% | 99% | Max | 90% | 98% | StdDev | Mean | Units | ness | osis | ||
| Local Clock Frequency Offset | -187.984 | 10.668 | 10.972 | 12.739 | 23.124 | 25.565 | 183.534 | 12.151 | 14.897 | 9.268 | 14.626 | ppm | -7.912 | 87.57 | ||
| Local Clock Time Offset | -127.900 | -8.371 | -6.974 | -1.421 | 0.282 | 0.695 | 121.205 | 7.256 | 9.066 | 2.995 | -2.393 | ms | -1.206 | 202.2 | ||
| Local RMS Frequency Jitter | 0.0000 | 0.0032 | 0.0039 | 0.064 | 0.423 | 0.824 | 96.849 | 0.419 | 0.821 | 1.256 | 0.167 | ppm | 42.3 | 2231 | ||
| Local RMS Time Jitter | 0.000 | 0.130 | 0.162 | 0.343 | 0.473 | 2.894 | 83.702 | 0.311 | 2.764 | 1.268 | 0.421 | ms | 31.78 | 1322 | ||
| Server Jitter 104.131.155.175 | 0.000 | 0.000 | 0.834 | 4.593 | 17.108 | 88.041 | 111.550 | 16.275 | 88.041 | 12.164 | 6.897 | ms | 6.433 | 48.73 | ||
| Server Jitter 104.152.220.5 | 0.000 | 0.000 | 0.000 | 0.888 | 2.438 | 2.438 | 2.438 | 2.438 | 2.438 | 0.710 | 1.068 | ms | 0.5336 | 2.756 | ||
| Server Jitter 104.232.0.123 | 0.000 | 0.000 | 0.000 | 3.344 | 4.768 | 4.768 | 4.768 | 4.768 | 4.768 | 1.498 | 2.672 | ms | -0.5272 | 2.194 | ||
| Server Jitter 104.234.61.117 | 0.000 | 0.735 | 1.495 | 3.548 | 13.550 | 26.903 | 29.916 | 12.055 | 26.168 | 4.494 | 4.883 | ms | 3.04 | 14.17 | ||
| Server Jitter 107.172.222.7 | 0.000 | 0.000 | 1.084 | 4.379 | 25.305 | 36.743 | 37.327 | 24.221 | 36.743 | 8.622 | 8.136 | ms | 1.606 | 4.837 | ||
| Server Jitter 108.61.215.221 | 0.000 | 0.714 | 1.150 | 4.505 | 26.091 | 34.413 | 41.318 | 24.940 | 33.698 | 8.433 | 8.402 | ms | 1.357 | 4.032 | ||
| Server Jitter 12.205.28.193 | 0.000 | 0.000 | 0.000 | 11.183 | 108.575 | 108.575 | 108.575 | 108.575 | 108.575 | 37.651 | 31.806 | ms | 0.9856 | 2.424 | ||
| Server Jitter 129.146.193.200 | 0.000 | 0.000 | 0.809 | 2.667 | 17.247 | 17.857 | 18.051 | 16.439 | 17.857 | 3.953 | 3.880 | ms | 2.33 | 8.207 | ||
| Server Jitter 129.250.35.250 | 0.000 | 0.000 | 1.317 | 4.421 | 13.783 | 159.937 | 160.090 | 12.466 | 159.937 | 16.049 | 6.795 | ms | 9.004 | 85.92 | ||
| Server Jitter 131.239.5.43 | 0.000 | 0.000 | 0.000 | 1.655 | 3.135 | 3.135 | 3.135 | 3.135 | 3.135 | 0.882 | 1.743 | ms | -0.2966 | 2.893 | ||
| Server Jitter 134.215.155.177 | 0.000 | 0.215 | 1.574 | 3.642 | 10.470 | 21.230 | 22.367 | 8.897 | 21.015 | 3.543 | 4.682 | ms | 2.633 | 11.95 | ||
| Server Jitter 136.244.88.170 | 0.000 | 0.000 | 1.438 | 52.845 | 95.857 | 101.959 | 115.431 | 94.419 | 101.959 | 26.303 | 50.947 | ms | -0.2059 | 2.744 | ||
| Server Jitter 137.190.2.4 | 0.000 | 0.000 | 0.000 | 8.346 | 83.883 | 83.883 | 83.883 | 83.883 | 83.883 | 25.677 | 16.869 | ms | 1.958 | 5.07 | ||
| Server Jitter 139.177.202.26 | 0.000 | 0.000 | 0.000 | 1.830 | 3.716 | 3.716 | 3.716 | 3.716 | 3.716 | 1.177 | 1.625 | ms | 0.3916 | 2.367 | ||
| Server Jitter 139.84.137.244 | 0.000 | 1.131 | 3.660 | 23.593 | 63.864 | 79.789 | 171.675 | 60.204 | 78.658 | 18.877 | 27.084 | ms | 1.288 | 6.797 | ||
| Server Jitter 139.94.144.123 | 0.000 | 0.000 | 0.000 | 1.501 | 2.945 | 2.945 | 2.945 | 2.945 | 2.945 | 1.260 | 1.529 | ms | 0.002279 | 1.271 | ||
| Server Jitter 141.11.89.193 | 0.000 | 0.753 | 1.179 | 4.911 | 26.490 | 37.783 | 47.502 | 25.312 | 37.030 | 8.477 | 8.215 | ms | 1.982 | 7.242 | ||
| Server Jitter 142.202.190.19 | 0.000 | 0.000 | 0.000 | 2.202 | 33.553 | 33.553 | 33.553 | 33.553 | 33.553 | 7.428 | 4.893 | ms | 2.967 | 11.73 | ||
| Server Jitter 142.248.80.92 | 0.000 | 0.000 | 0.000 | 11.676 | 38.656 | 38.656 | 38.656 | 38.656 | 38.656 | 16.777 | 15.000 | ms | 0.5537 | 1.464 | ||
| Server Jitter 143.42.229.154 | 0.000 | 0.729 | 1.313 | 5.036 | 31.083 | 50.106 | 52.766 | 29.770 | 49.377 | 9.739 | 8.999 | ms | 2.179 | 8.427 | ||
| Server Jitter 144.202.0.197 | 0.000 | 0.000 | 1.476 | 12.023 | 42.042 | 230.623 | 231.516 | 40.566 | 230.623 | 29.493 | 18.297 | ms | 5.532 | 38.73 | ||
| Server Jitter 144.202.41.38 | 0.000 | 0.000 | 0.000 | 5.577 | 14.889 | 14.889 | 14.889 | 14.889 | 14.889 | 4.476 | 5.400 | ms | 0.4994 | 2.437 | ||
| Server Jitter 144.202.62.209 | 0.000 | 0.000 | 1.137 | 3.703 | 18.598 | 217.349 | 311.298 | 17.462 | 217.349 | 30.716 | 9.133 | ms | 7.378 | 59.79 | ||
| Server Jitter 144.202.66.214 | 0.000 | 0.718 | 1.239 | 3.846 | 17.964 | 43.753 | 123.164 | 16.725 | 43.034 | 9.165 | 6.161 | ms | 6.53 | 62.37 | ||
| Server Jitter 144.31.251.154 | 0.000 | 0.000 | 0.000 | 19.833 | 74.107 | 74.107 | 74.107 | 74.107 | 74.107 | 32.568 | 34.054 | ms | 0.1749 | 1.143 | ||
| Server Jitter 144.76.66.157 | 0.000 | 0.000 | 0.000 | 22.537 | 39.690 | 39.690 | 39.690 | 39.690 | 39.690 | 12.862 | 20.083 | ms | -0.2726 | 2.012 | ||
| Server Jitter 147.88.195.53 | 0.000 | 0.000 | 0.000 | 43.100 | 85.739 | 95.602 | 103.980 | 85.739 | 95.602 | 23.225 | 42.442 | ms | 0.007513 | 2.759 | ||
| Server Jitter 148.163.226.148 | 0.000 | 0.000 | 0.000 | 0.817 | 80.131 | 80.131 | 80.131 | 80.131 | 80.131 | 25.414 | 13.052 | ms | 1.993 | 5.456 | ||
| Server Jitter 149.248.12.167 | 0.000 | 0.000 | 0.000 | 5.393 | 14.159 | 15.551 | 15.551 | 14.159 | 15.551 | 4.042 | 5.981 | ms | 0.6682 | 2.543 | ||
| Server Jitter 149.28.200.179 | 0.000 | 0.000 | 1.112 | 3.393 | 13.171 | 65.088 | 74.406 | 12.058 | 65.088 | 8.936 | 5.598 | ms | 5.35 | 35.8 | ||
| Server Jitter 149.28.61.105 | 0.000 | 0.574 | 1.180 | 5.015 | 36.641 | 56.964 | 197.074 | 35.461 | 56.390 | 13.075 | 10.134 | ms | 4.144 | 37.12 | ||
| Server Jitter 151.236.20.166 | 0.000 | 1.259 | 1.527 | 3.486 | 15.315 | 62.462 | 73.702 | 13.788 | 61.203 | 9.812 | 5.895 | ms | 4.933 | 28.97 | ||
| Server Jitter 155.248.196.28 | 0.000 | 0.355 | 0.902 | 3.193 | 9.792 | 16.282 | 21.738 | 8.891 | 15.927 | 3.015 | 3.977 | ms | 2.004 | 8.991 | ||
| Server Jitter 157.245.125.229 | 0.000 | 0.743 | 1.227 | 6.519 | 33.986 | 58.212 | 77.920 | 32.759 | 57.469 | 11.400 | 10.738 | ms | 2.201 | 9.15 | ||
| Server Jitter 158.51.99.19 | 0.000 | 0.000 | 1.215 | 3.556 | 16.983 | 23.734 | 52.793 | 15.768 | 23.734 | 5.603 | 5.117 | ms | 3.979 | 25.61 | ||
| Server Jitter 159.203.158.197 | 0.000 | 0.000 | 0.970 | 3.679 | 28.068 | 35.073 | 59.229 | 27.098 | 35.073 | 8.869 | 6.920 | ms | 2.834 | 12.9 | ||
| Server Jitter 161.35.230.200 | 0.000 | 0.000 | 0.000 | 1.722 | 4.765 | 5.072 | 5.072 | 4.765 | 5.072 | 1.384 | 2.182 | ms | 0.4533 | 2.424 | ||
| Server Jitter 162.159.200.1 | 0.000 | 0.611 | 1.086 | 3.495 | 11.634 | 23.568 | 200.939 | 10.549 | 22.957 | 7.746 | 4.920 | ms | 11.88 | 210.7 | ||
| Server Jitter 162.159.200.123 | 0.000 | 0.418 | 1.100 | 3.151 | 14.477 | 45.117 | 89.291 | 13.377 | 44.699 | 7.592 | 4.952 | ms | 6.698 | 61.34 | ||
| Server Jitter 162.244.81.139 | 0.000 | 0.000 | 1.693 | 12.794 | 49.214 | 241.378 | 310.114 | 47.521 | 241.378 | 38.806 | 21.014 | ms | 5.115 | 31.27 | ||
| Server Jitter 162.254.225.151 | 0.000 | 3.082 | 8.987 | 32.115 | 61.363 | 75.521 | 82.844 | 52.376 | 72.439 | 15.378 | 33.549 | ms | 0.483 | 3.374 | ||
| Server Jitter 162.254.225.152 | 0.000 | 0.000 | 0.000 | 8.593 | 27.885 | 27.885 | 27.885 | 27.885 | 27.885 | 9.771 | 11.475 | ms | 0.5127 | 1.898 | ||
| Server Jitter 163.123.152.14 | 0.000 | 0.000 | 0.000 | 3.728 | 4.357 | 4.357 | 4.357 | 4.357 | 4.357 | 1.674 | 2.791 | ms | -0.9099 | 2.151 | ||
| Server Jitter 163.123.153.14 | 0.000 | 0.899 | 1.455 | 4.019 | 16.420 | 57.022 | 82.597 | 14.965 | 56.123 | 9.692 | 6.311 | ms | 5.555 | 37.74 | ||
| Server Jitter 166.88.142.52 | 0.000 | 0.000 | 0.000 | 1.075 | 3.927 | 3.927 | 3.927 | 3.927 | 3.927 | 1.133 | 1.349 | ms | 1.419 | 4.128 | ||
| Server Jitter 168.235.89.132 | 0.000 | 0.000 | 1.451 | 6.551 | 24.642 | 241.813 | 312.601 | 23.191 | 241.813 | 41.436 | 15.557 | ms | 5.318 | 31.48 | ||
| Server Jitter 170.187.147.56 | 0.000 | 0.346 | 1.042 | 3.020 | 13.585 | 35.711 | 154.182 | 12.543 | 35.365 | 8.619 | 5.057 | ms | 10.79 | 170.1 | ||
| Server Jitter 171.66.97.126 | 0.000 | 0.000 | 0.934 | 2.691 | 18.421 | 98.115 | 126.152 | 17.487 | 98.115 | 14.936 | 5.909 | ms | 6.169 | 42.32 | ||
| Server Jitter 172.104.28.175 | 0.000 | 0.000 | 0.000 | 3.258 | 3.451 | 3.451 | 3.451 | 3.451 | 3.451 | 1.418 | 2.445 | ms | -1.124 | 2.31 | ||
| Server Jitter 172.232.15.202 | 0.000 | 0.000 | 0.000 | 3.215 | 33.540 | 33.540 | 33.540 | 33.540 | 33.540 | 13.913 | 13.115 | ms | 0.3783 | 1.284 | ||
| Server Jitter 172.233.153.85 | 0.000 | 0.000 | 1.067 | 4.764 | 14.089 | 23.765 | 302.556 | 13.022 | 23.765 | 29.458 | 8.479 | ms | 9.659 | 96.43 | ||
| Server Jitter 172.233.155.39 | 0.000 | 0.000 | 0.857 | 2.798 | 13.575 | 19.709 | 19.951 | 12.718 | 19.709 | 3.872 | 3.811 | ms | 2.816 | 11.19 | ||
| Server Jitter 172.233.157.223 | 0.000 | 0.000 | 1.134 | 3.693 | 17.831 | 227.721 | 477.649 | 16.697 | 227.721 | 41.160 | 10.833 | ms | 7.887 | 73.89 | ||
| Server Jitter 172.233.177.198 | 0.000 | 0.000 | 0.000 | 5.156 | 9.581 | 9.581 | 9.581 | 9.581 | 9.581 | 2.646 | 5.415 | ms | -0.2803 | 2.993 | ||
| Server Jitter 172.233.189.68 | 0.000 | 0.000 | 0.599 | 17.934 | 37.387 | 49.953 | 52.151 | 36.788 | 49.953 | 11.734 | 17.669 | ms | 0.4156 | 2.82 | ||
| Server Jitter 172.234.25.10 | 0.000 | 0.000 | 1.002 | 3.849 | 11.993 | 15.117 | 20.475 | 10.991 | 15.117 | 3.352 | 4.781 | ms | 1.687 | 6.835 | ||
| Server Jitter 172.234.37.140 | 0.000 | 0.000 | 0.964 | 4.951 | 38.858 | 76.993 | 110.008 | 37.894 | 76.993 | 16.647 | 11.284 | ms | 3.198 | 14.54 | ||
| Server Jitter 172.234.44.141 | 0.000 | 0.000 | 1.217 | 9.440 | 37.592 | 42.602 | 60.768 | 36.376 | 42.602 | 11.543 | 12.278 | ms | 1.444 | 5.242 | ||
| Server Jitter 172.235.154.118 | 0.000 | 0.000 | 1.535 | 20.649 | 53.942 | 63.342 | 63.958 | 52.407 | 63.342 | 14.580 | 22.437 | ms | 0.8483 | 3.724 | ||
| Server Jitter 172.235.60.8 | 0.000 | 0.773 | 1.154 | 3.472 | 14.471 | 27.652 | 74.064 | 13.318 | 26.879 | 5.681 | 4.934 | ms | 5.261 | 44.65 | ||
| Server Jitter 172.238.164.57 | 0.000 | 0.651 | 1.077 | 3.190 | 12.196 | 22.320 | 98.321 | 11.119 | 21.670 | 6.582 | 4.553 | ms | 9.34 | 119.8 | ||
| Server Jitter 172.245.210.108 | 0.000 | 0.000 | 0.000 | 3.191 | 187.963 | 208.084 | 208.084 | 187.963 | 208.084 | 52.818 | 21.295 | ms | 2.724 | 8.749 | ||
| Server Jitter 173.249.203.227 | 0.000 | 0.000 | 0.000 | 2.338 | 5.843 | 5.843 | 5.843 | 5.843 | 5.843 | 1.587 | 2.822 | ms | 0.3165 | 2.627 | ||
| Server Jitter 173.255.230.96 | 0.000 | 0.000 | 1.050 | 3.510 | 18.774 | 67.403 | 67.650 | 17.724 | 67.403 | 9.020 | 6.895 | ms | 3.984 | 24.19 | ||
| Server Jitter 173.255.255.133 | 0.000 | 0.000 | 0.000 | 4.005 | 4.530 | 4.530 | 4.530 | 4.530 | 4.530 | 1.752 | 2.866 | ms | -0.8115 | 2.037 | ||
| Server Jitter 178.156.185.92 | 0.000 | 0.657 | 1.198 | 6.232 | 36.386 | 60.264 | 69.113 | 35.188 | 59.607 | 11.634 | 10.482 | ms | 2.26 | 9.133 | ||
| Server Jitter 185.214.143.237 | 0.000 | 0.000 | 0.849 | 3.509 | 24.075 | 66.532 | 66.532 | 23.226 | 66.532 | 12.782 | 6.885 | ms | 4.143 | 19.26 | ||
| Server Jitter 185.234.20.134 | 0.000 | 0.000 | 0.508 | 39.811 | 79.288 | 185.571 | 206.604 | 78.780 | 185.571 | 30.495 | 40.818 | ms | 2.363 | 12.83 | ||
| Server Jitter 192.207.55.254 | 0.000 | 0.000 | 1.395 | 5.353 | 78.059 | 132.954 | 134.633 | 76.664 | 132.954 | 30.185 | 17.569 | ms | 2.68 | 9.499 | ||
| Server Jitter 192.231.84.117 | 0.000 | 0.000 | 0.904 | 2.731 | 111.990 | 114.301 | 114.301 | 111.086 | 114.301 | 31.413 | 15.471 | ms | 2.543 | 7.959 | ||
| Server Jitter 192.231.84.118 | 0.000 | 0.934 | 1.393 | 3.578 | 10.863 | 66.268 | 69.847 | 9.470 | 65.334 | 7.525 | 5.026 | ms | 7.106 | 58.43 | ||
| Server Jitter 192.48.105.15 | 0.000 | 0.000 | 7.808 | 30.985 | 62.953 | 81.489 | 85.309 | 55.145 | 81.489 | 17.040 | 34.378 | ms | 0.4215 | 2.981 | ||
| Server Jitter 193.29.63.226 | 0.000 | 0.000 | 0.000 | 2.854 | 7.768 | 7.768 | 7.768 | 7.768 | 7.768 | 1.838 | 2.982 | ms | 1.078 | 4.127 | ||
| Server Jitter 194.0.5.123 | 0.000 | 0.755 | 1.143 | 3.328 | 12.639 | 24.435 | 398.640 | 11.495 | 23.680 | 8.165 | 4.868 | ms | 16.34 | 463.6 | ||
| Server Jitter 198.137.202.56 | 0.000 | 0.765 | 1.186 | 3.435 | 13.890 | 31.984 | 170.481 | 12.704 | 31.219 | 9.067 | 5.251 | ms | 10.1 | 140.9 | ||
| Server Jitter 198.206.187.98 | 0.000 | 0.000 | 0.000 | 2.747 | 29.704 | 29.704 | 29.704 | 29.704 | 29.704 | 11.123 | 7.569 | ms | 1.462 | 3.202 | ||
| Server Jitter 198.23.132.33 | 0.000 | 0.000 | 0.000 | 3.835 | 12.113 | 12.113 | 12.113 | 12.113 | 12.113 | 3.497 | 4.943 | ms | 0.7304 | 2.789 | ||
| Server Jitter 198.46.254.130 | 0.000 | 0.000 | 0.999 | 3.685 | 17.434 | 36.558 | 41.450 | 16.435 | 36.558 | 6.279 | 5.702 | ms | 2.802 | 13.08 | ||
| Server Jitter 198.60.22.240 | 0.000 | 0.000 | 0.000 | 1.229 | 8.123 | 8.123 | 8.123 | 8.123 | 8.123 | 2.808 | 2.774 | ms | 0.7715 | 2.116 | ||
| Server Jitter 198.71.50.75 | 0.000 | 1.525 | 3.734 | 23.735 | 49.077 | 91.787 | 92.484 | 45.343 | 90.262 | 15.505 | 24.891 | ms | 1.557 | 7.619 | ||
| Server Jitter 199.68.201.237 | 0.000 | 1.108 | 1.497 | 4.379 | 13.223 | 24.575 | 59.461 | 11.726 | 23.467 | 4.609 | 5.470 | ms | 4.52 | 39.75 | ||
| Server Jitter 20.55.26.153 | 0.000 | 0.000 | 0.000 | 6.632 | 74.079 | 74.079 | 74.079 | 74.079 | 74.079 | 25.471 | 19.985 | ms | 1.005 | 2.423 | ||
| Server Jitter 2001:1600:13:101::16b7 | 0.000 | 6.381 | 8.865 | 27.341 | 63.554 | 76.237 | 194.366 | 54.689 | 69.856 | 19.414 | 30.805 | ms | 1.848 | 13 | ||
| Server Jitter 2001:19f0:1590:5123:1057:a11:da7a:1 (lithium.constant.com) | 0.000 | 0.000 | 0.000 | 6.706 | 10.790 | 10.790 | 10.790 | 10.790 | 10.790 | 3.771 | 6.760 | ms | -0.8058 | 2.409 | ||
| Server Jitter 2001:19f0:6401:400:5400:4ff:fec3:522a | 0.000 | 0.000 | 0.000 | 8.886 | 24.636 | 24.636 | 24.636 | 24.636 | 24.636 | 9.634 | 8.939 | ms | 0.7974 | 2.006 | ||
| Server Jitter 2001:418:3ff::53 (x.ns.gin.ntt.net) | 0.000 | 0.000 | 0.000 | 14.048 | 17.951 | 17.951 | 17.951 | 17.951 | 17.951 | 7.508 | 10.420 | ms | -0.3643 | 1.295 | ||
| Server Jitter 2001:41d0:303:65e9::1 | 0.000 | 1.638 | 5.026 | 24.360 | 63.536 | 94.275 | 441.235 | 58.511 | 92.637 | 27.238 | 29.563 | ms | 7.074 | 97.1 | ||
| Server Jitter 2001:470:1f07:24f::123 | 0.000 | 0.000 | 0.000 | 25.254 | 42.613 | 42.613 | 42.613 | 42.613 | 42.613 | 13.314 | 18.607 | ms | 0.05496 | 1.858 | ||
| Server Jitter 2001:470:a:b4::2 (dell-2018.jamesb912.com.) | 0.000 | 0.000 | 0.000 | 0.000 | 0.000 | 0.000 | 0.000 | 0.000 | 0.000 | 0.000 | 0.000 | ns | nan | nan | ||
| Server Jitter 2001:4998:c:1028::1001 (t2.time.gq1.yahoo.com) | 0.000 | 0.830 | 1.150 | 3.284 | 24.575 | 55.936 | 146.741 | 23.425 | 55.106 | 10.291 | 6.585 | ms | 4.523 | 32.1 | ||
| Server Jitter 2001:559:2be:3::1001 | 0.000 | 0.000 | 0.000 | 2.623 | 4.670 | 4.670 | 4.670 | 4.670 | 4.670 | 1.301 | 2.709 | ms | -0.4538 | 2.918 | ||
| Server Jitter 2001:678:8::123 (any.time.nl) | 0.000 | 1.336 | 2.466 | 22.769 | 84.523 | 104.133 | 240.582 | 82.057 | 102.797 | 26.853 | 31.178 | ms | 0.982 | 3.468 | ||
| Server Jitter 204.2.134.173 | 0.000 | 0.737 | 1.155 | 3.937 | 11.016 | 25.193 | 273.013 | 9.861 | 24.456 | 16.748 | 5.825 | ms | 14.91 | 236.2 | ||
| Server Jitter 206.210.192.99 | 0.000 | 0.000 | 0.000 | 2.291 | 4.456 | 4.456 | 4.456 | 4.456 | 4.456 | 1.344 | 2.379 | ms | 0.04821 | 2.401 | ||
| Server Jitter 207.244.103.95 | 0.000 | 0.000 | 0.797 | 28.422 | 57.233 | 62.990 | 62.990 | 56.436 | 62.990 | 14.523 | 27.944 | ms | 0.1276 | 2.827 | ||
| Server Jitter 208.113.130.146 | 0.000 | 0.726 | 1.226 | 4.463 | 28.136 | 54.240 | 78.971 | 26.910 | 53.514 | 10.217 | 8.334 | ms | 3.109 | 15.87 | ||
| Server Jitter 208.70.148.101 | 0.000 | 0.000 | 0.964 | 2.831 | 12.191 | 22.101 | 23.669 | 11.227 | 22.101 | 4.129 | 4.033 | ms | 2.823 | 11.77 | ||
| Server Jitter 209.177.158.85 | 0.000 | 0.638 | 1.059 | 3.381 | 16.552 | 42.861 | 76.463 | 15.494 | 42.223 | 7.143 | 5.333 | ms | 5.146 | 38.96 | ||
| Server Jitter 209.205.228.50 | 0.000 | 0.000 | 0.000 | 6.067 | 10.822 | 10.822 | 10.822 | 10.822 | 10.822 | 3.658 | 6.881 | ms | -0.5453 | 2.24 | ||
| Server Jitter 209.253.210.112 | 0.000 | 1.893 | 2.233 | 18.138 | 48.038 | 56.088 | 62.499 | 45.805 | 54.195 | 14.503 | 20.120 | ms | 0.811 | 2.847 | ||
| Server Jitter 209.51.161.238 | 0.000 | 0.000 | 1.680 | 15.367 | 64.068 | 97.556 | 115.689 | 62.388 | 97.556 | 19.899 | 20.779 | ms | 1.928 | 7.566 | ||
| Server Jitter 212.227.240.160 | 0.000 | 0.000 | 1.327 | 4.654 | 37.570 | 39.142 | 39.142 | 36.243 | 39.142 | 12.540 | 10.553 | ms | 1.465 | 3.395 | ||
| Server Jitter 213.108.170.26 | 0.000 | 0.000 | 0.000 | 23.112 | 39.710 | 39.710 | 39.710 | 39.710 | 39.710 | 14.142 | 18.806 | ms | 0.06097 | 1.708 | ||
| Server Jitter 216.229.0.50 | 0.000 | 0.000 | 0.000 | 6.077 | 14.009 | 14.099 | 14.099 | 14.009 | 14.099 | 3.875 | 6.718 | ms | 0.1996 | 2.38 | ||
| Server Jitter 216.229.4.66 | 0.000 | 0.000 | 0.992 | 3.058 | 10.014 | 18.864 | 19.868 | 9.021 | 18.864 | 3.422 | 3.917 | ms | 2.487 | 10.06 | ||
| Server Jitter 216.250.115.174 | 0.000 | 0.000 | 1.073 | 19.436 | 53.936 | 81.386 | 83.847 | 52.863 | 81.386 | 17.176 | 23.147 | ms | 1.115 | 4.292 | ||
| Server Jitter 216.66.48.42 | 0.000 | 0.000 | 2.641 | 25.978 | 59.408 | 65.378 | 72.744 | 56.767 | 65.378 | 15.554 | 27.857 | ms | 0.5488 | 2.961 | ||
| Server Jitter 216.82.35.115 | 0.000 | 0.000 | 0.000 | 17.805 | 45.013 | 45.013 | 45.013 | 45.013 | 45.013 | 13.064 | 18.801 | ms | 0.1825 | 1.945 | ||
| Server Jitter 217.197.83.230 | 0.000 | 0.000 | 4.956 | 46.750 | 84.140 | 255.815 | 572.672 | 79.184 | 255.815 | 48.779 | 49.959 | ms | 6.93 | 67.75 | ||
| Server Jitter 23.111.186.186 | 0.000 | 0.000 | 0.000 | 1.132 | 1.974 | 1.974 | 1.974 | 1.974 | 1.974 | 0.537 | 1.129 | ms | -0.4905 | 3.028 | ||
| Server Jitter 23.141.40.123 | 0.000 | 0.000 | 0.000 | 3.979 | 5.911 | 5.911 | 5.911 | 5.911 | 5.911 | 1.921 | 3.290 | ms | -0.4708 | 2.11 | ||
| Server Jitter 23.142.248.8 | 0.000 | 0.697 | 1.158 | 4.634 | 17.883 | 23.569 | 194.491 | 16.725 | 22.872 | 8.013 | 6.998 | ms | 11.92 | 270.9 | ||
| Server Jitter 23.142.248.9 | 0.000 | 0.000 | 0.000 | 2.025 | 187.757 | 223.573 | 223.573 | 187.757 | 223.573 | 59.842 | 25.642 | ms | 2.394 | 7.022 | ||
| Server Jitter 23.143.196.199 | 0.000 | 0.000 | 0.000 | 1.033 | 2.250 | 2.250 | 2.250 | 2.250 | 2.250 | 0.756 | 1.094 | ms | -0.06783 | 1.795 | ||
| Server Jitter 23.143.196.201 | 0.000 | 0.947 | 1.274 | 3.631 | 11.912 | 30.762 | 56.127 | 10.638 | 29.814 | 5.955 | 4.936 | ms | 5.525 | 42.13 | ||
| Server Jitter 23.143.196.204 | 0.000 | 0.000 | 1.619 | 5.871 | 65.017 | 89.728 | 93.365 | 63.399 | 89.728 | 20.442 | 13.760 | ms | 2.255 | 6.963 | ||
| Server Jitter 23.150.40.242 | 0.000 | 0.000 | 0.000 | 7.670 | 312.076 | 312.076 | 312.076 | 312.076 | 312.076 | 113.085 | 95.475 | ms | 0.6106 | 1.686 | ||
| Server Jitter 23.150.41.122 | 0.000 | 0.796 | 1.190 | 3.307 | 13.542 | 32.912 | 36.946 | 12.352 | 32.116 | 4.892 | 4.685 | ms | 3.705 | 20.28 | ||
| Server Jitter 23.150.41.123 | 0.000 | 0.009 | 1.435 | 5.520 | 30.447 | 57.773 | 89.122 | 29.012 | 57.764 | 11.424 | 10.055 | ms | 2.747 | 13.72 | ||
| Server Jitter 23.155.40.38 | 0.000 | 0.000 | 1.128 | 3.297 | 25.833 | 117.881 | 142.893 | 24.705 | 117.881 | 18.570 | 8.072 | ms | 5.348 | 34.09 | ||
| Server Jitter 23.155.72.147 | 0.000 | 0.000 | 1.155 | 3.406 | 36.728 | 38.286 | 43.030 | 35.574 | 38.286 | 9.343 | 6.981 | ms | 2.473 | 8.282 | ||
| Server Jitter 23.157.100.123 | 0.000 | 0.000 | 1.185 | 3.466 | 29.380 | 139.189 | 142.047 | 28.195 | 139.189 | 20.111 | 8.629 | ms | 4.929 | 28.67 | ||
| Server Jitter 23.157.160.168 | 0.000 | 0.810 | 1.174 | 3.957 | 23.987 | 41.434 | 53.568 | 22.813 | 40.624 | 8.446 | 7.290 | ms | 2.463 | 9.675 | ||
| Server Jitter 23.159.16.194 | 0.000 | 1.045 | 2.467 | 16.809 | 27.390 | 32.850 | 58.053 | 24.924 | 31.805 | 7.442 | 16.306 | ms | 0.07263 | 4.257 | ||
| Server Jitter 23.161.104.133 | 0.000 | 0.000 | 11.096 | 45.164 | 77.776 | 95.911 | 152.099 | 66.680 | 95.911 | 19.945 | 45.733 | ms | 0.294 | 4.67 | ||
| Server Jitter 23.168.24.210 | 0.000 | 0.000 | 1.329 | 6.287 | 36.844 | 40.675 | 48.121 | 35.515 | 40.675 | 10.711 | 11.315 | ms | 1.333 | 4.184 | ||
| Server Jitter 23.172.120.58 | 0.000 | 0.000 | 0.000 | 36.865 | 82.693 | 82.693 | 82.693 | 82.693 | 82.693 | 28.106 | 36.432 | ms | -0.003439 | 1.781 | ||
| Server Jitter 23.186.168.123 | 0.000 | 0.768 | 1.169 | 3.370 | 13.260 | 22.807 | 113.039 | 12.091 | 22.039 | 5.636 | 4.767 | ms | 7.959 | 113.9 | ||
| Server Jitter 23.186.168.124 | 0.000 | 0.892 | 1.418 | 4.435 | 8.722 | 18.808 | 19.308 | 7.305 | 17.916 | 3.049 | 4.889 | ms | 2.312 | 11.25 | ||
| Server Jitter 23.186.168.125 | 0.000 | 0.751 | 1.211 | 3.565 | 12.663 | 22.694 | 103.846 | 11.453 | 21.942 | 4.992 | 4.802 | ms | 6.042 | 72.89 | ||
| Server Jitter 23.186.168.126 | 0.000 | 0.000 | 1.234 | 3.537 | 11.616 | 69.160 | 106.510 | 10.382 | 69.160 | 9.898 | 5.244 | ms | 7.723 | 68.17 | ||
| Server Jitter 23.186.168.127 | 0.000 | 0.806 | 1.185 | 3.261 | 12.174 | 34.485 | 68.429 | 10.988 | 33.679 | 6.198 | 4.701 | ms | 5.297 | 38.76 | ||
| Server Jitter 23.186.168.128 | 0.000 | 0.000 | 1.026 | 3.387 | 13.509 | 75.954 | 160.767 | 12.483 | 75.954 | 12.677 | 5.698 | ms | 8.692 | 89.98 | ||
| Server Jitter 23.186.168.129 | 0.000 | 0.000 | 1.314 | 3.634 | 11.765 | 82.480 | 281.407 | 10.451 | 82.480 | 14.206 | 5.835 | ms | 10.45 | 138.7 | ||
| Server Jitter 23.186.168.130 | 0.000 | 0.000 | 1.145 | 3.203 | 14.747 | 65.293 | 73.994 | 13.602 | 65.293 | 8.665 | 5.087 | ms | 5.7 | 39.24 | ||
| Server Jitter 23.186.168.131 | 0.000 | 0.000 | 1.503 | 5.139 | 49.244 | 94.071 | 100.094 | 47.740 | 94.071 | 18.147 | 10.984 | ms | 3.177 | 12.72 | ||
| Server Jitter 23.186.168.132 | 0.000 | 0.768 | 1.232 | 3.180 | 8.166 | 19.139 | 28.348 | 6.934 | 18.371 | 3.378 | 3.859 | ms | 4.121 | 25.48 | ||
| Server Jitter 23.186.168.133 | 0.000 | 1.512 | 1.823 | 5.300 | 16.896 | 23.032 | 23.906 | 15.073 | 21.520 | 4.392 | 6.131 | ms | 2.111 | 8.042 | ||
| Server Jitter 23.93.251.54 | 0.000 | 0.606 | 1.336 | 3.156 | 16.052 | 50.104 | 68.236 | 14.716 | 49.497 | 7.284 | 4.836 | ms | 5.676 | 41.06 | ||
| Server Jitter 23.95.35.34 | 0.000 | 0.829 | 1.232 | 4.064 | 17.053 | 36.772 | 53.916 | 15.821 | 35.942 | 6.495 | 5.868 | ms | 3.639 | 19.9 | ||
| Server Jitter 23.95.49.216 | 0.000 | 0.000 | 0.000 | 1.232 | 2.989 | 2.989 | 2.989 | 2.989 | 2.989 | 0.868 | 1.357 | ms | 0.08276 | 2.173 | ||
| Server Jitter 2401:c080:3000:2945:5400:4ff:fe69:f923 (ntpd-rs.sidnlabs.nl) | 0.000 | 1.826 | 4.716 | 29.461 | 72.915 | 89.395 | 159.685 | 68.200 | 87.569 | 21.838 | 33.133 | ms | 0.7116 | 3.169 | ||
| Server Jitter 2402:1f00:8101:d6::1 | 0.000 | 1.122 | 1.876 | 18.931 | 65.466 | 79.704 | 169.795 | 63.590 | 78.581 | 21.450 | 25.074 | ms | 1.025 | 4.123 | ||
| Server Jitter 240b:4004:108:200:8314:1a08:4cee:26d8 | 0.000 | 0.000 | 0.000 | 3.953 | 46.649 | 52.232 | 52.232 | 46.649 | 52.232 | 15.473 | 10.747 | ms | 1.58 | 4.101 | ||
| Server Jitter 240b:4004:108:200:8314:1a08:4cee:26d9 | 0.000 | 0.000 | 0.000 | 19.678 | 21.828 | 21.828 | 21.828 | 21.828 | 21.828 | 8.593 | 13.132 | ms | -0.5264 | 1.711 | ||
| Server Jitter 240b:4004:108:200:8314:1a08:4cee:2acf | 0.000 | 0.000 | 0.000 | 1.911 | 56.765 | 56.765 | 56.765 | 56.765 | 56.765 | 17.704 | 9.838 | ms | 2.016 | 5.544 | ||
| Server Jitter 2600:1702:80c0:9a80:1ee4:b0a2:44bc:c606 | 0.000 | 0.000 | 0.000 | 5.087 | 22.009 | 22.009 | 22.009 | 22.009 | 22.009 | 8.471 | 7.694 | ms | 0.9852 | 2.224 | ||
| Server Jitter 2600:1900:4060:2e7:: (0.0.0.0.0.0.0.0.0.0.0.0.0.0.0.0.7.e.2.0.0.6.0.4.0.0.9.1.0.0.6.2.bc.googleusercontent.com) | 0.000 | 1.432 | 2.735 | 23.981 | 80.125 | 100.086 | 260.324 | 77.390 | 98.655 | 25.098 | 30.934 | ms | 1.012 | 4.009 | ||
| Server Jitter 2600:1f13:2c1:2e00::be00:5 | 0.000 | 0.000 | 0.000 | 2.102 | 15.060 | 15.060 | 15.060 | 15.060 | 15.060 | 4.508 | 4.272 | ms | 1.493 | 3.915 | ||
| Server Jitter 2600:1f13:eda:9800:bcd8:839c:9b40:25b2 (oregon.time.system76.com) | 0.000 | 0.823 | 1.165 | 3.318 | 22.269 | 50.170 | 185.361 | 21.104 | 49.347 | 10.019 | 6.281 | ms | 5.659 | 54.72 | ||
| Server Jitter 2600:1f16:42a:1d00:2169:fe07:2acc:6002 (ohio.time.system76.com) | 0.000 | 0.830 | 1.200 | 3.525 | 39.618 | 69.663 | 282.893 | 38.418 | 68.833 | 14.537 | 9.155 | ms | 4.102 | 32.37 | ||
| Server Jitter 2600:1f18:4c51:e200:e142:210a:306d:4872 (virginia.time.system76.com) | 0.000 | 0.835 | 1.260 | 7.006 | 52.457 | 78.690 | 168.874 | 51.197 | 77.855 | 17.492 | 14.301 | ms | 2.254 | 9.588 | ||
| Server Jitter 2600:1f18:7927:8b00:123:: | 0.000 | 0.000 | 0.000 | 0.873 | 2.440 | 2.440 | 2.440 | 2.440 | 2.440 | 0.788 | 1.166 | ms | 0.2839 | 1.935 | ||
| Server Jitter 2600:3c00:e000:318::1 (jane.qotw.net) | 0.000 | 0.000 | 0.000 | 2.575 | 8.084 | 8.084 | 8.084 | 8.084 | 8.084 | 2.699 | 3.189 | ms | 0.7252 | 2.226 | ||
| Server Jitter 2600:3c01::f03c:93ff:fe5b:8a7d (us-west-1.clearnet.pw) | 0.000 | 0.000 | 0.000 | 6.110 | 10.609 | 10.609 | 10.609 | 10.609 | 10.609 | 3.299 | 4.985 | ms | 0.1951 | 2.331 | ||
| Server Jitter 2600:3c01::f03c:93ff:fedd:5a1f (sensei.ruselabs.com) | 0.000 | 0.000 | 0.000 | 7.022 | 69.185 | 74.278 | 74.278 | 69.185 | 74.278 | 19.927 | 15.358 | ms | 1.999 | 5.824 | ||
| Server Jitter 2600:3c01:e000:7e6::123 (time1.sigi.net) | 0.000 | 0.000 | 0.000 | 2.687 | 8.376 | 8.381 | 8.381 | 8.376 | 8.381 | 2.133 | 3.108 | ms | 1.166 | 3.985 | ||
| Server Jitter 2600:3c02::f03c:94ff:fe59:f411 | 0.000 | 0.000 | 0.000 | 5.394 | 7.516 | 7.516 | 7.516 | 7.516 | 7.516 | 2.647 | 4.557 | ms | -0.5602 | 1.96 | ||
| Server Jitter 2600:3c03::f03c:91ff:fedf:1e98 (li1.forfun.net) | 0.000 | 0.000 | 0.000 | 11.029 | 94.476 | 94.476 | 94.476 | 94.476 | 94.476 | 27.639 | 20.489 | ms | 1.645 | 4.285 | ||
| Server Jitter 2600:3c06::f03c:94ff:fee2:9c28 | 0.000 | 0.000 | 0.000 | 9.325 | 30.736 | 30.736 | 30.736 | 30.736 | 30.736 | 11.553 | 11.593 | ms | 0.8589 | 2.149 | ||
| Server Jitter 2600:3c06::f03c:94ff:fee2:c53a | 0.000 | 0.000 | 0.000 | 15.615 | 24.117 | 24.117 | 24.117 | 24.117 | 24.117 | 9.987 | 13.244 | ms | -0.3427 | 1.5 | ||
| Server Jitter 2602:2b7:d11:f4::122 (s2-b.time.mci1.us.rozint.net) | 0.000 | 0.000 | 0.000 | 3.886 | 12.153 | 12.153 | 12.153 | 12.153 | 12.153 | 3.374 | 4.505 | ms | 0.7652 | 3.068 | ||
| Server Jitter 2602:80b:5000::36 (time.meme.holdings) | 0.000 | 0.000 | 4.621 | 20.856 | 76.477 | 84.174 | 87.838 | 71.856 | 84.174 | 21.252 | 27.684 | ms | 0.9659 | 3.216 | ||
| Server Jitter 2602:81b:9000::c10c (time.sea.ordinaladvisors.com) | 0.000 | 0.000 | 0.000 | 3.625 | 9.349 | 9.349 | 9.349 | 9.349 | 9.349 | 2.588 | 4.147 | ms | 0.2659 | 2.467 | ||
| Server Jitter 2602:f590::23:161:104:133 (isere.sd.ysun.co) | 0.000 | 0.000 | 7.038 | 40.173 | 63.744 | 78.005 | 83.945 | 56.706 | 78.005 | 17.076 | 39.669 | ms | -0.2518 | 2.788 | ||
| Server Jitter 2602:f9ba:69::210 (as393746.mci.trtnw.net) | 0.000 | 0.000 | 1.448 | 9.790 | 67.645 | 87.579 | 97.607 | 66.198 | 87.579 | 21.576 | 19.008 | ms | 1.617 | 4.947 | ||
| Server Jitter 2602:fb95:16::123 (time5.sigi.net) | 0.000 | 0.000 | 0.000 | 2.945 | 6.744 | 6.744 | 6.744 | 6.744 | 6.744 | 1.680 | 2.843 | ms | 0.7474 | 3.802 | ||
| Server Jitter 2602:fd50:100:108:3491:d3b2:eef8:f324 (ntp.netlinkify.com) | 0.000 | 0.000 | 0.000 | 1.961 | 5.599 | 9.370 | 9.370 | 5.599 | 9.370 | 2.184 | 2.731 | ms | 1.202 | 4.547 | ||
| Server Jitter 2602:fe2e:3:d:f9:c7ff:fef5:379c (ntp.ny1.neptunenetworks.net) | 0.000 | 0.000 | 0.000 | 2.011 | 3.424 | 3.424 | 3.424 | 3.424 | 3.424 | 0.929 | 1.786 | ms | -0.1796 | 2.962 | ||
| Server Jitter 2603:c020:0:8369:1111:1111:1111:1112 | 0.000 | 0.000 | 0.000 | 2.207 | 40.655 | 40.655 | 40.655 | 40.655 | 40.655 | 12.543 | 9.364 | ms | 1.256 | 3.23 | ||
| Server Jitter 2603:c020:0:8369::bad:beef | 0.000 | 0.000 | 0.000 | 3.940 | 3.991 | 3.991 | 3.991 | 3.991 | 3.991 | 1.645 | 2.811 | ms | -1.067 | 2.256 | ||
| Server Jitter 2603:c020:0:8369:feed:feed:feed:feed | 0.000 | 0.000 | 0.000 | 7.366 | 13.323 | 13.323 | 13.323 | 13.323 | 13.323 | 5.449 | 6.896 | ms | -0.1286 | 1.5 | ||
| Server Jitter 2603:c024:c005:a600:efb6:d213:cad8:251d | 0.000 | 0.000 | 0.000 | 14.820 | 57.595 | 57.595 | 57.595 | 57.595 | 57.595 | 17.229 | 20.244 | ms | 1.209 | 3.457 | ||
| Server Jitter 2604:8800:52:81:38:229:52:9 (ntp08.cymru.com) | 0.000 | 0.000 | 0.000 | 21.487 | 31.405 | 31.405 | 31.405 | 31.405 | 31.405 | 13.108 | 17.631 | ms | -0.4158 | 1.5 | ||
| Server Jitter 2604:a880:400:d0::4ed:f001 (unifi.versadns.com) | 0.000 | 0.000 | 0.000 | 11.421 | 25.574 | 25.574 | 25.574 | 25.574 | 25.574 | 7.238 | 12.934 | ms | -0.04102 | 2.807 | ||
| Server Jitter 2604:a880:800:10::70f:b001 (ellone.fdisk.io) | 0.000 | 0.000 | 0.000 | 1.765 | 3.857 | 3.857 | 3.857 | 3.857 | 3.857 | 1.036 | 1.790 | ms | 0.1052 | 2.65 | ||
| Server Jitter 2604:a880:800:a1::ec9:5001 | 0.000 | 0.000 | 0.000 | 37.963 | 144.987 | 144.987 | 144.987 | 144.987 | 144.987 | 42.386 | 45.567 | ms | 0.8191 | 2.927 | ||
| Server Jitter 2604:d200::39 (white.web-ster.com) | 0.000 | 0.000 | 0.000 | 1.801 | 12.238 | 25.815 | 25.815 | 12.238 | 25.815 | 5.414 | 3.117 | ms | 3.361 | 13.81 | ||
| Server Jitter 2605:4840:3:fb19::1 (chi3.us.ntp.li) | 0.000 | 0.000 | 0.000 | 3.562 | 6.209 | 6.209 | 6.209 | 6.209 | 6.209 | 2.544 | 3.257 | ms | -0.178 | 1.5 | ||
| Server Jitter 2605:6400:488d:2eda:eee9:fe8d:4543:d471 | 0.000 | 0.000 | 0.000 | 0.000 | 0.000 | 0.000 | 0.000 | 0.000 | 0.000 | 0.000 | 0.000 | ns | nan | nan | ||
| Server Jitter 2605:6400:488d:3686:546d:c03c:1689:20c | 0.000 | 0.000 | 0.000 | 0.000 | 0.000 | 0.000 | 0.000 | 0.000 | 0.000 | 0.000 | 0.000 | ns | nan | nan | ||
| Server Jitter 2605:6f01:2000:18::94ee:fcbe (vps-buf1.orleans.ddnss.de) | 0.000 | 0.000 | 0.000 | 3.793 | 7.878 | 7.878 | 7.878 | 7.878 | 7.878 | 2.024 | 4.070 | ms | 0.0771 | 3.251 | ||
| Server Jitter 2606:4700:f1::1 (time.cloudflare.com) | 0.000 | 0.821 | 1.167 | 3.388 | 21.569 | 51.700 | 196.069 | 20.402 | 50.879 | 9.851 | 6.217 | ms | 6.195 | 69.95 | ||
| Server Jitter 2606:4700:f1::123 (time.cloudflare.com) | 0.000 | 0.818 | 1.158 | 3.327 | 20.620 | 59.531 | 162.685 | 19.461 | 58.714 | 10.424 | 6.152 | ms | 5.858 | 51.75 | ||
| Server Jitter 2606:82c0:21::e (time1.lshiy.com) | 0.000 | 0.000 | 0.000 | 1.883 | 3.565 | 3.565 | 3.565 | 3.565 | 3.565 | 1.027 | 1.940 | ms | -0.3172 | 2.792 | ||
| Server Jitter 2606:82c0:22::e (time2.lshiy.com) | 0.000 | 0.000 | 0.000 | 24.326 | 24.843 | 24.843 | 24.843 | 24.843 | 24.843 | 11.591 | 16.390 | ms | -0.7061 | 1.5 | ||
| Server Jitter 2606:82c0:23::e (time3.lshiy.com) | 0.000 | 0.000 | 0.000 | 3.337 | 8.248 | 8.248 | 8.248 | 8.248 | 8.248 | 2.270 | 3.415 | ms | 0.3181 | 2.67 | ||
| Server Jitter 2607:7c80:54:3::32 | 0.000 | 0.000 | 0.000 | 3.603 | 11.499 | 11.499 | 11.499 | 11.499 | 11.499 | 3.098 | 4.294 | ms | 1.035 | 3.383 | ||
| Server Jitter 2607:9000:7000:23:216:3cff:fe25:38d7 | 0.000 | 0.000 | 0.000 | 7.179 | 57.684 | 57.684 | 57.684 | 57.684 | 57.684 | 16.210 | 10.235 | ms | 2.43 | 7.385 | ||
| Server Jitter 2607:9d00:2000:16::9269:208a (vps-lax1.orleans.ddnss.de) | 0.000 | 0.000 | 0.000 | 3.585 | 32.658 | 32.768 | 32.768 | 32.658 | 32.768 | 8.863 | 6.355 | ms | 2.336 | 7.193 | ||
| Server Jitter 2607:f1c0:f06b:5000::1 (ntp11.kernfusion.at) | 0.000 | 0.000 | 0.000 | 2.585 | 3.939 | 3.939 | 3.939 | 3.939 | 3.939 | 1.251 | 2.204 | ms | -0.4741 | 2.288 | ||
| Server Jitter 2607:f1c0:f06b:5000::3 (ntp11.kernfusion.at) | 0.000 | 0.000 | 0.000 | 6.053 | 20.902 | 20.902 | 20.902 | 20.902 | 20.902 | 5.847 | 6.566 | ms | 1.063 | 3.708 | ||
| Server Jitter 2607:f1c0:f06b:5000::4 (ntp11.kernfusion.at) | 0.000 | 0.000 | 0.000 | 3.713 | 17.103 | 17.166 | 17.166 | 17.103 | 17.166 | 4.236 | 4.518 | ms | 1.905 | 6.172 | ||
| Server Jitter 2607:f1c0:f075:9900::1 | 0.000 | 0.000 | 0.000 | 3.194 | 62.537 | 70.431 | 70.431 | 62.537 | 70.431 | 17.930 | 9.867 | ms | 2.624 | 8.577 | ||
| Server Jitter 2607:f298:5:101d:f816:3eff:fefd:8817 | 0.000 | 0.000 | 0.000 | 2.720 | 5.235 | 5.235 | 5.235 | 5.235 | 5.235 | 1.474 | 2.934 | ms | -0.2774 | 2.751 | ||
| Server Jitter 2607:f5b7:1:44::123 (ntp.wdc2.us.leaseweb.net) | 0.000 | 0.000 | 0.000 | 22.421 | 42.881 | 42.881 | 42.881 | 42.881 | 42.881 | 15.424 | 20.144 | ms | 0.2368 | 1.91 | ||
| Server Jitter 2607:f710:35::29c:0:5 | 0.000 | 0.000 | 0.000 | 4.556 | 7.900 | 7.900 | 7.900 | 7.900 | 7.900 | 2.166 | 4.553 | ms | -0.3058 | 2.962 | ||
| Server Jitter 2607:ff50:0:1a::10 (ntpool0.603.newcontinuum.net) | 0.000 | 0.000 | 0.000 | 4.417 | 9.460 | 9.460 | 9.460 | 9.460 | 9.460 | 2.696 | 4.546 | ms | -0.0246 | 2.498 | ||
| Server Jitter 2620:8d:c000::f (blotch.image1tech.net) | 0.000 | 0.000 | 0.000 | 11.399 | 23.001 | 23.001 | 23.001 | 23.001 | 23.001 | 6.886 | 11.933 | ms | -0.1456 | 2.635 | ||
| Server Jitter 2620:b0:2000:102::2:123 (time-he.den.codehof.net) | 0.000 | 0.000 | 0.000 | 5.132 | 67.520 | 67.520 | 67.520 | 67.520 | 67.520 | 21.171 | 12.422 | ms | 2.131 | 5.771 | ||
| Server Jitter 2a00:d78:0:712:94:198:159:11 (nts1.time.nl) | 0.000 | 1.584 | 2.966 | 20.836 | 77.601 | 99.042 | 530.168 | 74.635 | 97.459 | 26.838 | 29.328 | ms | 3.305 | 41.99 | ||
| Server Jitter 2a01:3f7:2:44::8 (sth1-ts.nts.netnod.se) | 0.000 | 1.586 | 4.549 | 39.612 | 91.882 | 108.273 | 271.797 | 87.333 | 106.687 | 26.974 | 42.094 | ms | 0.8193 | 4.845 | ||
| Server Jitter 2a01:3f7:2:44::9 (sth2-ts.nts.netnod.se) | 0.000 | 1.946 | 4.236 | 38.471 | 92.191 | 110.399 | 234.358 | 87.955 | 108.453 | 28.207 | 41.565 | ms | 0.7071 | 3.664 | ||
| Server Jitter 2a01:4f8:c012:1afb:123:123:123:123 | 0.000 | 2.107 | 4.538 | 29.415 | 67.555 | 89.560 | 458.532 | 63.018 | 87.453 | 23.919 | 32.258 | ms | 4.77 | 70.42 | ||
| Server Jitter 2a01:4f9:c013:fa27:123:123:123:123 | 0.000 | 1.942 | 3.997 | 36.742 | 92.861 | 109.042 | 178.690 | 88.864 | 107.100 | 29.597 | 40.764 | ms | 0.5627 | 2.58 | ||
| Server Jitter 2a01:4ff:f0:7300:123:123:123:123 | 0.000 | 1.015 | 1.606 | 5.227 | 35.666 | 58.999 | 390.666 | 34.060 | 57.984 | 15.078 | 10.007 | ms | 10.55 | 228.5 | ||
| Server Jitter 2a01:4ff:f0:ebce::1 | 0.000 | 0.000 | 0.000 | 25.847 | 25.847 | 25.847 | 25.847 | 25.847 | 25.847 | 12.924 | 12.924 | ms | 0 | 1 | ||
| Server Jitter 2a01:7e03::f03c:95ff:fef8:ac8c (sushi.ruselabs.com) | 0.000 | 0.000 | 0.000 | 32.068 | 70.288 | 70.288 | 70.288 | 70.288 | 70.288 | 19.572 | 34.261 | ms | 0.1428 | 3.002 | ||
| Server Jitter 2a01:7e04::f03c:94ff:fee2:cba5 | 0.000 | 0.000 | 0.000 | 1.794 | 29.750 | 29.750 | 29.750 | 29.750 | 29.750 | 9.167 | 5.895 | ms | 1.677 | 4.108 | ||
| Server Jitter 2a0a:e5c0:2:2:0:c8ff:fe68:beb7 (42-2a0a-e5c0-2-2-0-c8ff-fe68-beb7.loves.ipv6.at.ungleich.ch) | 0.960 | 1.460 | 2.257 | 13.905 | 74.907 | 99.253 | 114.435 | 72.649 | 97.793 | 24.920 | 24.749 | ms | 1.308 | 3.834 | ||
| Server Jitter 34.147.28.4 | 0.000 | 0.803 | 1.807 | 18.567 | 78.066 | 98.914 | 166.058 | 76.259 | 98.112 | 25.574 | 27.639 | ms | 1.086 | 3.847 | ||
| Server Jitter 37.27.11.4 | 0.000 | 0.000 | 1.780 | 14.020 | 76.180 | 81.696 | 81.940 | 74.400 | 81.696 | 20.637 | 20.684 | ms | 1.598 | 4.786 | ||
| Server Jitter 38.45.64.130 | 0.000 | 0.000 | 7.571 | 29.546 | 64.425 | 166.492 | 263.171 | 56.855 | 166.492 | 23.853 | 34.485 | ms | 4.369 | 34.53 | ||
| Server Jitter 40.160.28.79 | 0.000 | 1.801 | 6.063 | 24.301 | 44.703 | 52.503 | 53.020 | 38.640 | 50.702 | 10.983 | 25.335 | ms | 0.2798 | 2.796 | ||
| Server Jitter 44.190.5.123 | 0.000 | 0.690 | 1.041 | 2.749 | 11.266 | 21.652 | 606.922 | 10.225 | 20.962 | 13.385 | 4.233 | ms | 36.76 | 1584 | ||
| Server Jitter 45.33.53.84 | 0.000 | 0.831 | 1.241 | 3.939 | 13.487 | 24.803 | 53.423 | 12.247 | 23.971 | 5.057 | 5.138 | ms | 4.216 | 30.01 | ||
| Server Jitter 45.45.184.14 | 0.000 | 0.000 | 1.110 | 4.697 | 21.496 | 34.599 | 34.599 | 20.386 | 34.599 | 7.191 | 6.851 | ms | 2.344 | 8.455 | ||
| Server Jitter 45.55.58.103 | 0.000 | 0.000 | 0.000 | 85.863 | 108.041 | 108.041 | 108.041 | 108.041 | 108.041 | 46.518 | 50.518 | ms | 0.04903 | 1.088 | ||
| Server Jitter 45.63.54.13 | 0.000 | 0.000 | 0.926 | 3.219 | 11.454 | 24.347 | 79.311 | 10.528 | 24.347 | 6.984 | 4.593 | ms | 7.316 | 68.66 | ||
| Server Jitter 45.77.126.122 | 0.000 | 0.000 | 0.000 | 1.241 | 5.704 | 5.704 | 5.704 | 5.704 | 5.704 | 1.667 | 1.809 | ms | 1.009 | 2.758 | ||
| Server Jitter 45.79.111.167 | 0.000 | 0.000 | 0.953 | 3.169 | 15.255 | 82.645 | 207.001 | 14.303 | 82.645 | 17.209 | 6.044 | ms | 9.837 | 110.1 | ||
| Server Jitter 45.79.13.35 | 0.000 | 0.000 | 0.000 | 2.016 | 2.016 | 2.016 | 2.016 | 2.016 | 2.016 | 1.008 | 1.008 | ms | 0 | 1 | ||
| Server Jitter 45.79.227.165 | 0.000 | 0.920 | 1.500 | 4.176 | 11.740 | 18.714 | 21.129 | 10.241 | 17.793 | 3.267 | 4.857 | ms | 2.142 | 9.049 | ||
| Server Jitter 45.79.82.45 | 0.000 | 0.754 | 1.102 | 3.321 | 12.050 | 24.480 | 63.897 | 10.948 | 23.726 | 4.900 | 4.561 | ms | 5.374 | 50.29 | ||
| Server Jitter 45.83.234.123 | 0.000 | 1.483 | 4.387 | 42.939 | 82.952 | 103.588 | 180.284 | 78.565 | 102.105 | 25.149 | 41.908 | ms | 0.5962 | 4.49 | ||
| Server Jitter 47.85.203.40 | 0.000 | 0.848 | 1.598 | 5.948 | 28.308 | 42.271 | 42.446 | 26.710 | 41.422 | 9.054 | 9.477 | ms | 1.937 | 6.968 | ||
| Server Jitter 49.12.103.123 | 0.000 | 0.000 | 7.178 | 50.984 | 95.543 | 105.971 | 112.348 | 88.364 | 105.971 | 24.549 | 51.635 | ms | 0.01243 | 2.627 | ||
| Server Jitter 5.161.111.190 | 0.000 | 0.887 | 1.554 | 4.668 | 21.349 | 37.015 | 37.112 | 19.795 | 36.128 | 7.669 | 8.606 | ms | 1.358 | 4.999 | ||
| Server Jitter 5.161.65.34 | 0.000 | 0.000 | 0.000 | 4.473 | 17.184 | 17.184 | 17.184 | 17.184 | 17.184 | 4.658 | 5.050 | ms | 0.938 | 3.169 | ||
| Server Jitter 5.161.94.12 | 0.000 | 0.726 | 1.107 | 5.319 | 32.339 | 56.965 | 81.956 | 31.232 | 56.239 | 10.938 | 9.475 | ms | 2.697 | 13.19 | ||
| Server Jitter 5.57.11.195 | 0.000 | 0.000 | 0.000 | 1.528 | 1.528 | 1.528 | 1.528 | 1.528 | 1.528 | 0.764 | 0.764 | ms | 0 | 1 | ||
| Server Jitter 50.117.3.52 | 0.000 | 0.000 | 0.000 | 1.241 | 1.948 | 1.948 | 1.948 | 1.948 | 1.948 | 0.616 | 1.028 | ms | -0.1887 | 2.181 | ||
| Server Jitter 50.117.3.95 | 0.000 | 0.000 | 0.096 | 3.528 | 22.835 | 29.378 | 30.209 | 22.739 | 29.378 | 7.966 | 7.859 | ms | 1.051 | 2.928 | ||
| Server Jitter 50.205.57.38 | 0.000 | 0.000 | 0.000 | 2.064 | 12.794 | 26.867 | 26.867 | 12.794 | 26.867 | 5.655 | 3.818 | ms | 2.994 | 11.9 | ||
| Server Jitter 50.218.103.254 | 0.000 | 0.000 | 0.163 | 9.296 | 31.573 | 43.704 | 46.371 | 31.410 | 43.704 | 9.986 | 11.553 | ms | 1.272 | 4.653 | ||
| Server Jitter 51.38.58.233 | 0.000 | 0.627 | 1.195 | 2.758 | 18.088 | 25.470 | 29.937 | 16.893 | 24.843 | 5.518 | 4.851 | ms | 2.569 | 9.414 | ||
| Server Jitter 51.81.226.229 | 0.000 | 0.657 | 1.042 | 3.022 | 15.578 | 21.479 | 24.923 | 14.536 | 20.822 | 4.160 | 4.314 | ms | 2.661 | 10.4 | ||
| Server Jitter 64.131.47.178 | 0.000 | 0.000 | 0.000 | 2.618 | 40.956 | 40.956 | 40.956 | 40.956 | 40.956 | 13.476 | 8.143 | ms | 1.991 | 5.057 | ||
| Server Jitter 64.251.10.152 | 0.000 | 0.662 | 1.310 | 2.937 | 14.783 | 23.548 | 24.751 | 13.473 | 22.886 | 4.514 | 4.810 | ms | 2.064 | 7.271 | ||
| Server Jitter 64.79.100.197 | 0.000 | 0.000 | 0.837 | 2.598 | 8.572 | 24.806 | 29.820 | 7.735 | 24.806 | 4.184 | 3.573 | ms | 4.025 | 21.53 | ||
| Server Jitter 65.182.224.39 | 0.000 | 0.000 | 0.862 | 2.232 | 8.548 | 15.286 | 19.717 | 7.685 | 15.286 | 2.906 | 3.164 | ms | 2.538 | 10.82 | ||
| Server Jitter 65.182.224.60 | 0.000 | 0.000 | 2.004 | 3.445 | 7.058 | 10.501 | 10.501 | 5.054 | 10.501 | 1.855 | 3.928 | ms | 1.023 | 4.59 | ||
| Server Jitter 66.118.228.14 | 0.000 | 1.929 | 2.939 | 6.604 | 16.232 | 40.531 | 64.782 | 13.293 | 38.601 | 6.085 | 7.807 | ms | 4.869 | 36.09 | ||
| Server Jitter 66.118.229.14 | 0.000 | 12.905 | 17.541 | 43.034 | 69.623 | 82.562 | 91.203 | 52.082 | 69.657 | 15.534 | 43.735 | ms | 0.08592 | 3.136 | ||
| Server Jitter 66.118.231.14 | 0.000 | 0.000 | 0.000 | 1.084 | 4.383 | 4.383 | 4.383 | 4.383 | 4.383 | 1.272 | 1.490 | ms | 1.426 | 4.099 | ||
| Server Jitter 67.210.96.32 | 0.000 | 0.000 | 1.207 | 3.085 | 15.678 | 32.664 | 56.283 | 14.472 | 32.664 | 6.015 | 4.631 | ms | 5.327 | 39.04 | ||
| Server Jitter 67.217.246.204 | 0.000 | 0.000 | 3.782 | 16.952 | 25.882 | 32.289 | 50.963 | 22.100 | 32.289 | 6.594 | 16.539 | ms | 0.03535 | 4.717 | ||
| Server Jitter 68.183.147.240 | 0.000 | 0.000 | 1.157 | 13.703 | 40.794 | 119.968 | 127.941 | 39.637 | 119.968 | 20.038 | 17.502 | ms | 3.439 | 17 | ||
| Server Jitter 69.172.133.130 | 0.000 | 0.000 | 0.000 | 3.230 | 75.376 | 75.376 | 75.376 | 75.376 | 75.376 | 24.828 | 13.852 | ms | 1.682 | 4.021 | ||
| Server Jitter 69.176.84.38 | 0.000 | 0.000 | 0.084 | 1.877 | 4.514 | 6.761 | 6.761 | 4.430 | 6.761 | 1.315 | 2.063 | ms | 1.34 | 5.848 | ||
| Server Jitter 69.89.207.199 | 0.000 | 0.000 | 0.000 | 5.847 | 88.065 | 120.778 | 120.778 | 88.065 | 120.778 | 29.309 | 19.505 | ms | 2.034 | 6.432 | ||
| Server Jitter 69.89.207.99 | 0.000 | 0.774 | 1.256 | 3.477 | 12.839 | 29.139 | 217.779 | 11.583 | 28.365 | 8.047 | 5.086 | ms | 12.96 | 272.4 | ||
| Server Jitter 71.19.144.140 | 0.000 | 0.000 | 0.000 | 2.244 | 28.288 | 28.288 | 28.288 | 28.288 | 28.288 | 6.176 | 4.071 | ms | 3.331 | 13.18 | ||
| Server Jitter 72.14.182.49 | 0.000 | 0.852 | 1.163 | 3.269 | 16.589 | 22.688 | 25.413 | 15.425 | 21.836 | 4.550 | 4.656 | ms | 2.49 | 9.16 | ||
| Server Jitter 72.14.183.39 | 0.000 | 0.000 | 0.000 | 2.885 | 5.156 | 5.156 | 5.156 | 5.156 | 5.156 | 1.696 | 2.895 | ms | -0.4921 | 2.349 | ||
| Server Jitter 72.14.186.59 | 0.000 | 0.000 | 0.232 | 2.515 | 7.822 | 13.480 | 13.480 | 7.590 | 13.480 | 2.909 | 3.730 | ms | 0.9794 | 3.718 | ||
| Server Jitter 72.30.35.88 | 0.000 | 1.007 | 1.531 | 5.856 | 34.003 | 42.466 | 56.014 | 32.471 | 41.460 | 9.973 | 10.023 | ms | 1.675 | 5.678 | ||
| Server Jitter 73.185.182.209 | 0.000 | 0.000 | 1.302 | 4.212 | 50.077 | 60.246 | 80.745 | 48.776 | 60.246 | 12.973 | 8.582 | ms | 3.195 | 13.04 | ||
| Server Jitter 74.208.14.149 | 0.000 | 1.820 | 12.427 | 24.899 | 47.302 | 58.364 | 66.145 | 34.875 | 56.544 | 11.079 | 27.112 | ms | 0.5371 | 3.692 | ||
| Server Jitter 77.37.97.124 | 0.000 | 0.000 | 2.796 | 32.332 | 77.851 | 100.698 | 150.671 | 75.056 | 100.698 | 24.623 | 34.958 | ms | 0.696 | 3.419 | ||
| Server Jitter 77.42.37.85 | 0.000 | 0.900 | 1.851 | 19.516 | 80.597 | 96.805 | 116.085 | 78.746 | 95.905 | 26.687 | 29.693 | ms | 0.8002 | 2.536 | ||
| Server Jitter 79.160.225.13 | 0.000 | 0.793 | 1.333 | 9.929 | 70.698 | 94.447 | 111.150 | 69.365 | 93.654 | 22.373 | 19.069 | ms | 1.697 | 5.375 | ||
| Server Jitter 83.228.206.15 | 0.000 | 0.000 | 11.060 | 56.909 | 95.536 | 108.530 | 155.978 | 84.476 | 108.530 | 23.568 | 56.450 | ms | 0.05599 | 3.839 | ||
| Server Jitter 91.224.149.196 | 0.000 | 0.000 | 5.567 | 42.234 | 78.395 | 110.514 | 111.344 | 72.829 | 110.514 | 21.756 | 41.560 | ms | 0.3254 | 3.369 | ||
| Server Jitter 94.198.159.11 | 0.000 | 0.000 | 0.000 | 9.727 | 9.727 | 9.727 | 9.727 | 9.727 | 9.727 | 4.863 | 4.863 | ms | 0 | 1 | ||
| Server Jitter 96.19.94.82 | 0.000 | 0.000 | 1.253 | 7.848 | 37.107 | 50.905 | 50.905 | 35.854 | 50.905 | 10.602 | 10.355 | ms | 1.853 | 6.49 | ||
| Server Jitter 96.245.170.99 | 0.000 | 0.000 | 0.928 | 18.260 | 41.943 | 57.524 | 58.502 | 41.015 | 57.524 | 13.116 | 19.082 | ms | 0.5645 | 3.202 | ||
| Server Jitter 99.28.14.242 | 0.000 | 0.830 | 1.274 | 3.858 | 18.821 | 70.147 | 200.156 | 17.547 | 69.316 | 13.898 | 6.849 | ms | 8.497 | 92.63 | ||
| Server Jitter SHM(0) | 0.000 | 0.521 | 0.780 | 2.066 | 249.248 | 295.491 | 1,615.750 | 248.468 | 294.970 | 66.477 | 19.767 | ms | 3.732 | 18.07 | ||
| Server Jitter SHM(1) | 0.000 | 0.158 | 0.201 | 0.311 | 0.485 | 0.649 | 1,591.279 | 0.284 | 0.491 | 9.619 | 0.453 | ms | 100 | 1.165e+04 | ||
| Server Jitter SHM(2) | 0.000 | 0.689 | 1.023 | 2.503 | 5.883 | 7.760 | 2,002.029 | 4.860 | 7.071 | 21.199 | 3.181 | ms | 72.01 | 5511 | ||
| Server Jitter SHM(3) | 0.000 | 0.163 | 0.203 | 0.307 | 0.472 | 0.587 | 2,001.141 | 0.270 | 0.424 | 15.613 | 0.500 | ms | 98.16 | 1.02e+04 | ||
| Server Jitter SHM(4) | 0.000 | 0.462 | 0.715 | 1.781 | 4.115 | 5.613 | 9.498 | 3.400 | 5.151 | 1.084 | 2.018 | ms | 1.439 | 6.41 | ||
| Server Jitter SHM(5) | 0.000 | 106.480 | 159.500 | 293.466 | 508.030 | 630.513 | 3,570.370 | 348.530 | 524.033 | 165.333 | 317.310 | µs | 8.706 | 137.8 | ||
| Server Jitter SOCK(0) | 0.000 | 0.469 | 0.676 | 1.595 | 3.766 | 5.349 | 19.068 | 3.090 | 4.880 | 1.132 | 1.850 | ms | 3.643 | 35.89 | ||
| Server Jitter SOCK(1) | 0.000 | 0.182 | 0.218 | 0.320 | 0.483 | 0.741 | 10.303 | 0.264 | 0.560 | 0.158 | 0.337 | ms | 21.81 | 1001 | ||
| Server Jitter SOCK(2) | 0.000 | 0.600 | 0.948 | 2.374 | 5.637 | 7.241 | 11.212 | 4.689 | 6.641 | 1.481 | 2.715 | ms | 1.233 | 5.001 | ||
| Server Jitter SOCK(3) | 0.000 | 0.198 | 0.221 | 0.317 | 0.445 | 0.494 | 9.633 | 0.224 | 0.296 | 0.108 | 0.324 | ms | 32.53 | 2306 | ||
| Server Offset 104.131.155.175 | -127.900 | -126.268 | -9.978 | 1.287 | 7.510 | 13.031 | 14.937 | 17.488 | 139.299 | 23.811 | -3.782 | ms | -4.483 | 22.22 | ||
| Server Offset 104.152.220.5 | 1.461 | 1.461 | 1.461 | 2.919 | 4.887 | 4.887 | 4.887 | 3.425 | 3.425 | 1.020 | 2.874 | ms | 0.6553 | 2.767 | ||
| Server Offset 104.232.0.123 | 2.639 | 2.639 | 2.639 | 4.841 | 7.033 | 7.033 | 7.033 | 4.394 | 4.394 | 1.310 | 4.792 | ms | 0.1249 | 2.376 | ||
| Server Offset 104.234.61.117 | -11.180 | -9.140 | -3.447 | 1.426 | 6.606 | 12.091 | 16.244 | 10.053 | 21.231 | 3.430 | 1.519 | ms | -0.07377 | 5.449 | ||
| Server Offset 107.172.222.7 | -12.642 | -11.375 | -7.178 | 1.882 | 7.310 | 12.947 | 14.359 | 14.488 | 24.322 | 3.982 | 1.625 | ms | -0.7389 | 5.565 | ||
| Server Offset 108.61.215.221 | -28.570 | -9.305 | -0.181 | 3.903 | 6.523 | 8.097 | 13.175 | 6.704 | 17.402 | 2.862 | 3.479 | ms | -3.533 | 28.36 | ||
| Server Offset 12.205.28.193 | -126.850 | -126.850 | -126.850 | -114.175 | 6.955 | 6.955 | 6.955 | 133.805 | 133.805 | 46.151 | -91.142 | ms | 1.065 | 2.644 | ||
| Server Offset 129.146.193.200 | -0.800 | 0.856 | 1.480 | 4.796 | 6.343 | 6.706 | 7.088 | 4.863 | 5.850 | 1.421 | 4.500 | ms | -1.034 | 4.16 | ||
| Server Offset 129.250.35.250 | -2.943 | -2.410 | -1.340 | 1.886 | 5.403 | 7.583 | 8.459 | 6.742 | 9.993 | 2.056 | 1.995 | ms | 0.3236 | 3.078 | ||
| Server Offset 131.239.5.43 | 0.782 | 0.782 | 0.782 | 4.026 | 4.797 | 4.797 | 4.797 | 4.014 | 4.014 | 1.405 | 3.356 | ms | -1.032 | 2.322 | ||
| Server Offset 134.215.155.177 | -18.453 | -8.187 | -5.143 | -0.842 | 4.221 | 10.577 | 15.538 | 9.364 | 18.764 | 3.349 | -0.714 | ms | 0.2563 | 7.75 | ||
| Server Offset 136.244.88.170 | -82.929 | -69.847 | -36.233 | -1.841 | 3.940 | 8.403 | 10.603 | 40.173 | 78.249 | 14.915 | -6.598 | ms | -2.869 | 12.5 | ||
| Server Offset 137.190.2.4 | -13.886 | -13.886 | -13.886 | 73.703 | 432.020 | 432.020 | 432.020 | 445.906 | 445.906 | 141.512 | 93.930 | ms | 1.772 | 4.593 | ||
| Server Offset 139.177.202.26 | 2.369 | 2.369 | 2.369 | 4.015 | 6.368 | 6.368 | 6.368 | 3.999 | 3.999 | 1.383 | 4.077 | ms | 0.4653 | 1.842 | ||
| Server Offset 139.84.137.244 | -88.151 | -30.357 | -5.928 | 8.689 | 18.170 | 23.381 | 33.775 | 24.098 | 53.738 | 9.137 | 7.587 | ms | -3.588 | 27.15 | ||
| Server Offset 139.94.144.123 | 7.327 | 7.327 | 7.327 | 7.569 | 8.239 | 8.239 | 8.239 | 0.913 | 0.913 | 0.357 | 7.696 | ms | 0.4162 | 1.533 | ||
| Server Offset 141.11.89.193 | -5.133 | -3.834 | -2.747 | 0.216 | 3.825 | 5.337 | 7.287 | 6.572 | 9.171 | 2.098 | 0.486 | ms | 0.248 | 2.697 | ||
| Server Offset 142.202.190.19 | -2.514 | -2.514 | -2.514 | 0.562 | 4.040 | 4.040 | 4.040 | 6.554 | 6.554 | 1.834 | 0.714 | ms | 0.1866 | 2.03 | ||
| Server Offset 142.248.80.92 | 3.101 | 3.101 | 3.101 | 8.205 | 12.589 | 12.589 | 12.589 | 9.488 | 9.488 | 2.921 | 7.543 | ms | 0.2515 | 2.405 | ||
| Server Offset 143.42.229.154 | -24.531 | -9.314 | -5.526 | 0.643 | 5.859 | 8.889 | 16.272 | 11.384 | 18.203 | 3.684 | 0.419 | ms | -0.6014 | 8.176 | ||
| Server Offset 144.202.0.197 | -112.597 | -110.963 | -2.839 | 1.509 | 4.185 | 5.020 | 7.488 | 7.024 | 115.983 | 13.445 | -0.323 | ms | -7.986 | 66.41 | ||
| Server Offset 144.202.41.38 | -8.294 | -8.294 | -8.294 | 10.653 | 20.588 | 20.588 | 20.588 | 28.882 | 28.882 | 6.808 | 8.785 | ms | -0.8454 | 3.947 | ||
| Server Offset 144.202.62.209 | -359.531 | -4.209 | -1.517 | 1.251 | 5.257 | 7.227 | 36.327 | 6.774 | 11.436 | 27.588 | -0.646 | ms | -11.94 | 150 | ||
| Server Offset 144.202.66.214 | -1,991.190 | -5.972 | 2.629 | 9.116 | 12.650 | 26.232 | 405.866 | 10.021 | 32.203 | 139.131 | -0.132 | ms | -13.95 | 200 | ||
| Server Offset 144.31.251.154 | -1.884 | -1.884 | -1.884 | 1.637 | 9.630 | 9.630 | 9.630 | 11.515 | 11.515 | 4.100 | 3.810 | ms | 0.1811 | 1.537 | ||
| Server Offset 144.76.66.157 | -3.402 | -3.402 | -3.402 | -0.816 | 3.576 | 3.576 | 3.576 | 6.977 | 6.977 | 2.655 | -0.287 | ms | 0.3401 | 1.604 | ||
| Server Offset 147.88.195.53 | -119.005 | -102.607 | -72.223 | -5.953 | 6.214 | 10.280 | 13.559 | 78.438 | 112.887 | 24.442 | -16.854 | ms | -1.622 | 5.339 | ||
| Server Offset 148.163.226.148 | -76.672 | -76.672 | -76.672 | 2.891 | 6.433 | 6.433 | 6.433 | 83.105 | 83.105 | 25.184 | -5.515 | ms | -2.465 | 7.097 | ||
| Server Offset 149.248.12.167 | -8.248 | -8.248 | -5.145 | 3.379 | 12.833 | 13.486 | 13.486 | 17.978 | 21.734 | 4.968 | 2.979 | ms | 0.2457 | 2.932 | ||
| Server Offset 149.28.200.179 | -88.226 | -86.256 | -9.082 | 0.875 | 6.594 | 11.091 | 14.392 | 15.676 | 97.347 | 9.995 | -0.363 | ms | -7.077 | 60.97 | ||
| Server Offset 149.28.61.105 | -1,995.498 | -17.899 | -3.536 | 3.526 | 6.244 | 11.798 | 44.622 | 9.780 | 29.697 | 146.291 | -7.946 | ms | -13.48 | 182.9 | ||
| Server Offset 151.236.20.166 | -7.947 | -5.621 | -3.416 | 0.364 | 5.984 | 9.517 | 13.621 | 9.399 | 15.138 | 3.092 | 0.765 | ms | 0.5972 | 3.916 | ||
| Server Offset 155.248.196.28 | -7.263 | -4.833 | -2.774 | 0.162 | 4.381 | 7.586 | 11.821 | 7.155 | 12.418 | 2.274 | 0.520 | ms | 0.7526 | 4.999 | ||
| Server Offset 157.245.125.229 | -11.025 | -0.605 | 1.272 | 5.230 | 7.446 | 8.834 | 14.151 | 6.173 | 9.439 | 2.038 | 4.890 | ms | -0.9644 | 8.059 | ||
| Server Offset 158.51.99.19 | -157.868 | -3.938 | -0.237 | 3.374 | 5.765 | 9.486 | 24.445 | 6.002 | 13.424 | 10.501 | 2.610 | ms | -13.72 | 206.1 | ||
| Server Offset 159.203.158.197 | -3.409 | -2.313 | 0.649 | 5.552 | 7.905 | 8.880 | 9.205 | 7.257 | 11.193 | 2.163 | 5.248 | ms | -1.443 | 6.054 | ||
| Server Offset 161.35.230.200 | -2.730 | -2.730 | -1.127 | 1.511 | 390.595 | 395.667 | 395.667 | 391.722 | 398.397 | 147.881 | 68.930 | ms | 1.72 | 3.961 | ||
| Server Offset 162.159.200.1 | -33.205 | -2.721 | -0.176 | 4.894 | 7.533 | 9.550 | 392.310 | 7.709 | 12.272 | 14.429 | 4.965 | ms | 25.84 | 690.8 | ||
| Server Offset 162.159.200.123 | -1,990.740 | -3.157 | 0.042 | 5.862 | 8.977 | 11.927 | 41.636 | 8.935 | 15.084 | 40.692 | 4.710 | ms | -48.73 | 2389 | ||
| Server Offset 162.244.81.139 | -358.787 | -176.780 | -2.089 | 2.650 | 5.489 | 8.702 | 11.561 | 7.578 | 185.481 | 34.896 | -1.383 | ms | -9.428 | 92.93 | ||
| Server Offset 162.254.225.151 | -17.956 | -15.060 | -5.708 | 10.223 | 16.437 | 18.274 | 18.494 | 22.145 | 33.334 | 6.977 | 8.368 | ms | -1.195 | 4.441 | ||
| Server Offset 162.254.225.152 | -1.848 | -1.848 | -1.848 | 11.984 | 17.922 | 17.922 | 17.922 | 19.770 | 19.770 | 5.527 | 10.638 | ms | -0.901 | 3.021 | ||
| Server Offset 163.123.152.14 | 8.299 | 8.299 | 8.299 | 9.300 | 12.567 | 12.567 | 12.567 | 4.268 | 4.268 | 1.664 | 9.751 | ms | 0.9993 | 2.22 | ||
| Server Offset 163.123.153.14 | -11.080 | -9.441 | -6.494 | -0.864 | 5.239 | 8.821 | 18.438 | 11.732 | 18.261 | 3.609 | -0.733 | ms | 0.5776 | 5.508 | ||
| Server Offset 166.88.142.52 | 2.966 | 2.966 | 2.966 | 4.246 | 7.638 | 7.638 | 7.638 | 4.671 | 4.671 | 1.508 | 4.329 | ms | 1.273 | 3.521 | ||
| Server Offset 168.235.89.132 | -361.703 | -177.856 | -1.214 | 2.049 | 6.635 | 8.852 | 9.305 | 7.848 | 186.709 | 37.893 | -2.184 | ms | -8.706 | 79.36 | ||
| Server Offset 170.187.147.56 | -0.641 | 0.705 | 1.980 | 4.722 | 8.587 | 9.921 | 12.448 | 6.607 | 9.216 | 2.044 | 4.934 | ms | 0.3738 | 3.245 | ||
| Server Offset 171.66.97.126 | -111.117 | -109.795 | -2.851 | 0.792 | 3.175 | 6.263 | 130.236 | 6.027 | 116.058 | 15.291 | -0.217 | ms | -2.186 | 57.79 | ||
| Server Offset 172.104.28.175 | -1.388 | -1.388 | -1.388 | -0.100 | 3.196 | 3.196 | 3.196 | 4.583 | 4.583 | 1.717 | 0.342 | ms | 0.8717 | 2.171 | ||
| Server Offset 172.232.15.202 | 0.710 | 0.710 | 0.710 | 4.702 | 38.555 | 38.555 | 38.555 | 37.846 | 37.846 | 15.838 | 13.311 | ms | 0.9197 | 1.889 | ||
| Server Offset 172.233.153.85 | -9.447 | -9.196 | -7.932 | -3.852 | 1.978 | 2.524 | 2.830 | 9.910 | 11.720 | 3.072 | -3.587 | ms | 0.398 | 2.315 | ||
| Server Offset 172.233.155.39 | -12.270 | -2.993 | -0.238 | 3.828 | 6.492 | 7.576 | 9.891 | 6.730 | 10.570 | 2.348 | 3.523 | ms | -1.715 | 12.15 | ||
| Server Offset 172.233.157.223 | -34.981 | -2.753 | -0.945 | 2.900 | 14.155 | 443.646 | 725.734 | 15.100 | 446.399 | 61.368 | 11.433 | ms | 8.767 | 85.81 | ||
| Server Offset 172.233.177.198 | -5.527 | -5.527 | -5.527 | 3.622 | 7.415 | 7.415 | 7.415 | 12.942 | 12.942 | 3.634 | 2.383 | ms | -0.9084 | 3.103 | ||
| Server Offset 172.233.189.68 | 0.880 | 1.706 | 3.586 | 9.337 | 13.869 | 16.678 | 17.957 | 10.283 | 14.973 | 3.107 | 9.013 | ms | -0.04156 | 3.157 | ||
| Server Offset 172.234.25.10 | -378.349 | -376.717 | 0.628 | 6.419 | 13.831 | 393.676 | 399.088 | 13.203 | 770.393 | 71.780 | 4.992 | ms | -0.5597 | 28.69 | ||
| Server Offset 172.234.37.140 | -384.852 | -24.916 | -12.855 | 3.638 | 9.759 | 35.486 | 41.762 | 22.614 | 60.401 | 38.808 | -0.901 | ms | -9.283 | 91.27 | ||
| Server Offset 172.234.44.141 | -1.177 | -0.747 | 1.570 | 5.464 | 9.373 | 13.230 | 14.363 | 7.803 | 13.977 | 2.599 | 5.476 | ms | 0.3544 | 4.619 | ||
| Server Offset 172.235.154.118 | -1.805 | 0.077 | 3.315 | 7.192 | 10.233 | 14.821 | 16.912 | 6.918 | 14.744 | 2.413 | 7.174 | ms | 0.02952 | 5.667 | ||
| Server Offset 172.235.60.8 | -1,994.828 | -7.193 | -2.951 | 1.687 | 6.652 | 8.955 | 47.412 | 9.602 | 16.148 | 100.097 | -3.238 | ms | -19.74 | 391.2 | ||
| Server Offset 172.238.164.57 | -20.678 | -5.109 | -3.388 | 1.693 | 6.481 | 7.573 | 11.018 | 9.869 | 12.682 | 3.241 | 1.724 | ms | -0.3793 | 3.926 | ||
| Server Offset 172.245.210.108 | -261.506 | -261.506 | -251.411 | 0.386 | 170.775 | 173.801 | 173.801 | 422.186 | 435.307 | 82.626 | -6.480 | ms | -0.7581 | 6.622 | ||
| Server Offset 173.249.203.227 | 2.418 | 2.418 | 2.418 | 7.578 | 11.331 | 11.331 | 11.331 | 8.912 | 8.912 | 2.607 | 6.865 | ms | -0.2799 | 2.399 | ||
| Server Offset 173.255.230.96 | -4.019 | -1.915 | 0.365 | 4.658 | 8.077 | 9.189 | 28.541 | 7.712 | 11.104 | 2.614 | 4.581 | ms | 2.225 | 26.93 | ||
| Server Offset 173.255.255.133 | -1.715 | -1.715 | -1.715 | -0.964 | 1.511 | 1.511 | 1.511 | 3.226 | 3.226 | 1.274 | -0.647 | ms | 1.007 | 2.214 | ||
| Server Offset 178.156.185.92 | -26.222 | -8.831 | -4.147 | -0.703 | 5.776 | 8.694 | 15.799 | 9.923 | 17.525 | 3.089 | -0.428 | ms | -0.01771 | 10.84 | ||
| Server Offset 185.214.143.237 | -1.142 | -1.142 | 0.235 | 4.432 | 9.788 | 396.180 | 396.180 | 9.553 | 397.322 | 67.845 | 16.688 | ms | 5.377 | 29.95 | ||
| Server Offset 185.234.20.134 | -207.966 | -198.229 | 8.539 | 43.765 | 55.709 | 222.317 | 228.892 | 47.170 | 420.546 | 42.923 | 39.520 | ms | -0.8843 | 22.3 | ||
| Server Offset 192.207.55.254 | -68.913 | -55.256 | -6.572 | 0.132 | 6.972 | 15.177 | 22.208 | 13.544 | 70.432 | 8.299 | -0.601 | ms | -5.484 | 44.3 | ||
| Server Offset 192.231.84.117 | -2.391 | -2.391 | 1.478 | 4.260 | 7.283 | 65.926 | 65.926 | 5.805 | 68.317 | 9.116 | 5.351 | ms | 6.221 | 41.5 | ||
| Server Offset 192.231.84.118 | -13.353 | -5.910 | -3.636 | 1.189 | 6.565 | 9.659 | 13.476 | 10.201 | 15.569 | 3.189 | 1.298 | ms | 0.1704 | 4.599 | ||
| Server Offset 192.48.105.15 | -38.144 | -16.120 | -9.873 | 4.243 | 8.544 | 13.335 | 24.385 | 18.417 | 29.455 | 5.972 | 2.916 | ms | -2.066 | 11.6 | ||
| Server Offset 193.29.63.226 | -3.460 | -3.460 | -3.460 | 3.103 | 9.170 | 9.170 | 9.170 | 12.629 | 12.629 | 3.530 | 2.605 | ms | 0.006634 | 1.907 | ||
| Server Offset 194.0.5.123 | -1,993.360 | -6.802 | -3.131 | 1.946 | 7.362 | 10.340 | 898.980 | 10.494 | 17.142 | 45.184 | 1.508 | ms | -37.13 | 1737 | ||
| Server Offset 198.137.202.56 | -206.226 | -10.041 | -4.536 | -0.451 | 4.604 | 14.936 | 34.211 | 9.140 | 24.977 | 10.104 | -0.736 | ms | -14.4 | 266 | ||
| Server Offset 198.206.187.98 | -51.757 | -51.757 | -51.757 | -48.763 | -19.447 | -19.447 | -19.447 | 32.310 | 32.310 | 11.963 | -43.169 | ms | 1.436 | 3.168 | ||
| Server Offset 198.23.132.33 | -2.897 | -2.897 | -2.897 | 9.802 | 12.642 | 12.642 | 12.642 | 15.539 | 15.539 | 4.534 | 7.741 | ms | -1.402 | 4.019 | ||
| Server Offset 198.46.254.130 | -11.109 | -10.105 | -8.900 | -0.000 | 6.524 | 48.594 | 50.250 | 15.424 | 58.699 | 6.597 | 0.210 | ms | 4.556 | 35.9 | ||
| Server Offset 198.60.22.240 | -144.129 | -144.129 | -144.129 | 9.541 | 18.010 | 18.010 | 18.010 | 162.140 | 162.140 | 65.641 | -23.178 | ms | -1.269 | 2.625 | ||
| Server Offset 198.71.50.75 | -21.461 | -16.971 | -10.397 | -4.651 | -1.037 | 1.083 | 5.931 | 9.360 | 18.054 | 3.141 | -4.906 | ms | -1.601 | 9.855 | ||
| Server Offset 199.68.201.237 | -54.221 | -4.457 | -2.342 | 2.245 | 5.491 | 7.434 | 14.187 | 7.833 | 11.890 | 3.323 | 1.891 | ms | -8.342 | 141.8 | ||
| Server Offset 20.55.26.153 | -90.128 | -90.128 | -90.128 | 0.419 | 4.026 | 4.026 | 4.026 | 94.154 | 94.154 | 29.373 | -11.273 | ms | -2.13 | 5.815 | ||
| Server Offset 2001:1600:13:101::16b7 | -48.803 | -25.492 | -13.939 | -1.873 | 9.982 | 15.177 | 36.277 | 23.921 | 40.669 | 7.350 | -1.722 | ms | -1.042 | 9.167 | ||
| Server Offset 2001:19f0:1590:5123:1057:a11:da7a:1 (lithium.constant.com) | 0.989 | 0.989 | 0.989 | 6.668 | 7.419 | 7.419 | 7.419 | 6.430 | 6.430 | 2.339 | 5.470 | ms | -1.22 | 2.835 | ||
| Server Offset 2001:19f0:6401:400:5400:4ff:fec3:522a | 2.311 | 2.311 | 2.311 | 4.048 | 6.282 | 6.282 | 6.282 | 3.971 | 3.971 | 1.514 | 3.891 | ms | 0.635 | 1.891 | ||
| Server Offset 2001:418:3ff::53 (x.ns.gin.ntt.net) | 4.247 | 4.247 | 4.247 | 7.231 | 8.571 | 8.571 | 8.571 | 4.324 | 4.324 | 1.678 | 6.539 | ms | -0.2545 | 1.376 | ||
| Server Offset 2001:41d0:303:65e9::1 | -150.721 | -116.304 | -14.598 | 3.013 | 11.624 | 159.827 | 305.196 | 26.222 | 276.131 | 26.191 | 2.233 | ms | 3.209 | 53 | ||
| Server Offset 2001:470:1f07:24f::123 | 5.692 | 5.692 | 5.692 | 8.660 | 52.245 | 52.245 | 52.245 | 46.552 | 46.552 | 15.577 | 16.463 | ms | 1.347 | 3.154 | ||
| Server Offset 2001:470:a:b4::2 (dell-2018.jamesb912.com.) | -4.391 | -4.391 | -4.391 | -4.391 | -4.391 | -4.391 | -4.391 | 0.000 | 0.000 | 0.000 | -4.391 | ms | nan | nan | ||
| Server Offset 2001:4998:c:1028::1001 (t2.time.gq1.yahoo.com) | -157.180 | 0.965 | 3.243 | 5.473 | 7.719 | 9.995 | 23.242 | 4.475 | 9.030 | 5.538 | 5.305 | ms | -26.07 | 749.2 | ||
| Server Offset 2001:559:2be:3::1001 | 2.838 | 2.838 | 2.838 | 6.118 | 9.658 | 9.658 | 9.658 | 6.820 | 6.820 | 2.006 | 6.562 | ms | -0.1996 | 2.201 | ||
| Server Offset 2001:678:8::123 (any.time.nl) | -421.375 | -23.078 | -11.859 | -6.575 | -3.251 | -0.150 | 589.234 | 8.607 | 22.927 | 8.794 | -7.106 | ms | 20.66 | 2760 | ||
| Server Offset 204.2.134.173 | -330.587 | -1.995 | 0.505 | 4.402 | 7.005 | 7.870 | 8.684 | 6.500 | 9.866 | 24.915 | 2.289 | ms | -13.06 | 173.8 | ||
| Server Offset 206.210.192.99 | 3.732 | 3.732 | 3.732 | 10.882 | 12.986 | 12.986 | 12.986 | 9.255 | 9.255 | 2.868 | 9.737 | ms | -0.9345 | 2.785 | ||
| Server Offset 207.244.103.95 | -7.124 | -7.124 | 0.999 | 10.585 | 17.648 | 18.445 | 18.445 | 16.649 | 25.569 | 4.483 | 9.686 | ms | -1.342 | 6.812 | ||
| Server Offset 208.113.130.146 | -3.011 | -0.930 | 0.782 | 4.158 | 6.717 | 8.251 | 10.594 | 5.936 | 9.181 | 1.878 | 3.976 | ms | -0.3391 | 3.503 | ||
| Server Offset 208.70.148.101 | -5.820 | -0.448 | 1.316 | 5.542 | 7.187 | 8.320 | 13.983 | 5.871 | 8.768 | 1.888 | 5.190 | ms | -1.4 | 11.05 | ||
| Server Offset 209.177.158.85 | -30.375 | -4.642 | -3.180 | 0.545 | 5.452 | 6.644 | 15.829 | 8.632 | 11.286 | 3.226 | 0.948 | ms | -2.144 | 24.9 | ||
| Server Offset 209.205.228.50 | 7.010 | 7.010 | 7.010 | 18.187 | 24.067 | 24.067 | 24.067 | 17.057 | 17.057 | 5.704 | 16.869 | ms | -0.6241 | 2.005 | ||
| Server Offset 209.253.210.112 | -43.512 | -14.756 | -5.824 | 2.424 | 9.845 | 16.262 | 21.137 | 15.669 | 31.017 | 6.264 | 2.033 | ms | -3.022 | 24.48 | ||
| Server Offset 209.51.161.238 | -153.422 | -127.019 | -23.151 | 0.591 | 8.422 | 219.405 | 221.766 | 31.573 | 346.425 | 38.719 | 1.412 | ms | 3.117 | 25.69 | ||
| Server Offset 212.227.240.160 | -12.742 | -12.742 | -4.033 | -0.067 | 6.879 | 8.150 | 8.150 | 10.912 | 20.892 | 3.698 | 0.090 | ms | -0.4662 | 4.896 | ||
| Server Offset 213.108.170.26 | -4.269 | -4.269 | -4.269 | -1.792 | 2.919 | 2.919 | 2.919 | 7.189 | 7.189 | 2.884 | -0.922 | ms | 0.2241 | 1.32 | ||
| Server Offset 216.229.0.50 | -5.338 | -5.338 | -4.006 | 1.384 | 897.146 | 898.740 | 898.740 | 901.151 | 904.079 | 243.079 | 73.841 | ms | 3.093 | 10.58 | ||
| Server Offset 216.229.4.66 | -17.026 | -11.524 | -4.993 | 0.122 | 5.823 | 10.083 | 13.185 | 10.816 | 21.607 | 4.073 | 0.504 | ms | -0.5136 | 4.899 | ||
| Server Offset 216.250.115.174 | -50.737 | -41.571 | -23.334 | -12.434 | -0.066 | 364.314 | 369.510 | 23.268 | 405.885 | 47.821 | -6.497 | ms | 7.428 | 58.12 | ||
| Server Offset 216.66.48.42 | -57.714 | -48.968 | -41.803 | -10.099 | 4.232 | 45.537 | 48.178 | 46.035 | 94.505 | 15.518 | -12.901 | ms | 0.07764 | 5.238 | ||
| Server Offset 216.82.35.115 | -29.297 | -29.297 | -9.388 | -1.589 | 392.815 | 392.815 | 392.815 | 402.203 | 422.112 | 140.650 | 54.907 | ms | 1.952 | 4.828 | ||
| Server Offset 217.197.83.230 | -644.978 | -120.144 | -90.030 | -2.361 | 9.869 | 21.281 | 25.380 | 99.899 | 141.425 | 57.356 | -19.975 | ms | -7.154 | 70.61 | ||
| Server Offset 23.111.186.186 | 0.800 | 0.800 | 0.800 | 2.292 | 3.617 | 3.617 | 3.617 | 2.817 | 2.817 | 0.849 | 2.280 | ms | -0.2598 | 2.078 | ||
| Server Offset 23.141.40.123 | 27.455 | 27.455 | 27.455 | 33.456 | 37.132 | 37.132 | 37.132 | 9.678 | 9.678 | 2.992 | 32.642 | ms | -0.3048 | 2.39 | ||
| Server Offset 23.142.248.8 | -3.042 | 1.210 | 6.116 | 10.765 | 12.869 | 13.726 | 15.979 | 6.753 | 12.515 | 2.251 | 10.327 | ms | -1.931 | 8.788 | ||
| Server Offset 23.142.248.9 | -263.459 | -263.459 | -261.533 | -1.198 | 167.901 | 168.098 | 168.098 | 429.434 | 431.557 | 92.982 | -6.282 | ms | -0.7409 | 5.495 | ||
| Server Offset 23.143.196.199 | 2.248 | 2.248 | 2.248 | 3.906 | 5.387 | 5.387 | 5.387 | 3.139 | 3.139 | 1.032 | 4.058 | ms | -0.2914 | 2.021 | ||
| Server Offset 23.143.196.201 | -3.248 | -2.432 | -1.161 | 2.192 | 5.184 | 5.896 | 6.528 | 6.345 | 8.328 | 2.016 | 2.129 | ms | -0.2213 | 2.34 | ||
| Server Offset 23.143.196.204 | -107.049 | -94.828 | -7.774 | 0.136 | 6.684 | 220.984 | 222.164 | 14.458 | 315.812 | 33.455 | 2.740 | ms | 5.036 | 36.93 | ||
| Server Offset 23.150.40.242 | -357.926 | -357.926 | -357.926 | 3.502 | 10.525 | 10.525 | 10.525 | 368.451 | 368.451 | 119.758 | -47.624 | ms | -1.976 | 5.174 | ||
| Server Offset 23.150.41.122 | -3.912 | -0.906 | 1.567 | 5.532 | 9.044 | 10.304 | 12.219 | 7.477 | 11.210 | 2.174 | 5.373 | ms | -0.477 | 4.713 | ||
| Server Offset 23.150.41.123 | -22.902 | -6.030 | -2.730 | 7.633 | 11.334 | 22.936 | 32.724 | 14.064 | 28.966 | 4.915 | 6.544 | ms | -0.1661 | 7.953 | ||
| Server Offset 23.155.40.38 | -158.747 | -42.839 | -3.587 | 1.531 | 3.890 | 6.081 | 8.018 | 7.477 | 48.920 | 15.680 | -0.567 | ms | -9.275 | 91.75 | ||
| Server Offset 23.155.72.147 | -392.987 | -391.252 | -12.441 | -6.112 | -0.837 | 1.703 | 7.397 | 11.604 | 392.955 | 61.955 | -16.524 | ms | -5.782 | 34.56 | ||
| Server Offset 23.157.100.123 | -4.745 | -3.123 | -2.383 | 0.872 | 4.094 | 7.697 | 13.088 | 6.477 | 10.821 | 2.230 | 0.872 | ms | 1.057 | 7.789 | ||
| Server Offset 23.157.160.168 | -5.068 | -1.215 | 0.086 | 3.583 | 6.081 | 7.468 | 9.623 | 5.995 | 8.683 | 1.775 | 3.402 | ms | -0.5016 | 4.099 | ||
| Server Offset 23.159.16.194 | -332.773 | -2.949 | 1.895 | 12.336 | 15.900 | 21.536 | 27.238 | 14.005 | 24.484 | 25.353 | 9.220 | ms | -12.89 | 173.5 | ||
| Server Offset 23.161.104.133 | -2,049.972 | -101.074 | -80.336 | -9.695 | 8.763 | 15.686 | 36.039 | 89.098 | 116.761 | 72.603 | -20.023 | ms | -24.13 | 673.1 | ||
| Server Offset 23.168.24.210 | -30.994 | -9.946 | -0.456 | 4.953 | 9.479 | 14.370 | 15.899 | 9.935 | 24.316 | 3.912 | 4.627 | ms | -3.016 | 28.6 | ||
| Server Offset 23.172.120.58 | -79.949 | -79.949 | -79.949 | 2.744 | 9.020 | 9.020 | 9.020 | 88.969 | 88.969 | 28.367 | -11.643 | ms | -1.482 | 3.759 | ||
| Server Offset 23.186.168.123 | -18.265 | -7.473 | -3.660 | 1.767 | 4.077 | 5.137 | 24.970 | 7.737 | 12.610 | 2.589 | 1.198 | ms | -1.386 | 9.449 | ||
| Server Offset 23.186.168.124 | -7.176 | -6.031 | -5.380 | -1.281 | 2.774 | 3.857 | 4.744 | 8.154 | 9.888 | 2.555 | -1.268 | ms | 0.008223 | 2.264 | ||
| Server Offset 23.186.168.125 | -336.573 | -5.459 | -2.373 | 1.898 | 4.226 | 5.955 | 897.143 | 6.599 | 11.414 | 22.668 | 1.625 | ms | 27.25 | 1248 | ||
| Server Offset 23.186.168.126 | -114.793 | -5.494 | -2.029 | 1.669 | 3.740 | 5.283 | 10.039 | 5.769 | 10.777 | 10.165 | 0.545 | ms | -10.67 | 118.6 | ||
| Server Offset 23.186.168.127 | -58.630 | -25.454 | -3.967 | -0.269 | 2.056 | 2.794 | 17.173 | 6.023 | 28.248 | 5.716 | -1.006 | ms | -8.057 | 76.54 | ||
| Server Offset 23.186.168.128 | -7.831 | -6.730 | -4.726 | 1.455 | 4.924 | 6.120 | 63.422 | 9.650 | 12.850 | 4.415 | 1.087 | ms | 7.553 | 110.7 | ||
| Server Offset 23.186.168.129 | -100.937 | -8.499 | -4.716 | 2.006 | 5.778 | 10.678 | 903.521 | 10.494 | 19.177 | 32.186 | 2.505 | ms | 23.73 | 641.5 | ||
| Server Offset 23.186.168.130 | -55.890 | -48.645 | -2.696 | 1.561 | 4.167 | 5.438 | 18.506 | 6.863 | 54.083 | 6.377 | 0.637 | ms | -7.029 | 58.13 | ||
| Server Offset 23.186.168.131 | -101.224 | -14.992 | -10.507 | -2.050 | 4.758 | 216.109 | 218.513 | 15.265 | 231.100 | 24.800 | -0.328 | ms | 7.25 | 68.58 | ||
| Server Offset 23.186.168.132 | -9.048 | -8.170 | -7.030 | -3.318 | -1.756 | -0.801 | -0.358 | 5.274 | 7.370 | 1.536 | -3.601 | ms | -1.052 | 4.19 | ||
| Server Offset 23.186.168.133 | -7.844 | -6.607 | -5.595 | -2.001 | 2.119 | 2.715 | 3.271 | 7.713 | 9.323 | 2.577 | -1.805 | ms | 0.003423 | 2.023 | ||
| Server Offset 23.93.251.54 | -51.217 | -48.316 | 1.849 | 5.492 | 7.678 | 9.363 | 23.453 | 5.829 | 57.678 | 7.050 | 4.320 | ms | -6.582 | 49.67 | ||
| Server Offset 23.95.35.34 | -27.613 | -4.807 | -3.147 | 0.347 | 4.555 | 6.819 | 20.501 | 7.701 | 11.627 | 2.606 | 0.524 | ms | -0.5651 | 20.3 | ||
| Server Offset 23.95.49.216 | 2.004 | 2.004 | 2.004 | 5.904 | 7.369 | 7.369 | 7.369 | 5.365 | 5.365 | 1.531 | 5.662 | ms | -0.973 | 3.221 | ||
| Server Offset 2401:c080:3000:2945:5400:4ff:fe69:f923 (ntpd-rs.sidnlabs.nl) | -78.463 | -36.395 | -20.979 | -11.546 | -3.410 | 27.956 | 685.845 | 17.569 | 64.351 | 13.179 | -11.475 | ms | 30.75 | 1614 | ||
| Server Offset 2402:1f00:8101:d6::1 | -36.205 | -6.436 | 12.070 | 35.428 | 47.477 | 49.168 | 69.786 | 35.407 | 55.604 | 12.669 | 33.985 | ms | -1.139 | 5.04 | ||
| Server Offset 240b:4004:108:200:8314:1a08:4cee:26d8 | -10.660 | -10.660 | -1.669 | 2.211 | 424.412 | 425.724 | 425.724 | 426.080 | 436.384 | 113.328 | 48.896 | ms | 2.876 | 9.733 | ||
| Server Offset 240b:4004:108:200:8314:1a08:4cee:26d9 | 3.332 | 3.332 | 3.332 | 5.399 | 14.354 | 14.354 | 14.354 | 11.022 | 11.022 | 4.410 | 6.823 | ms | 1.061 | 2.259 | ||
| Server Offset 240b:4004:108:200:8314:1a08:4cee:2acf | -55.272 | -55.272 | -55.272 | 0.474 | 2.640 | 2.640 | 2.640 | 57.912 | 57.912 | 17.808 | -5.000 | ms | -2.456 | 7.073 | ||
| Server Offset 2600:1702:80c0:9a80:1ee4:b0a2:44bc:c606 | 7.543 | 7.543 | 7.543 | 43.369 | 48.456 | 48.456 | 48.456 | 40.913 | 40.913 | 18.767 | 27.247 | ms | 0.02285 | 1.042 | ||
| Server Offset 2600:1900:4060:2e7:: (0.0.0.0.0.0.0.0.0.0.0.0.0.0.0.0.7.e.2.0.0.6.0.4.0.0.9.1.0.0.6.2.bc.googleusercontent.com) | -90.591 | -30.497 | -16.610 | 2.198 | 7.128 | 11.479 | 312.713 | 23.738 | 41.976 | 8.531 | 0.406 | ms | 1.915 | 169.9 | ||
| Server Offset 2600:1f13:2c1:2e00::be00:5 | 1.672 | 1.672 | 1.672 | 5.591 | 19.969 | 19.969 | 19.969 | 18.297 | 18.297 | 5.131 | 6.284 | ms | 1.945 | 5.754 | ||
| Server Offset 2600:1f13:eda:9800:bcd8:839c:9b40:25b2 (oregon.time.system76.com) | -155.691 | -7.428 | -5.748 | 3.095 | 6.249 | 8.012 | 110.743 | 11.997 | 15.440 | 4.982 | 1.630 | ms | -2.631 | 231.8 | ||
| Server Offset 2600:1f16:42a:1d00:2169:fe07:2acc:6002 (ohio.time.system76.com) | -159.116 | -7.011 | -3.874 | 3.436 | 6.636 | 8.466 | 422.200 | 10.510 | 15.477 | 6.435 | 2.487 | ms | 19.37 | 1687 | ||
| Server Offset 2600:1f18:4c51:e200:e142:210a:306d:4872 (virginia.time.system76.com) | -158.177 | -23.589 | -6.049 | 3.796 | 7.392 | 10.039 | 415.823 | 13.440 | 33.628 | 7.751 | 2.204 | ms | 10.06 | 762.3 | ||
| Server Offset 2600:1f18:7927:8b00:123:: | 4.710 | 4.710 | 4.710 | 6.720 | 8.399 | 8.399 | 8.399 | 3.689 | 3.689 | 1.160 | 6.461 | ms | 0.06963 | 2.058 | ||
| Server Offset 2600:3c00:e000:318::1 (jane.qotw.net) | 0.897 | 0.897 | 0.897 | 7.015 | 9.022 | 9.022 | 9.022 | 8.126 | 8.126 | 2.823 | 5.475 | ms | -0.456 | 1.786 | ||
| Server Offset 2600:3c01::f03c:93ff:fe5b:8a7d (us-west-1.clearnet.pw) | 2.725 | 2.725 | 2.725 | 5.114 | 14.625 | 14.625 | 14.625 | 11.900 | 11.900 | 4.070 | 5.808 | ms | 1.545 | 3.777 | ||
| Server Offset 2600:3c01::f03c:93ff:fedd:5a1f (sensei.ruselabs.com) | -16.936 | -16.936 | -5.885 | 2.642 | 423.840 | 424.816 | 424.816 | 429.725 | 441.752 | 116.114 | 50.434 | ms | 2.724 | 8.986 | ||
| Server Offset 2600:3c01:e000:7e6::123 (time1.sigi.net) | -1.578 | -1.578 | -1.405 | 3.186 | 8.862 | 9.541 | 9.541 | 10.268 | 11.119 | 3.175 | 3.561 | ms | 0.1796 | 1.906 | ||
| Server Offset 2600:3c02::f03c:94ff:fe59:f411 | 3.748 | 3.748 | 3.748 | 6.064 | 12.748 | 12.748 | 12.748 | 9.000 | 9.000 | 3.879 | 7.163 | ms | 0.6006 | 1.484 | ||
| Server Offset 2600:3c03::f03c:91ff:fedf:1e98 (li1.forfun.net) | -24.915 | -24.915 | -24.915 | 67.309 | 423.497 | 423.497 | 423.497 | 448.412 | 448.412 | 136.652 | 85.591 | ms | 1.84 | 4.92 | ||
| Server Offset 2600:3c06::f03c:94ff:fee2:9c28 | 5.742 | 5.742 | 5.742 | 7.946 | 15.389 | 15.389 | 15.389 | 9.646 | 9.646 | 3.904 | 8.785 | ms | 1.004 | 2.198 | ||
| Server Offset 2600:3c06::f03c:94ff:fee2:c53a | 7.934 | 7.934 | 7.934 | 10.652 | 34.769 | 34.769 | 34.769 | 26.835 | 26.835 | 12.061 | 17.785 | ms | 0.6803 | 1.5 | ||
| Server Offset 2602:2b7:d11:f4::122 (s2-b.time.mci1.us.rozint.net) | -158.684 | -158.684 | -158.684 | 0.437 | 10.845 | 10.845 | 10.845 | 169.529 | 169.529 | 64.330 | -32.192 | ms | -1.378 | 2.929 | ||
| Server Offset 2602:80b:5000::36 (time.meme.holdings) | -26.339 | -9.392 | 1.266 | 5.868 | 9.817 | 23.455 | 24.890 | 8.551 | 32.847 | 4.663 | 5.601 | ms | -1.967 | 22.8 | ||
| Server Offset 2602:81b:9000::c10c (time.sea.ordinaladvisors.com) | -2.396 | -2.396 | -2.396 | 0.748 | 11.083 | 11.083 | 11.083 | 13.479 | 13.479 | 3.735 | 2.173 | ms | 1.096 | 3.17 | ||
| Server Offset 2602:f590::23:161:104:133 (isere.sd.ysun.co) | -471.581 | -385.176 | -54.827 | -11.476 | 0.126 | 5.242 | 28.182 | 54.953 | 390.419 | 61.385 | -26.183 | ms | -5.774 | 37.6 | ||
| Server Offset 2602:f9ba:69::210 (as393746.mci.trtnw.net) | -12.175 | -1.360 | 4.707 | 9.530 | 16.745 | 20.179 | 20.349 | 12.038 | 21.539 | 4.125 | 9.733 | ms | -0.5412 | 8.171 | ||
| Server Offset 2602:fb95:16::123 (time5.sigi.net) | -3.415 | -3.415 | -3.415 | 2.197 | 8.657 | 8.657 | 8.657 | 12.072 | 12.072 | 3.322 | 1.725 | ms | 0.2884 | 2.931 | ||
| Server Offset 2602:fd50:100:108:3491:d3b2:eef8:f324 (ntp.netlinkify.com) | -2.937 | -2.937 | -1.379 | 2.434 | 7.512 | 9.493 | 9.493 | 8.892 | 12.430 | 2.905 | 2.389 | ms | 0.4696 | 3.021 | ||
| Server Offset 2602:fe2e:3:d:f9:c7ff:fef5:379c (ntp.ny1.neptunenetworks.net) | 3.035 | 3.035 | 3.035 | 6.211 | 8.657 | 8.657 | 8.657 | 5.622 | 5.622 | 1.762 | 5.927 | ms | -0.1747 | 2.107 | ||
| Server Offset 2603:c020:0:8369:1111:1111:1111:1112 | -11.664 | -11.664 | -11.664 | -7.858 | 36.147 | 36.147 | 36.147 | 47.810 | 47.810 | 11.106 | -4.696 | ms | 3.087 | 11.48 | ||
| Server Offset 2603:c020:0:8369::bad:beef | -6.830 | -6.830 | -6.830 | -3.090 | -2.867 | -2.867 | -2.867 | 3.963 | 3.963 | 1.885 | -4.862 | ms | 0.002145 | 1.011 | ||
| Server Offset 2603:c020:0:8369:feed:feed:feed:feed | -18.686 | -18.686 | -18.686 | -5.954 | -5.363 | -5.363 | -5.363 | 13.323 | 13.323 | 6.146 | -10.001 | ms | -0.7022 | 1.5 | ||
| Server Offset 2603:c024:c005:a600:efb6:d213:cad8:251d | 1.713 | 1.713 | 1.713 | 11.865 | 68.213 | 68.213 | 68.213 | 66.499 | 66.499 | 21.793 | 19.547 | ms | 1.448 | 3.682 | ||
| Server Offset 2604:8800:52:81:38:229:52:9 (ntp08.cymru.com) | 4.759 | 4.759 | 4.759 | 5.795 | 36.164 | 36.164 | 36.164 | 31.405 | 31.405 | 14.567 | 15.573 | ms | 0.7044 | 1.5 | ||
| Server Offset 2604:a880:400:d0::4ed:f001 (unifi.versadns.com) | 8.916 | 8.916 | 8.916 | 14.499 | 37.032 | 37.032 | 37.032 | 28.115 | 28.115 | 8.702 | 16.497 | ms | 1.735 | 4.537 | ||
| Server Offset 2604:a880:800:10::70f:b001 (ellone.fdisk.io) | 3.373 | 3.373 | 3.373 | 8.241 | 9.581 | 9.581 | 9.581 | 6.208 | 6.208 | 1.791 | 7.376 | ms | -0.8255 | 2.41 | ||
| Server Offset 2604:a880:800:a1::ec9:5001 | -127.479 | -127.479 | -127.479 | 2.162 | 41.342 | 41.342 | 41.342 | 168.821 | 168.821 | 39.256 | 0.196 | ms | -2.482 | 8.766 | ||
| Server Offset 2604:d200::39 (white.web-ster.com) | -6.544 | -6.544 | -4.662 | -2.901 | 28.557 | 30.956 | 30.956 | 33.219 | 37.499 | 9.313 | 0.132 | ms | 2.757 | 9.021 | ||
| Server Offset 2605:4840:3:fb19::1 (chi3.us.ntp.li) | -3.852 | -3.852 | -3.852 | -0.420 | 1.987 | 1.987 | 1.987 | 5.839 | 5.839 | 2.396 | -0.762 | ms | -0.2111 | 1.5 | ||
| Server Offset 2605:6400:488d:2eda:eee9:fe8d:4543:d471 | 6.277 | 6.277 | 6.277 | 6.277 | 6.277 | 6.277 | 6.277 | 0.000 | 0.000 | 0.000 | 6.277 | ms | nan | nan | ||
| Server Offset 2605:6400:488d:3686:546d:c03c:1689:20c | 10.815 | 10.815 | 10.815 | 10.815 | 10.815 | 10.815 | 10.815 | 0.000 | 0.000 | 0.000 | 10.815 | ms | nan | nan | ||
| Server Offset 2605:6f01:2000:18::94ee:fcbe (vps-buf1.orleans.ddnss.de) | -1.370 | -1.370 | -1.370 | 3.697 | 9.921 | 9.921 | 9.921 | 11.292 | 11.292 | 2.854 | 4.172 | ms | 0.1428 | 3.178 | ||
| Server Offset 2606:4700:f1::1 (time.cloudflare.com) | -19.711 | -6.564 | -4.850 | 4.319 | 8.205 | 9.657 | 51.896 | 13.055 | 16.221 | 4.243 | 3.121 | ms | -0.3371 | 6.374 | ||
| Server Offset 2606:4700:f1::123 (time.cloudflare.com) | -68.168 | -4.450 | -2.958 | 4.083 | 8.483 | 10.838 | 429.230 | 11.441 | 15.288 | 11.816 | 3.808 | ms | 30.11 | 1063 | ||
| Server Offset 2606:82c0:21::e (time1.lshiy.com) | -0.347 | -0.347 | -0.347 | 2.470 | 5.026 | 5.026 | 5.026 | 5.373 | 5.373 | 1.632 | 2.157 | ms | 0.07044 | 2.391 | ||
| Server Offset 2606:82c0:22::e (time2.lshiy.com) | 2.084 | 2.084 | 2.084 | 5.198 | 6.067 | 6.067 | 6.067 | 3.983 | 3.983 | 1.710 | 4.450 | ms | -0.5727 | 1.5 | ||
| Server Offset 2606:82c0:23::e (time3.lshiy.com) | 3.326 | 3.326 | 3.326 | 7.253 | 12.695 | 12.695 | 12.695 | 9.369 | 9.369 | 2.739 | 7.383 | ms | 0.4156 | 2.484 | ||
| Server Offset 2607:7c80:54:3::32 | -2.394 | -2.394 | -2.394 | 3.518 | 11.300 | 11.300 | 11.300 | 13.694 | 13.694 | 4.050 | 4.219 | ms | 0.07606 | 1.632 | ||
| Server Offset 2607:9000:7000:23:216:3cff:fe25:38d7 | -7.438 | -7.438 | -7.438 | 1.350 | 6.995 | 6.995 | 6.995 | 14.433 | 14.433 | 4.427 | 0.540 | ms | -0.1739 | 2.018 | ||
| Server Offset 2607:9d00:2000:16::9269:208a (vps-lax1.orleans.ddnss.de) | 0.027 | 0.027 | 0.549 | 5.418 | 11.274 | 17.615 | 17.615 | 10.726 | 17.588 | 3.719 | 5.554 | ms | 1.403 | 5.818 | ||
| Server Offset 2607:f1c0:f06b:5000::1 (ntp11.kernfusion.at) | 2.778 | 2.778 | 2.778 | 7.554 | 7.962 | 7.962 | 7.962 | 5.184 | 5.184 | 1.862 | 6.389 | ms | -1.034 | 2.559 | ||
| Server Offset 2607:f1c0:f06b:5000::3 (ntp11.kernfusion.at) | 3.424 | 3.424 | 3.424 | 9.764 | 40.761 | 40.761 | 40.761 | 37.337 | 37.337 | 12.353 | 15.555 | ms | 1.138 | 2.774 | ||
| Server Offset 2607:f1c0:f06b:5000::4 (ntp11.kernfusion.at) | -2.373 | -2.373 | -1.407 | 3.297 | 10.246 | 11.084 | 11.084 | 11.653 | 13.458 | 3.531 | 3.807 | ms | 0.3808 | 2.37 | ||
| Server Offset 2607:f1c0:f075:9900::1 | -11.364 | -11.364 | -8.290 | 9.893 | 429.232 | 429.472 | 429.472 | 437.522 | 440.836 | 115.991 | 54.692 | ms | 2.751 | 9.098 | ||
| Server Offset 2607:f298:5:101d:f816:3eff:fefd:8817 | 1.052 | 1.052 | 1.052 | 3.678 | 8.611 | 8.611 | 8.611 | 7.559 | 7.559 | 2.139 | 4.559 | ms | 0.3897 | 2.465 | ||
| Server Offset 2607:f5b7:1:44::123 (ntp.wdc2.us.leaseweb.net) | -21.133 | -21.133 | -21.133 | 2.691 | 6.166 | 6.166 | 6.166 | 27.299 | 27.299 | 10.518 | -3.824 | ms | -0.8405 | 2.074 | ||
| Server Offset 2607:f710:35::29c:0:5 | 1.230 | 1.230 | 1.230 | 6.637 | 13.998 | 13.998 | 13.998 | 12.768 | 12.768 | 3.502 | 7.121 | ms | 0.34 | 2.688 | ||
| Server Offset 2607:ff50:0:1a::10 (ntpool0.603.newcontinuum.net) | -158.123 | -158.123 | -158.123 | 3.807 | 12.552 | 12.552 | 12.552 | 170.675 | 170.675 | 66.662 | -31.139 | ms | -1.273 | 2.639 | ||
| Server Offset 2620:8d:c000::f (blotch.image1tech.net) | -12.501 | -12.501 | -12.501 | 0.670 | 15.127 | 15.127 | 15.127 | 27.628 | 27.628 | 9.564 | -0.984 | ms | 0.2932 | 2 | ||
| Server Offset 2620:b0:2000:102::2:123 (time-he.den.codehof.net) | -44.889 | -44.889 | -44.889 | 22.240 | 34.334 | 34.334 | 34.334 | 79.222 | 79.222 | 22.949 | 14.406 | ms | -2.048 | 5.652 | ||
| Server Offset 2a00:d78:0:712:94:198:159:11 (nts1.time.nl) | -573.994 | -18.134 | -6.806 | 2.327 | 5.873 | 12.780 | 70.769 | 12.679 | 30.914 | 9.821 | 1.171 | ms | -30.68 | 1529 | ||
| Server Offset 2a01:3f7:2:44::8 (sth1-ts.nts.netnod.se) | -267.863 | -40.093 | -15.266 | 1.591 | 6.744 | 10.371 | 425.774 | 22.011 | 50.463 | 12.041 | -0.620 | ms | 9.969 | 500.8 | ||
| Server Offset 2a01:3f7:2:44::9 (sth2-ts.nts.netnod.se) | -158.599 | -33.916 | -12.160 | 0.310 | 6.172 | 11.064 | 106.144 | 18.332 | 44.980 | 8.614 | -0.951 | ms | -4.982 | 70.51 | ||
| Server Offset 2a01:4f8:c012:1afb:123:123:123:123 | -662.197 | -43.394 | -29.960 | -14.733 | -7.976 | -0.161 | 153.523 | 21.984 | 43.233 | 17.808 | -15.749 | ms | -19.9 | 818.3 | ||
| Server Offset 2a01:4f9:c013:fa27:123:123:123:123 | -74.656 | -29.575 | -9.456 | 1.270 | 5.487 | 10.806 | 152.944 | 14.943 | 40.381 | 9.896 | 0.343 | ms | 5.416 | 117.1 | ||
| Server Offset 2a01:4ff:f0:7300:123:123:123:123 | -118.920 | -12.890 | -6.246 | -2.163 | 1.265 | 5.208 | 288.663 | 7.511 | 18.098 | 9.301 | -2.445 | ms | 12.21 | 561.8 | ||
| Server Offset 2a01:4ff:f0:ebce::1 | 8.384 | 8.384 | 8.384 | 34.231 | 34.231 | 34.231 | 34.231 | 25.847 | 25.847 | 12.924 | 21.307 | ms | 1.962e-16 | 1 | ||
| Server Offset 2a01:7e03::f03c:95ff:fef8:ac8c (sushi.ruselabs.com) | -51.215 | -51.215 | -51.215 | 6.741 | 19.073 | 19.073 | 19.073 | 70.288 | 70.288 | 23.048 | -2.114 | ms | -1.242 | 3.142 | ||
| Server Offset 2a01:7e04::f03c:94ff:fee2:cba5 | -26.406 | -26.406 | -26.406 | 2.333 | 5.249 | 5.249 | 5.249 | 31.655 | 31.655 | 7.170 | 0.454 | ms | -3.228 | 12.34 | ||
| Server Offset 2a0a:e5c0:2:2:0:c8ff:fe68:beb7 (42-2a0a-e5c0-2-2-0-c8ff-fe68-beb7.loves.ipv6.at.ungleich.ch) | -15.575 | -4.284 | -0.922 | 1.204 | 3.169 | 4.150 | 7.004 | 4.091 | 8.434 | 1.710 | 1.146 | ms | -3.21 | 29.58 | ||
| Server Offset 34.147.28.4 | -2,001.428 | -75.028 | -27.118 | -1.929 | 1.997 | 5.796 | 13.648 | 29.116 | 80.824 | 42.361 | -5.949 | ms | -42.83 | 2012 | ||
| Server Offset 37.27.11.4 | -51.314 | -10.261 | -2.384 | 0.947 | 3.098 | 4.523 | 4.544 | 5.482 | 14.784 | 4.805 | 0.292 | ms | -9.244 | 98.81 | ||
| Server Offset 38.45.64.130 | -257.312 | -73.003 | -9.597 | 5.725 | 9.142 | 13.153 | 177.823 | 18.739 | 86.156 | 24.534 | 3.845 | ms | -3.142 | 73.78 | ||
| Server Offset 40.160.28.79 | -52.835 | -52.513 | -34.382 | -5.004 | 1.626 | 5.643 | 7.374 | 36.008 | 58.156 | 10.906 | -8.229 | ms | -2.157 | 7.89 | ||
| Server Offset 44.190.5.123 | -629.428 | -3.102 | -0.196 | 4.642 | 6.720 | 7.503 | 12.530 | 6.916 | 10.605 | 12.461 | 3.885 | ms | -49.22 | 2501 | ||
| Server Offset 45.33.53.84 | -46.045 | -1.169 | 1.112 | 4.939 | 7.280 | 7.847 | 8.597 | 6.167 | 9.016 | 2.868 | 4.557 | ms | -9.347 | 157.9 | ||
| Server Offset 45.45.184.14 | -3.583 | -3.583 | -2.213 | 2.314 | 5.861 | 8.196 | 8.196 | 8.074 | 11.779 | 2.497 | 2.295 | ms | -0.1048 | 2.439 | ||
| Server Offset 45.55.58.103 | -110.343 | -110.343 | -110.343 | 0.562 | 3.360 | 3.360 | 3.360 | 113.703 | 113.703 | 54.930 | -52.554 | ms | -0.005973 | 1.01 | ||
| Server Offset 45.63.54.13 | -5.411 | -1.371 | 1.271 | 5.500 | 7.544 | 8.410 | 9.171 | 6.272 | 9.781 | 1.966 | 5.094 | ms | -1.358 | 6.142 | ||
| Server Offset 45.77.126.122 | 0.280 | 0.280 | 1.370 | 4.514 | 10.132 | 10.132 | 10.132 | 8.762 | 9.852 | 2.436 | 4.532 | ms | 0.629 | 3.175 | ||
| Server Offset 45.79.111.167 | -49.125 | -40.782 | 1.444 | 5.990 | 9.608 | 11.350 | 11.654 | 8.165 | 52.133 | 5.897 | 5.000 | ms | -7.129 | 62.11 | ||
| Server Offset 45.79.13.35 | 1.657 | 1.657 | 1.657 | 2.347 | 2.347 | 2.347 | 2.347 | 0.691 | 0.691 | 0.345 | 2.002 | ms | 1.884e-15 | 1 | ||
| Server Offset 45.79.227.165 | -24.668 | -5.318 | -2.707 | 1.911 | 9.063 | 13.270 | 899.559 | 11.770 | 18.588 | 52.876 | 5.216 | ms | 16.75 | 283 | ||
| Server Offset 45.79.82.45 | -8.160 | -4.866 | -1.302 | 5.432 | 7.656 | 8.754 | 15.796 | 8.958 | 13.620 | 2.573 | 4.888 | ms | -1.751 | 7.666 | ||
| Server Offset 45.83.234.123 | -92.017 | -33.072 | -11.827 | 2.648 | 8.385 | 11.688 | 37.116 | 20.213 | 44.760 | 8.331 | 1.141 | ms | -3.437 | 28.02 | ||
| Server Offset 47.85.203.40 | -11.482 | -4.542 | -0.158 | 5.077 | 10.458 | 14.417 | 15.104 | 10.616 | 18.959 | 3.390 | 5.170 | ms | -0.3312 | 5.456 | ||
| Server Offset 49.12.103.123 | -104.453 | -96.809 | -69.563 | -6.510 | 5.027 | 15.191 | 21.860 | 74.590 | 112.001 | 23.412 | -14.909 | ms | -1.735 | 5.73 | ||
| Server Offset 5.161.111.190 | -18.177 | -13.919 | -7.797 | -3.175 | 1.189 | 3.412 | 7.582 | 8.985 | 17.330 | 3.150 | -3.351 | ms | -0.7991 | 5.935 | ||
| Server Offset 5.161.65.34 | -8.208 | -8.208 | -5.991 | -2.626 | 391.162 | 391.162 | 391.162 | 397.153 | 399.370 | 139.388 | 55.456 | ms | 1.96 | 4.843 | ||
| Server Offset 5.161.94.12 | -26.311 | -6.511 | -4.811 | -1.264 | 2.953 | 5.663 | 14.347 | 7.764 | 12.174 | 2.580 | -1.106 | ms | -0.4285 | 13.42 | ||
| Server Offset 5.57.11.195 | 7.691 | 7.691 | 7.691 | 9.219 | 9.219 | 9.219 | 9.219 | 1.528 | 1.528 | 0.764 | 8.455 | ms | -3.421e-15 | 1 | ||
| Server Offset 50.117.3.52 | -8.085 | -8.085 | -8.085 | -6.204 | -5.368 | -5.368 | -5.368 | 2.717 | 2.717 | 0.914 | -6.560 | ms | -0.319 | 1.928 | ||
| Server Offset 50.117.3.95 | -146.276 | -146.219 | -10.118 | -1.240 | 4.708 | 17.495 | 18.465 | 14.826 | 163.714 | 15.817 | -2.959 | ms | -8.266 | 75.32 | ||
| Server Offset 50.205.57.38 | -18.950 | -18.950 | -0.288 | 5.249 | 8.633 | 18.417 | 18.417 | 8.921 | 37.367 | 5.890 | 4.328 | ms | -1.998 | 11.57 | ||
| Server Offset 50.218.103.254 | -39.877 | -17.266 | -8.068 | 0.913 | 10.777 | 46.263 | 49.954 | 18.845 | 63.530 | 7.541 | 1.212 | ms | 1.76 | 23.37 | ||
| Server Offset 51.38.58.233 | -9.884 | -9.426 | -5.732 | 1.681 | 3.951 | 4.658 | 5.143 | 9.683 | 14.084 | 3.080 | 0.771 | ms | -1.604 | 5.182 | ||
| Server Offset 51.81.226.229 | -3.807 | -1.522 | 1.150 | 5.163 | 7.612 | 8.830 | 11.602 | 6.462 | 10.352 | 1.992 | 4.930 | ms | -0.7817 | 4.896 | ||
| Server Offset 64.131.47.178 | 0.150 | 0.150 | 0.150 | 4.977 | 8.272 | 8.272 | 8.272 | 8.122 | 8.122 | 2.758 | 4.730 | ms | -0.2318 | 1.933 | ||
| Server Offset 64.251.10.152 | -9.929 | -6.388 | -4.004 | -0.535 | 3.189 | 7.131 | 10.599 | 7.193 | 13.520 | 2.557 | -0.405 | ms | 0.497 | 5.923 | ||
| Server Offset 64.79.100.197 | -5.398 | -2.077 | -0.896 | 2.168 | 4.051 | 5.159 | 7.196 | 4.947 | 7.236 | 1.476 | 2.039 | ms | -0.815 | 6.333 | ||
| Server Offset 65.182.224.39 | -19.040 | -5.987 | -1.441 | 1.538 | 6.062 | 11.148 | 17.628 | 7.503 | 17.136 | 3.013 | 1.733 | ms | -0.05078 | 18.55 | ||
| Server Offset 65.182.224.60 | -4.897 | -4.897 | -2.203 | 1.449 | 6.846 | 10.883 | 10.883 | 9.048 | 15.780 | 2.958 | 1.749 | ms | 0.4925 | 3.551 | ||
| Server Offset 66.118.228.14 | -333.165 | -10.163 | -2.631 | 4.084 | 8.349 | 9.848 | 12.691 | 10.980 | 20.011 | 25.449 | 1.791 | ms | -12.74 | 167.1 | ||
| Server Offset 66.118.229.14 | -46.204 | -13.396 | -8.297 | 4.542 | 8.438 | 12.813 | 14.060 | 16.735 | 26.209 | 5.776 | 3.279 | ms | -3.792 | 28.07 | ||
| Server Offset 66.118.231.14 | -0.952 | -0.952 | -0.952 | 0.349 | 4.672 | 4.672 | 4.672 | 5.623 | 5.623 | 1.689 | 0.982 | ms | 1.225 | 3.534 | ||
| Server Offset 67.210.96.32 | -2.561 | -1.611 | -0.813 | 3.475 | 5.579 | 6.219 | 7.311 | 6.392 | 7.831 | 1.943 | 3.069 | ms | -0.6649 | 2.816 | ||
| Server Offset 67.217.246.204 | -33.203 | -20.781 | -6.815 | -1.590 | 2.829 | 8.831 | 423.145 | 9.644 | 29.611 | 19.691 | -1.014 | ms | 20.08 | 430.2 | ||
| Server Offset 68.183.147.240 | -203.968 | -76.027 | -18.550 | -0.728 | 11.605 | 220.740 | 222.620 | 30.155 | 296.767 | 38.326 | 0.582 | ms | 2.949 | 29.87 | ||
| Server Offset 69.172.133.130 | -90.322 | -90.322 | -90.322 | -0.456 | 5.333 | 5.333 | 5.333 | 95.655 | 95.655 | 30.376 | -13.340 | ms | -1.942 | 5.071 | ||
| Server Offset 69.176.84.38 | -4.887 | -4.887 | -3.512 | 1.450 | 3.073 | 4.499 | 4.499 | 6.585 | 9.386 | 2.266 | 0.622 | ms | -0.718 | 2.493 | ||
| Server Offset 69.89.207.199 | -132.300 | -132.300 | -130.922 | -1.862 | 424.453 | 425.249 | 425.249 | 555.375 | 557.549 | 131.058 | 7.224 | ms | 1.983 | 7.38 | ||
| Server Offset 69.89.207.99 | -82.728 | -4.013 | -2.302 | 1.660 | 4.470 | 7.036 | 20.985 | 6.773 | 11.049 | 3.084 | 1.469 | ms | -10.36 | 286.7 | ||
| Server Offset 71.19.144.140 | -3.221 | -3.221 | -3.221 | 4.015 | 7.428 | 7.428 | 7.428 | 10.649 | 10.649 | 2.867 | 3.283 | ms | -0.3728 | 2.496 | ||
| Server Offset 72.14.182.49 | -1.532 | -0.973 | 0.417 | 4.164 | 7.308 | 8.085 | 8.396 | 6.891 | 9.058 | 1.895 | 4.150 | ms | -0.3723 | 3.354 | ||
| Server Offset 72.14.183.39 | 5.676 | 5.676 | 5.676 | 6.591 | 11.748 | 11.748 | 11.748 | 6.071 | 6.071 | 2.174 | 7.473 | ms | 1.37 | 3.097 | ||
| Server Offset 72.14.186.59 | -10.962 | -10.962 | -6.498 | 5.374 | 7.467 | 8.444 | 8.444 | 13.965 | 19.405 | 4.758 | 3.225 | ms | -1.263 | 3.404 | ||
| Server Offset 72.30.35.88 | -0.550 | 1.048 | 1.636 | 5.649 | 8.897 | 13.400 | 17.485 | 7.262 | 12.352 | 2.267 | 5.458 | ms | 0.7578 | 6.645 | ||
| Server Offset 73.185.182.209 | -385.027 | -375.515 | -5.663 | 1.418 | 6.214 | 8.598 | 12.049 | 11.877 | 384.113 | 43.260 | -3.630 | ms | -8.549 | 74.53 | ||
| Server Offset 74.208.14.149 | -23.137 | -21.739 | -17.023 | -4.566 | -0.923 | 12.871 | 14.795 | 16.100 | 34.610 | 4.966 | -5.349 | ms | -0.1748 | 8.229 | ||
| Server Offset 77.37.97.124 | -93.402 | -30.088 | -6.553 | 8.715 | 13.063 | 17.416 | 35.796 | 19.617 | 47.504 | 8.901 | 6.769 | ms | -5.017 | 41.06 | ||
| Server Offset 77.42.37.85 | -88.107 | -40.517 | -8.386 | 1.614 | 4.988 | 9.257 | 17.475 | 13.374 | 49.775 | 7.967 | 0.338 | ms | -6.267 | 52.3 | ||
| Server Offset 79.160.225.13 | -64.543 | -22.125 | -6.189 | -1.934 | 0.842 | 3.006 | 11.556 | 7.031 | 25.131 | 4.902 | -2.553 | ms | -7.128 | 70.98 | ||
| Server Offset 83.228.206.15 | -137.287 | -103.254 | -84.102 | -4.454 | 5.321 | 17.569 | 31.867 | 89.423 | 120.823 | 27.221 | -15.904 | ms | -1.832 | 6.201 | ||
| Server Offset 91.224.149.196 | -121.847 | -98.542 | -75.284 | -8.905 | 7.896 | 14.505 | 23.694 | 83.180 | 113.048 | 27.019 | -18.387 | ms | -1.305 | 4.331 | ||
| Server Offset 94.198.159.11 | 7.026 | 7.026 | 7.026 | 9.843 | 9.843 | 9.843 | 9.843 | 2.818 | 2.818 | 1.409 | 8.435 | ms | 0 | 1 | ||
| Server Offset 96.19.94.82 | -0.647 | -0.647 | 1.724 | 5.045 | 7.144 | 7.510 | 7.510 | 5.420 | 8.157 | 1.558 | 4.959 | ms | -0.9895 | 4.45 | ||
| Server Offset 96.245.170.99 | -6.017 | -5.876 | -3.123 | 2.815 | 5.216 | 5.802 | 6.038 | 8.339 | 11.679 | 2.351 | 2.390 | ms | -1.525 | 5.442 | ||
| Server Offset 99.28.14.242 | -1,995.690 | -8.739 | -3.055 | 3.487 | 6.341 | 9.535 | 51.057 | 9.396 | 18.274 | 119.026 | -4.338 | ms | -16.63 | 277.9 | ||
| Server Offset SHM(0) | -1,142.216 | -545.438 | -184.677 | -151.939 | -128.845 | -120.245 | 1,345.558 | 55.832 | 425.193 | 69.792 | -164.020 | ms | -4.658 | 29.51 | ||
| Server Offset SHM(1) | -1,005.833 | -8.509 | -7.578 | -4.077 | 0.107 | 0.293 | 2,340.449 | 7.685 | 8.802 | 12.229 | -3.283 | ms | 121.5 | 2.128e+04 | ||
| Server Offset SHM(2) | -192.688 | -183.188 | -178.010 | -164.032 | -139.790 | -135.441 | 1,940.513 | 38.220 | 47.747 | 20.967 | -160.296 | ms | 62.3 | 6095 | ||
| Server Offset SHM(3) | -548.313 | -8.681 | -8.227 | -3.996 | 0.173 | 0.333 | 2,061.810 | 8.400 | 9.014 | 12.708 | -3.151 | ms | 143.1 | 2.3e+04 | ||
| Server Offset SHM(4) | -161.294 | -159.152 | -156.877 | -151.439 | -146.907 | -145.585 | -142.438 | 9.970 | 13.567 | 3.040 | -151.647 | ms | -0.2552 | 2.747 | ||
| Server Offset SHM(5) | -6.986 | -2.942 | -0.617 | -0.144 | 0.385 | 0.584 | 0.760 | 1.002 | 3.526 | 0.562 | -0.162 | ms | -5.053 | 42.24 | ||
| Server Offset SOCK(0) | -193.680 | -178.579 | -176.503 | -171.981 | -167.614 | -165.845 | -162.901 | 8.888 | 12.734 | 2.739 | -171.985 | ms | -0.3001 | 4.286 | ||
| Server Offset SOCK(1) | -10.997 | -6.657 | -6.280 | -0.160 | 0.286 | 0.390 | 2.165 | 6.566 | 7.047 | 2.192 | -1.067 | ms | -1.72 | 4.177 | ||
| Server Offset SOCK(2) | -181.172 | -176.994 | -173.059 | -163.444 | -157.121 | -154.860 | -148.505 | 15.938 | 22.134 | 4.800 | -164.015 | ms | -0.5576 | 3.253 | ||
| Server Offset SOCK(3) | -7.497 | -0.575 | -0.489 | -0.111 | 0.230 | 0.340 | 2.136 | 0.720 | 0.915 | 0.253 | -0.115 | ms | -0.8259 | 28.12 | ||
| TDOP | 0.450 | 0.510 | 0.570 | 0.800 | 11.810 | 11.810 | 11.810 | 11.240 | 11.300 | 2.763 | 1.608 | 3.348 | 12.45 | |||
| Temp /dev/sda | 17.000 | 18.000 | 20.000 | 25.000 | 26.000 | 28.000 | 39.000 | 6.000 | 10.000 | 2.282 | 24.187 | °C | ||||
| Temp LM0 | 26.000 | 30.000 | 32.000 | 35.000 | 41.000 | 45.000 | 59.000 | 9.000 | 15.000 | 2.967 | 35.254 | °C | ||||
| Temp LM1 | 27.000 | 29.000 | 30.000 | 36.000 | 39.000 | 41.000 | 54.000 | 9.000 | 12.000 | 3.126 | 35.246 | °C | ||||
| Temp LM2 | 0.000 | 0.000 | 19.000 | 34.000 | 40.000 | 42.000 | 48.000 | 21.000 | 42.000 | 9.985 | 28.928 | °C | ||||
| Temp LM3 | 0.000 | 0.000 | 3.000 | 31.000 | 40.000 | 42.000 | 50.000 | 37.000 | 42.000 | 10.872 | 30.007 | °C | ||||
| Temp LM4 | 0.000 | 0.000 | 0.000 | 33.000 | 43.000 | 47.000 | 55.000 | 43.000 | 47.000 | 18.347 | 22.667 | °C | ||||
| Temp LM5 | 26.000 | 28.000 | 29.000 | 31.000 | 41.000 | 43.000 | 53.000 | 12.000 | 15.000 | 3.922 | 32.452 | °C | ||||
| Temp LM6 | 0.000 | 30.000 | 31.000 | 33.000 | 36.000 | 43.000 | 50.000 | 5.000 | 13.000 | 2.027 | 33.573 | °C | ||||
| Temp LM7 | 0.000 | 19.000 | 33.000 | 35.000 | 38.000 | 39.000 | 51.000 | 5.000 | 20.000 | 2.562 | 35.051 | °C | ||||
| Temp LM8 | 26.800 | 32.000 | 33.000 | 35.000 | 38.000 | 40.000 | 51.000 | 5.000 | 8.000 | 1.797 | 35.466 | °C | ||||
| Temp LM9 | 26.800 | 32.000 | 33.000 | 35.000 | 38.000 | 45.000 | 51.000 | 5.000 | 13.000 | 2.043 | 35.536 | °C | ||||
| Temp ZONE0 | 20.000 | 20.000 | 20.000 | 20.000 | 20.000 | 20.000 | 20.000 | 0.000 | 0.000 | 0.000 | 20.000 | °C | ||||
| Temp ZONE1 | 26.800 | 31.000 | 32.000 | 34.000 | 38.000 | 45.000 | 51.000 | 6.000 | 14.000 | 2.128 | 34.761 | °C | ||||
| Temp ZONE2 | 26.000 | 28.000 | 29.000 | 31.000 | 41.000 | 41.000 | 44.000 | 12.000 | 13.000 | 3.919 | 32.880 | °C | ||||
| Temp ZONE3 | 29.000 | 32.000 | 32.000 | 34.000 | 38.000 | 46.000 | 54.000 | 6.000 | 14.000 | 2.202 | 34.752 | °C | ||||
| Temp ZONE4 | 26.800 | 31.000 | 32.000 | 34.000 | 38.000 | 45.000 | 51.000 | 6.000 | 14.000 | 2.128 | 34.761 | °C | ||||
| Temp ZONE5 | 28.000 | 31.000 | 31.000 | 36.000 | 44.000 | 47.000 | 58.000 | 13.000 | 16.000 | 3.766 | 36.950 | °C | ||||
| Temp ZONE6 | 26.000 | 28.000 | 29.000 | 31.000 | 36.000 | 39.000 | 46.000 | 7.000 | 11.000 | 2.373 | 31.462 | °C | ||||
| nSats | 7.000 | 9.000 | 10.000 | 13.000 | 17.000 | 19.000 | 22.000 | 7.000 | 10.000 | 2.477 | 13.281 | nSat | 0.266 | 2.384 | ||
Stats for the last 1, 7, 35, 98, 371, some days, or live gps data.
Glossary:
- frequency offset:
- The difference between the ntpd calculated frequency and the local system clock frequency (usually in parts per million, ppm)
- jitter, dispersion:
- The short term change in a value. NTP measures Local Time Jitter, Refclock Jitter, and Server Jitter in seconds. Local Frequency Jitter is in ppm or ppb.
- ms, millisecond:
- One thousandth of a second = 0.001 seconds, 1e-3 seconds
- mu, mean:
- The arithmetic mean: the sum of all the values divided by the number of values. The formula for mu is: "mu = (∑xi) / N". Where xi denotes the data points and N is the number of data points.
- ns, nanosecond:
- One billionth of a second, also one thousandth of a microsecond, 0.000000001 seconds and 1e-9 seconds.
- percentile:
- The value below which a given percentage of values fall.
- ppb, parts per billion:
- Ratio between two values. These following are all the same: 1 ppb, one in one billion, 1/1,000,000,000, 0.000,000,001, 1e-9 and 0.000,000,1%
- ppm, parts per million:
- Ratio between two values. These following are all the same: 1 ppm, one in one million, 1/1,000,000, 0.000,001, and 0.000,1%
- ‰, parts per thousand:
- Ratio between two values. These following are all the same: 1 ‰. one in one thousand, 1/1,000, 0.001, and 0.1%
- refclock:
- Reference clock, a local GPS module or other local source of time.
- remote clock:
- Any clock reached over the network, LAN or WAN. Also called a peer or server.
- time offset:
- The difference between the ntpd calculated time and the local system clock's time. Also called phase offset.
- σ, sigma:
- Sigma denotes the standard deviation (SD) and is centered on the
arithmetic mean of the data set. The SD is simply the square root of
the variance of the data set. Two sigma is simply twice the standard
deviation. Three sigma is three times sigma. Smaller is better.
The formula for sigma is: "σ = √[ ∑(xi-mu)^2 / N ]". Where xi denotes the data points and N is the number of data points. - Skewness, Skew:
- The skewness of a random variable X is the third standardized moment
and is a dimension-less ratio. ntpviz uses the FIsher-Pearson moment
of skewness. There are other different ways to calculate Skewness
Wikipedia describes Skewness best: "The qualitative interpretation of
the skew is complicated and unintuitive."
A normal distribution has a skewness of zero. - Kurtosis, Kurt:
- The kurtosis of a random variable X is the fourth standardized
moment and is a dimension-less ratio. ntpviz uses standard
Kurtosis. There are other different ways to calculate Kurtosis.
A normal distribution has a Kurtosis of three. NIST describes a kurtosis over three as "heavy tailed" and one under three as "light tailed". - upstream clock:
- Any server or reference clock used as a source of time.
- µs, us, microsecond:
- One millionth of a second, also one thousandth of a millisecond, 0.000,001 seconds, and 1e-6 seconds.

